


-
Light microscopes, undoubtedly, are one of the most widely used devices in life and material sciences allowing us to study the interaction of light with matter at a resolution better than that of the naked eye. While a human eye has ~70 μm resolution at its 25 cm near point; a light microscope provides us with at least 2 orders of magnitude resolution enhancement enabling sample inspection at ~0.2 μm resolution1. Conventional microscopes translate the difference in intensity in an object to a brightness difference in the image. A phase microscope, on the other hand, converts the spatial differences in phase in the object to a difference in pixel brightness in the image. Interference microscopy, a phase-based approach, has found application in various disciplines.
Phase microscopy can be divided into two broad categories: phase-contrast and interference microscopies. In a phase-contrast microscope, contrast from a transparent object arises from constructive or destructive interference that takes place at the image plane between the nondeviated and deviated waves that emerge from each point on the specimen. In an interference microscope, the contrast is generated by the interference of the light wave, which passes through each point of the specimen, and, a reference wave that is coherent with the light that passes through the specimen. This approach facilitates the possibility of making quantitative phase evaluations and is therefore also referred to as quantitative phase microscopy (QPM). Although it is possible to perform QPM through non-interferometric techniques as well2, QPM in this review refers to interferometric-based approaches.
Enhancing the resolution in microscopy has been subject to intense investigation since the invention of the microscope3-6. In the past decade, microsphere-assisted microscopy (MAM), the use of transparent microspheres to enhance the resolution, has emerged as a simple yet efficient approach to enhance microscopy resolution3,7. In this work, we review the integration of microspheres with interference microscopy to enhance the resolution.
-
Similar to conventional microscopes, quantitative phase microscopes are subject to the fundamental lateral resolution limit following from diffraction of light waves. Whereas Abbe's resolution limit represents a fundamental physical limitation, there are several more or less arbitrary resolution criteria, which are applied depending on the field of application. The most popular among them are the Rayleigh, Sparrow, and Houston criteria3. In general, each resolution criterion defines a minimum lateral distance $ {l}_{x}=K\lambda /NA $ between two adjacent features of the measurement object, at which these features can be separated in the microscopic image depending on the illumination wavelength $ \lambda $ and the numerical aperture (NA) of the microscope objective (MO). Solely, the factor $ K $ depends on the respective resolution criterion and whether the microscope operates in reflection or transmission mode. A detailed description of existing lateral resolution criteria is provided by Singer et al.8. For a comprehensive description of resolution especially in the context of ‘super-resolution’, we refer to Sheppard9. A discussion of resolution criteria and their usage associated with MAM is given by Darafsheh3. However, all of the listed resolution criteria are related to the resolution capabilities in the image plane, referred to as 2D resolution. An introduction to common definitions of 2D and 3D resolution with respect to microsphere-assisted interference microscopy is provided by Pahl et al.10.
Since QPM is used to measure 2D1/2 and 3D objects as it is required in surface topography (2D1/2) and tomography (3D) measurement, one has to distinguish between 2D and 3D resolution. In the case of conventional microscopy, a common definition of 2D resolution is provided by the modulation transfer function (MTF), which describes the imaged intensity contrast normalized by its maximum depending on the lateral spatial frequency. The 3D transfer function (3D TF)8 describes the transfer behavior in 3D spatial frequency domain and is part of various recent studies11-13. The 3D TF is of particular interest in interference microscopy since phase analysis enables to study contributions at certain axial spatial frequencies13. Integrating the 3D TF with respect to the axial frequency component, which equals the interference fringe frequency, results in the well-known MTF12. The 3D Fourier transform of the 3D TF results in a 3D point spread function (PSF), from which the 3D resolution can be obtained in a similar manner as the 2D resolution from the 2D PSF. For consistency, 2D PSF needs to agree with the 2D Fourier transform of the MTF. Another definition of 3D resolution frequently used in the context of surface topography measurement is based on the instrument transfer function (ITF)14. The ITF is defined by the measured amplitude of a sinusoidal phase object normalized by its nominal height depending on the lateral spatial frequency and is therefore more expressive compared to the MTF for surface topography measurement.
Since microsphere-assisted QPM mainly targets the enhancement of lateral resolution, in this review, the enhancement of 2D resolution is considered. However, in the case of interference microscopy, the 3D TF is used as a tool to analyze measured signals in the 3D spatial frequency domain to obtain more insight into the transfer characteristics of microsphere-assisted interference microscopy15.
It should be mentioned that there are different definitions of super-resolution among scientists in the field. In one definition, super-resolution refers to the ability to break Abbe’s limit and resolve structures down to a few nanometers. In the other definition, super-resolution refers to enhancing resolution beyond the intrinsic resolution capabilities of the imaging system, whether the structure is below the diffraction limit or not16.
-
QPM is a powerful investigation tool in multiple scientific areas due to its non-invasive and quantitative nature, which combines advantageous attributes of microscopy, interferometry, holography, and numerical computations17. Applying the interference principle in microscopy yields high-contrast quantitative phase images of transparent objects that would otherwise be invisible, as well as revealing their thickness information. This approach allows for detailed imaging of the object’s morphology and optical properties, offering valuable insights for a variety of applications in fields such as biological research and material science. In QPM, the lateral resolution, in addition to the dependence on the performance of the imaging system, also depends on the features of the recording sensor and the spatial frequency windowing within the numerical reconstruction process. On the other hand, the axial resolution is defined by the sensitivity of the detection system to optical path length changes18. While interferometry has enabled conventional microscopy to achieve nanometric axial resolution, QPM’s lateral resolution has remained limited by diffraction to several hundred nanometers.
Several approaches have been proposed to enhance the spatial resolution in QPM19. These techniques aim to improve the resolution by restricting other degrees of freedom, such as time. Some of the most effective and useful techniques used to improve resolution in traditional microscopy can also be applied to QPM. These include oblique illumination, structured illumination, and speckle illumination. Oblique illumination involves shining a beam of light onto the sample at an angle that is not aligned with the optical axis. This allows for the recovery of additional apertures that are off-axis, and these can then be combined to create a larger aperture. However, oblique illumination requires the sequential recording of different intensity images, which makes it less suitable for capturing fast-moving samples. Structured illumination, on the other hand, involves illuminating the sample with a light source that has a specific pattern, such as a grating or random pattern. By analyzing the interference between the structured illumination and the sample, it is possible to improve the resolution. The advantage of structured illumination is that it can achieve high-resolution imaging without the need for mechanical scanning. However, it can be prone to additional noise and may require complex image processing algorithms. Speckle illumination utilizes the random interference patterns that are produced when a laser beam scatters off a rough surface. By analyzing these speckle patterns, it is possible to enhance the resolution in QPM. The main advantage of speckle illumination is its simplicity and ease of use. However, it can be affected by coherent noise. MAM has shown promising potential in improving the lateral resolution by considerably boosting the system’s effective NA, leading to 3D label-free microscopy with enhanced resolution.
-
Coherence scanning interference microscopy (CSIM) and digital holographic microscopy (DHM) are two QPM techniques used for nano-scale axial and high lateral resolution microscopy of non-transparent and transparent samples. Both techniques operate by capturing interference patterns between an object and a reference field. CSIM is based on on-axis interference (the two arms, object and reference, have the same optical axis). The introduction of controlled phase shifts between the two arms is used to measure the phase shift introduced by the sample. This phase shift is based on variations in optical path length and refractive index in the sample. At least capturing three images is required and generally a low coherent source is used. DHM is based on off-axis interference. DHM records the complex wavefront of the object by simultaneously recording both amplitude and phase information in the interference pattern as a hologram.
The digital hologram is then numerically reconstructed into 3D quantitative images. Only one image capture is required and generally high coherence source is required. Both techniques offer the advantage of label-free microscopy, eliminating the need for potentially harmful staining or labeling procedures. While coherence scanning interference microscopy is rather sensitive to mechanical and environmental vibrations, making it more suitable for static samples, thin film analysis, and surface topography measurements, DHM has emerged as a powerful single-shot approach for obtaining information about the shape, thickness, and refractive index of a live object. It has versatile applications across life and material sciences. DHM stands out for its numerical refocusing capability, which allows for non-invasive post-recording adjustments of the image plane for 3D quantitative phase imaging without physical changes. In addition, DHM’s numerical reconstruction can remove contamination, image distortion, and aberrations in the optical train, enhancing data accuracy and facilitating diverse applications. This enhancement of data accuracy facilitates diverse applications, with DHM’s adaptability extending to real-time imaging. This makes it particularly suited for dynamic observations, such as live cell processes. Another difference is due to the possibility of using low coherent light, the CSIM has generally a lower sensitivity to speckle noise.
-
Dielectric micron-scale particles with curved surfaces, such as microspheres and microcylinders, have attracted intense recent research efforts due to their extraordinary light-focusing properties that are interesting for a plethora of potential applications in various fields including sensing and imaging20. MAM7, in its most basic form, uses a microsphere placed over the specimen that increases the effective NA of the system, allowing the collection of light at larger diffracted angles, hence improving the resolution of a given system compared to that in the absence of the microsphere.
Schematic of a MAM setup and ray tracing of image formation is shown in Fig. 1. As can be seen, a virtual image with magnification is formed underneath the specimen by the microsphere that is captured by focusing of the objective lens on the virtual image. In terms of the refractive index of the microspheres, both low-to-medium refractive index ($ n $~1.4-1.6) microspheres operating in air as the background medium and high-index ($ n $>1.9) microspheres surrounded by a liquid or elastomer background medium with significantly lower index have been employed in MAM3. The latter case is interesting due to its potential in fabrication of novel resolution-enhancing optical devices by fixing microspheres in solidified films21,22.
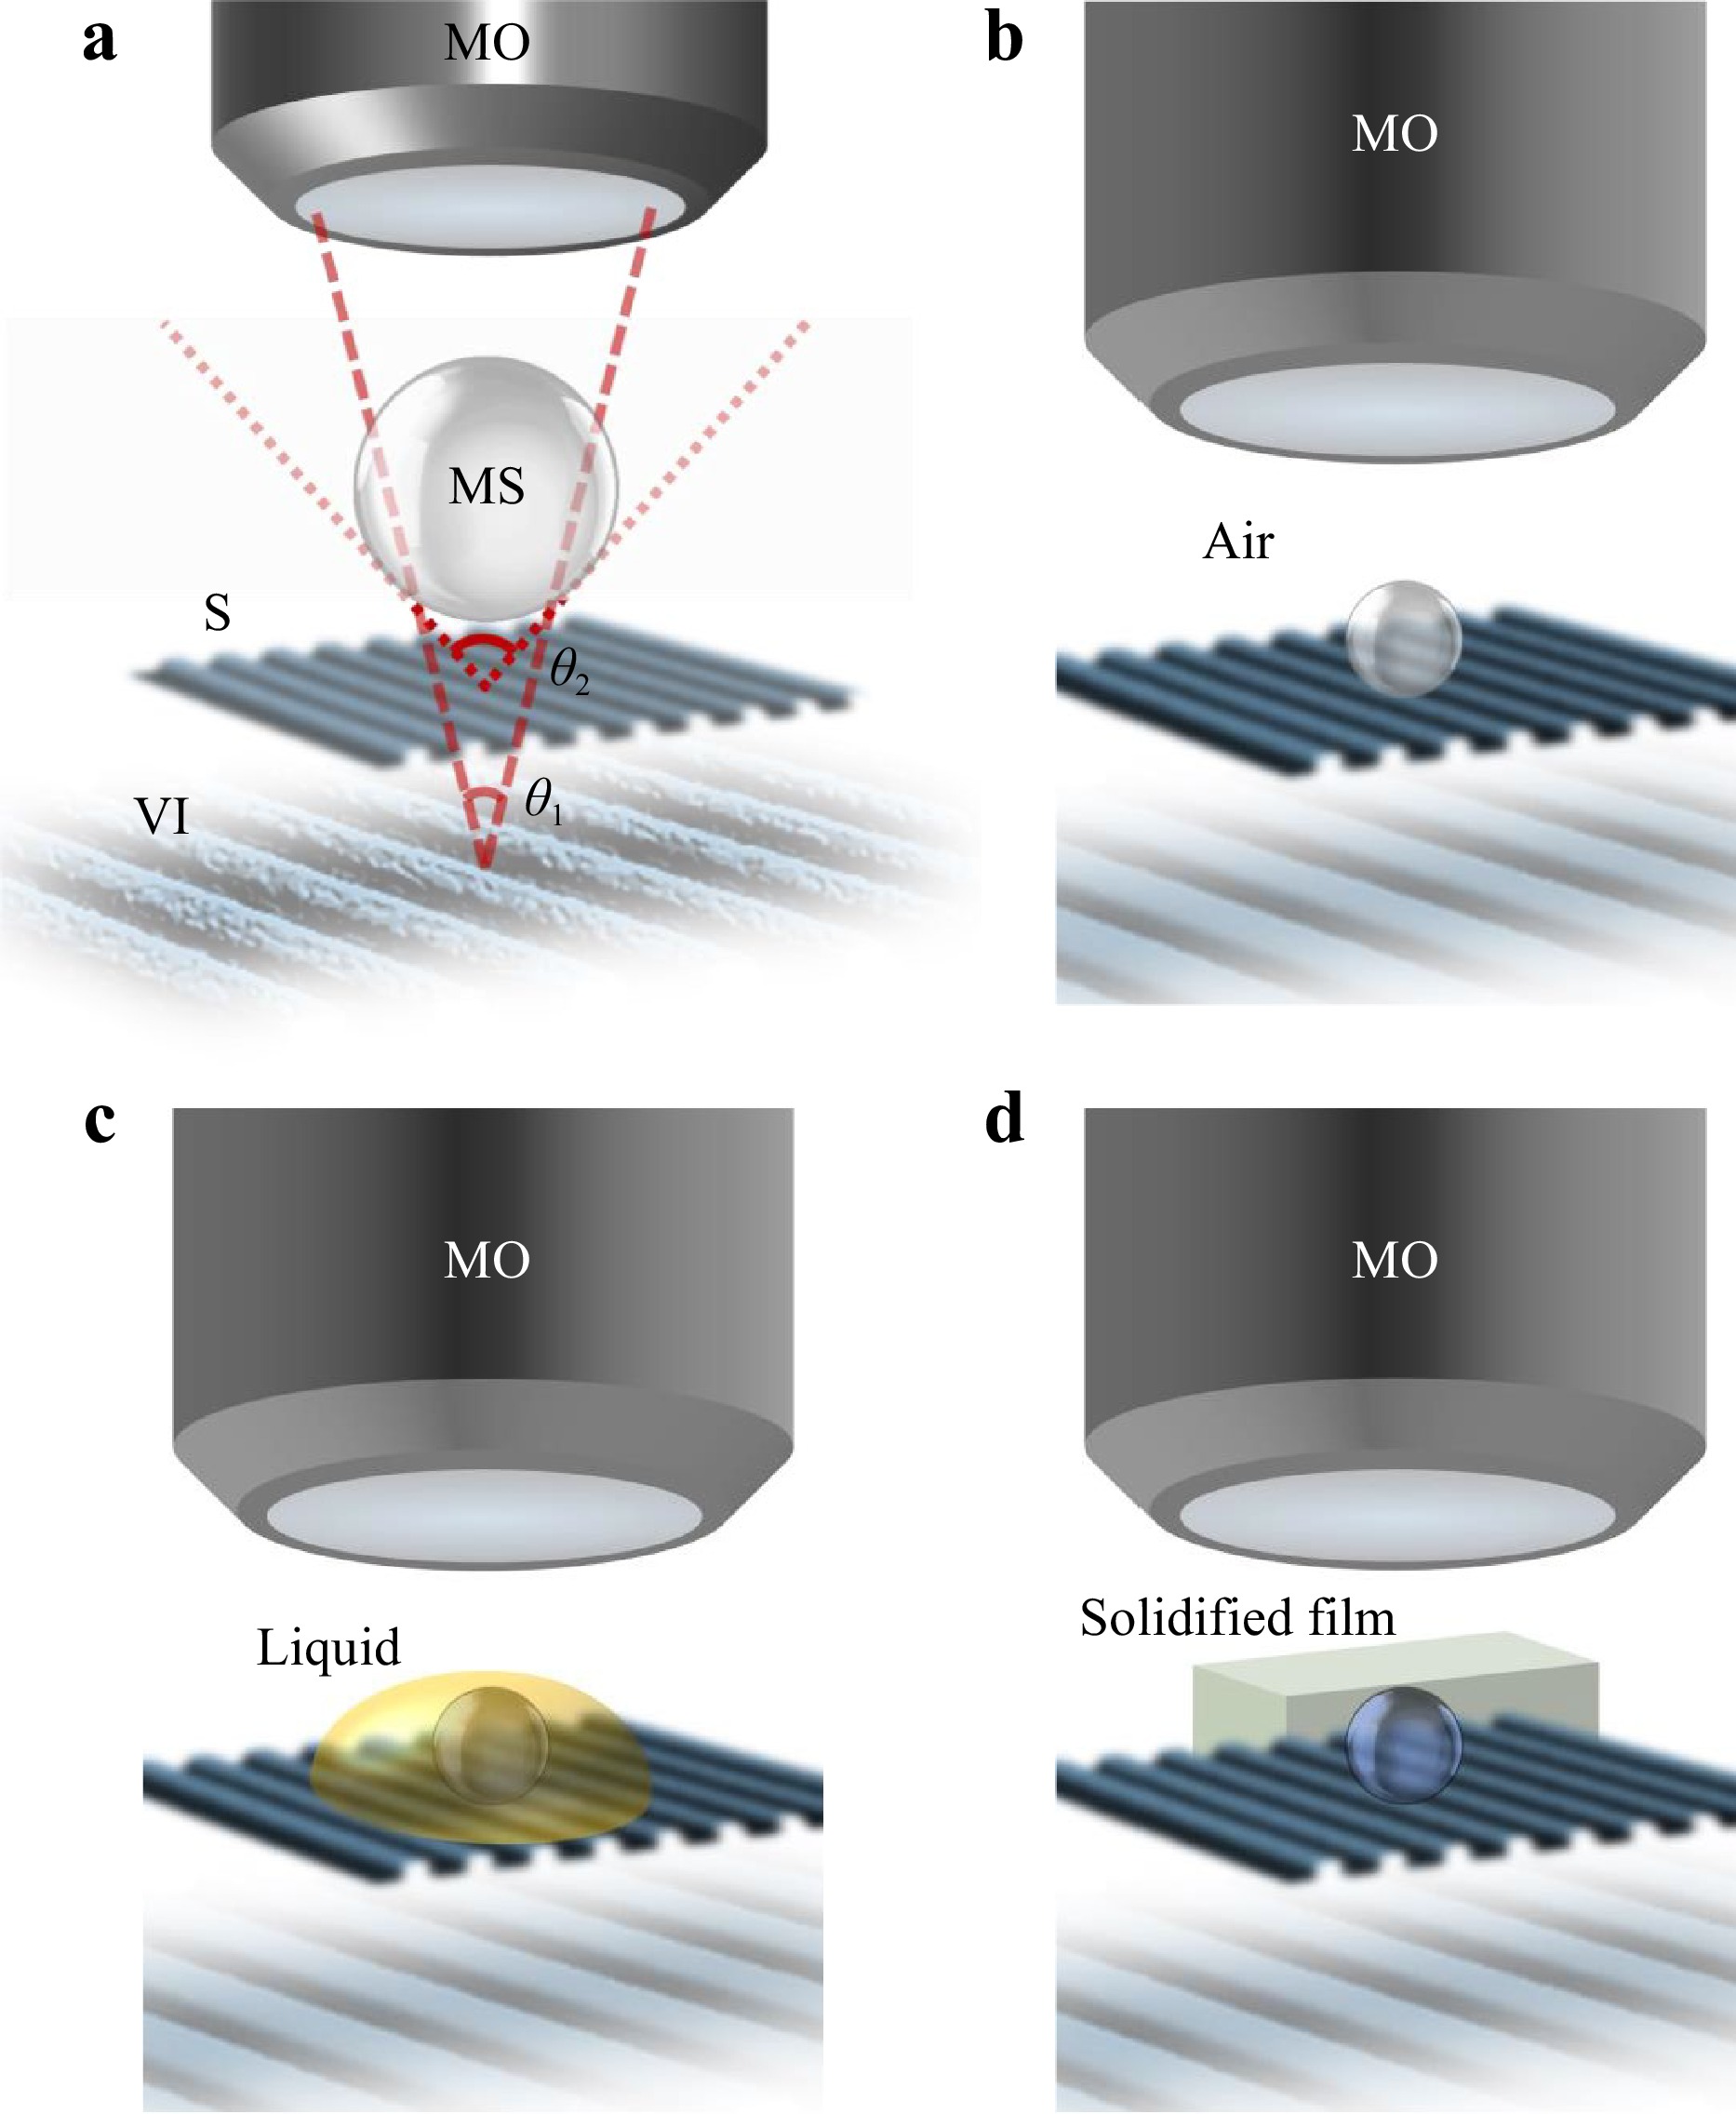
Fig. 1 Schematic of a Ray-tracing for virtual image formation in MAM; MAM setup using a b low-index spheres working in air, c high-index sphere submerged in a liquid droplet, and d high-index sphere embedded in a solidified film; S: sample; MS: microsphere; VI: virtual image; MO: microscope objective.
Due to the mesoscale nature of the spheres, their imaging properties do not quantitatively follow the laws of geometrical optics23,24. For example, it has been shown that the magnification and imaging field-of-view (FoV) strongly vary with the microsphere size25,26. The resolution enhancement factor also depends on the microsphere size27. Hence, for a given application, an optimized microsphere, in terms of size (diameter, $ D $) and index ($ n $), should be selected. Interestingly, it has been shown that the background medium surrounding the microspheres plays a role in their imaging properties and can potentially be used as an optimization parameter28.
MAM has been used in combination with several microscopic imaging techniques such as confocal29, fluorescent30,31, second harmonic generation (SHG), two-photon32, dark-field33, and interferometric and digital holographic microscopies to either improve their performance or provide new functionalities. The rest of the paper deals in more detail with the integration of MAM in phase microscopy.
MAM is a versatile technique that can be extended to coherence scanning interference and digital holographic microscopies to achieve 3D imaging with improved resolution. Microsphere-assisted interference microscopy offers a cost-effective and non-destructive high-speed single-shot imaging method for 3D surface metrology, and microsphere-assisted digital holographic microscopy provides a real-time method for high-contrast quantitative phase imaging in both transmission and reflection modes. Furthermore, QPM arrangements improved by MAM have the flexibility to be integrated with other methodologies, such as structured illumination34 and oblique illumination35, to achieve further enhancements in resolution or other adjustments.
-
Interference microscopy is known for its outstanding axial resolution with height measurement uncertainties down to the subnanometer range. In order to improve the lateral resolution, interference microscopy is combined with optical microelements in the following referred to as microsphere-assisted CSIM. Fig. 2 shows a schematic representation of a microsphere-assisted interference microscope in the Linnik configuration as an example. Linnik interferometers are characterized by two equal MO lenses, one put in the object the other one in the reference arm. Other frequently applied configurations are the Michelson and the Mirau interferometer36.
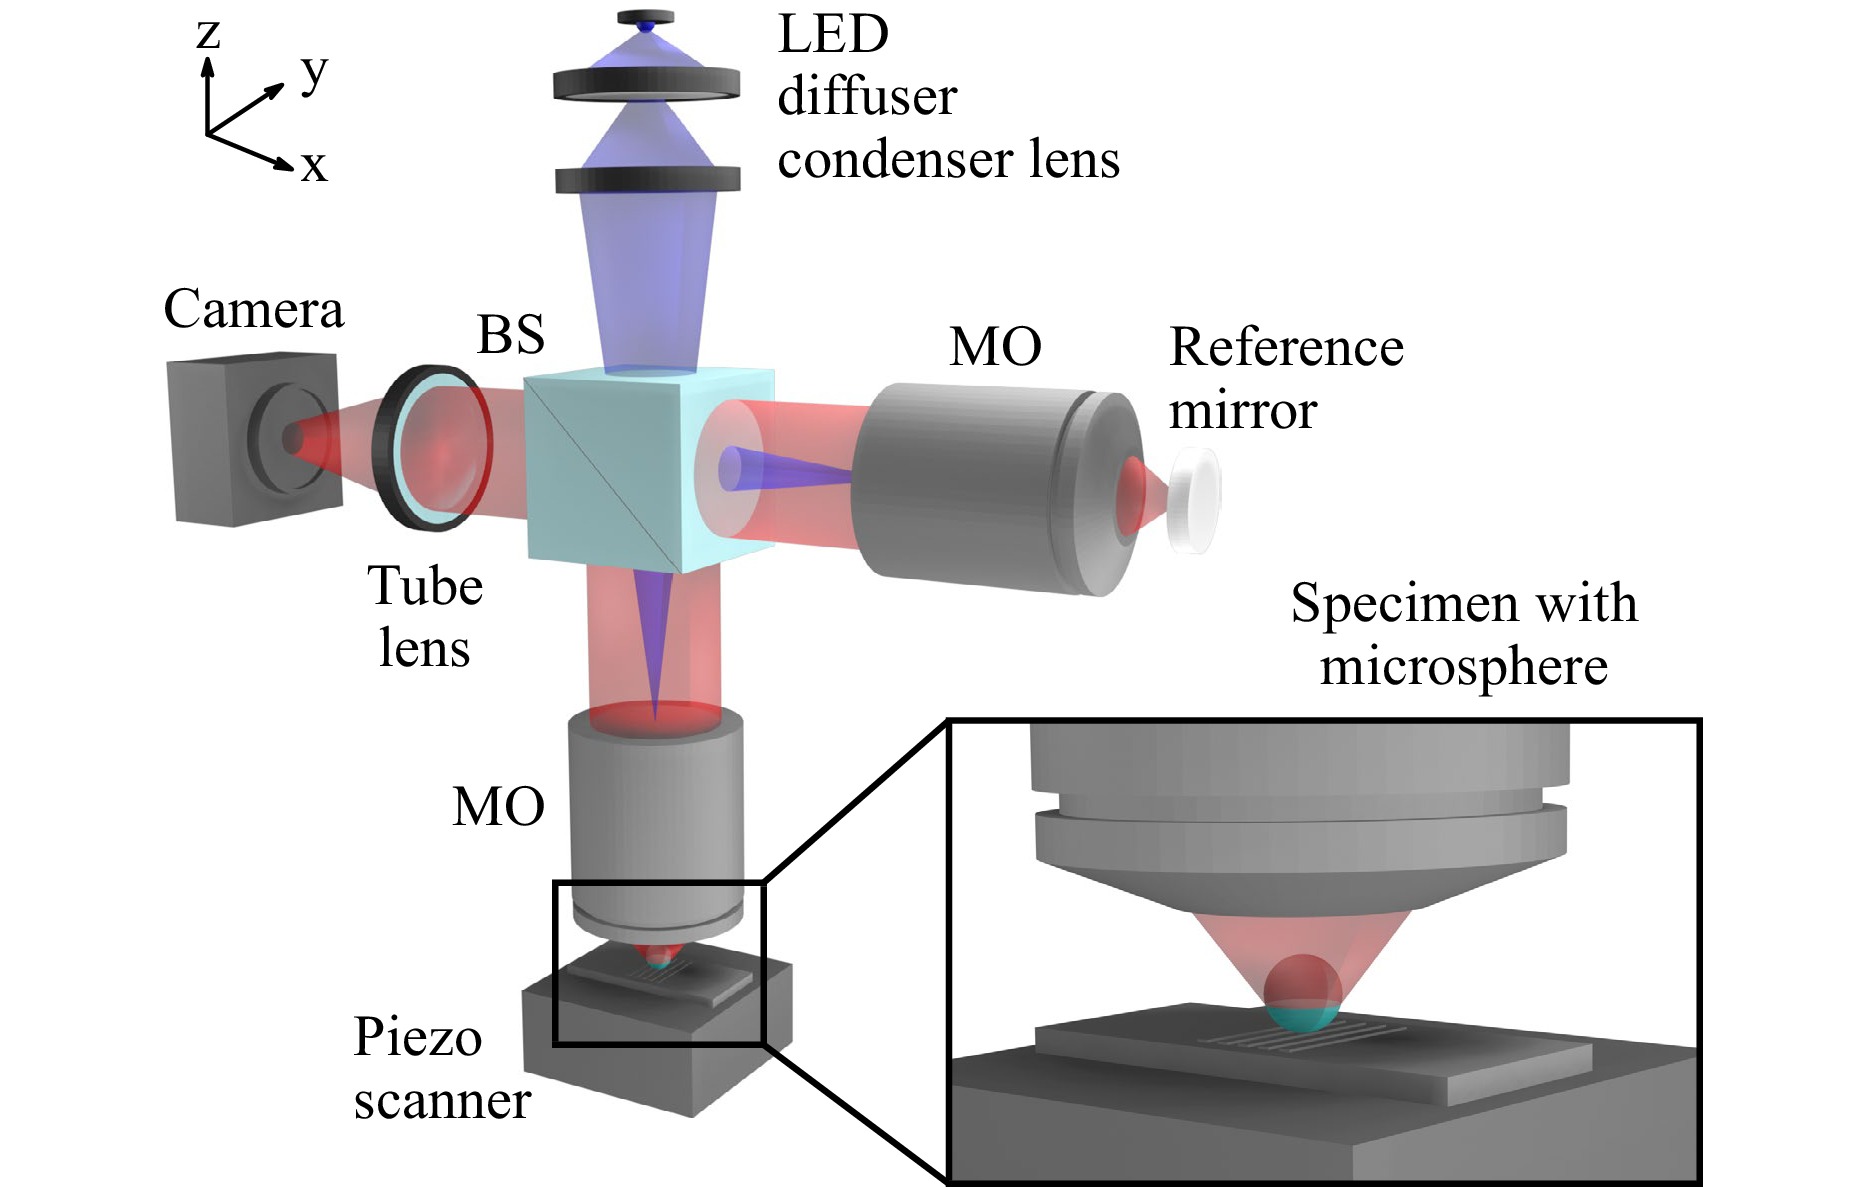
Fig. 2 Schematic representation of a microsphere-assisted interference microscope based on the Linnik configuration comprising two MO lenses and a beam splitter (BS). The illumination beam path, which corresponds to Kӧhler illumination is shown in blue, the imaging beam path in red. The illumination beam path appearing as a plane wave below the objective lens is omitted for better visibility. The figure is not drawn to scale to enhance comprehensibility. Adapted from Ref. 40. Copyright 2023 Author(s), licensed under a Creative Commons Attribution license.
The illumination beam path sketched in blue in Fig. 2 corresponds to Kӧhler illumination. A spatially extended light source represented by an LED with a diffuser is imaged in the pupil plane of the objective lenses. Hence, each point in the pupil plane is illuminated by another point of the light source, leading to spatially incoherent illumination of the measurement object. The imaging beam path is shown in red. The light reflected from the object in combination with the microelement, and the light reflected from the reference mirror interfere and the intensity of the superimposed field is recorded by a camera.
The measurement object is placed on a piezo scanner in order to enable axial movement and to obtain depth information. Alternatively, the whole microscope setup can be moved axially, while the object remains at the same axial position. In the case of coherence scanning interferometry (CSI), the axial scan is performed in small equidistant steps leading to an interference signal for each camera pixel separately. From these signals, the object’s topography can be reconstructed using both envelope as well as phase information of the interference signals. In phase-shifting interferometry (PSI) the axial scan is performed with step sizes of an integral divisor of the central illumination wavelength enabling phase reconstruction typically based on four or five interference images. For a more detailed overview of CSI and PSI we refer to de Groot37,38. A comparison of PSI and CSI especially with respect to different signal analysis techniques is provided by Lehmann et al.39. Note that the CSI and PSI operation modes can be used in combination with all three interferometer configurations.
Generally, microsphere-assisted CSIM is investigated experimentally as well as theoretically. In the first part of this section, major experimental results are summarized. The second part deals with theoretical and numerical considerations related to microsphere-assisted CSIM.
-
The first reference of MAM for phase measurement is the paper of Wang in 201641. A probably over-estimated lateral resolution of 60 nm was claimed by placing a BaTiO3 microsphere (n = 1.9 and D = 20−100 μm) in water in the object arm of a Linnik interferometer. At the same time, Kassamakov et al. proposed the use of a microsphere (n = 1.68 and D = 11 μm) in a Mirau configuration in the air to achieve the profile measurements of a Blu-ray disc (Fig. 3a)42. In these two techniques, on-axis interference between light from an object arm and a reference arm create interference fringes superimposed on an image of the sample. Depending on the light source used, several fringe patterns are acquired with known phase shift differences introduced between the object and reference wavefronts, allowing the phase response and then for example a topography to be reconstructed. The microsphere, in contact or at less than 1 μm to the sample, allows the lateral resolution to be increased. Its phase response must be subtracted. The diameter of the FoV is around a fifth of the sphere diameter.
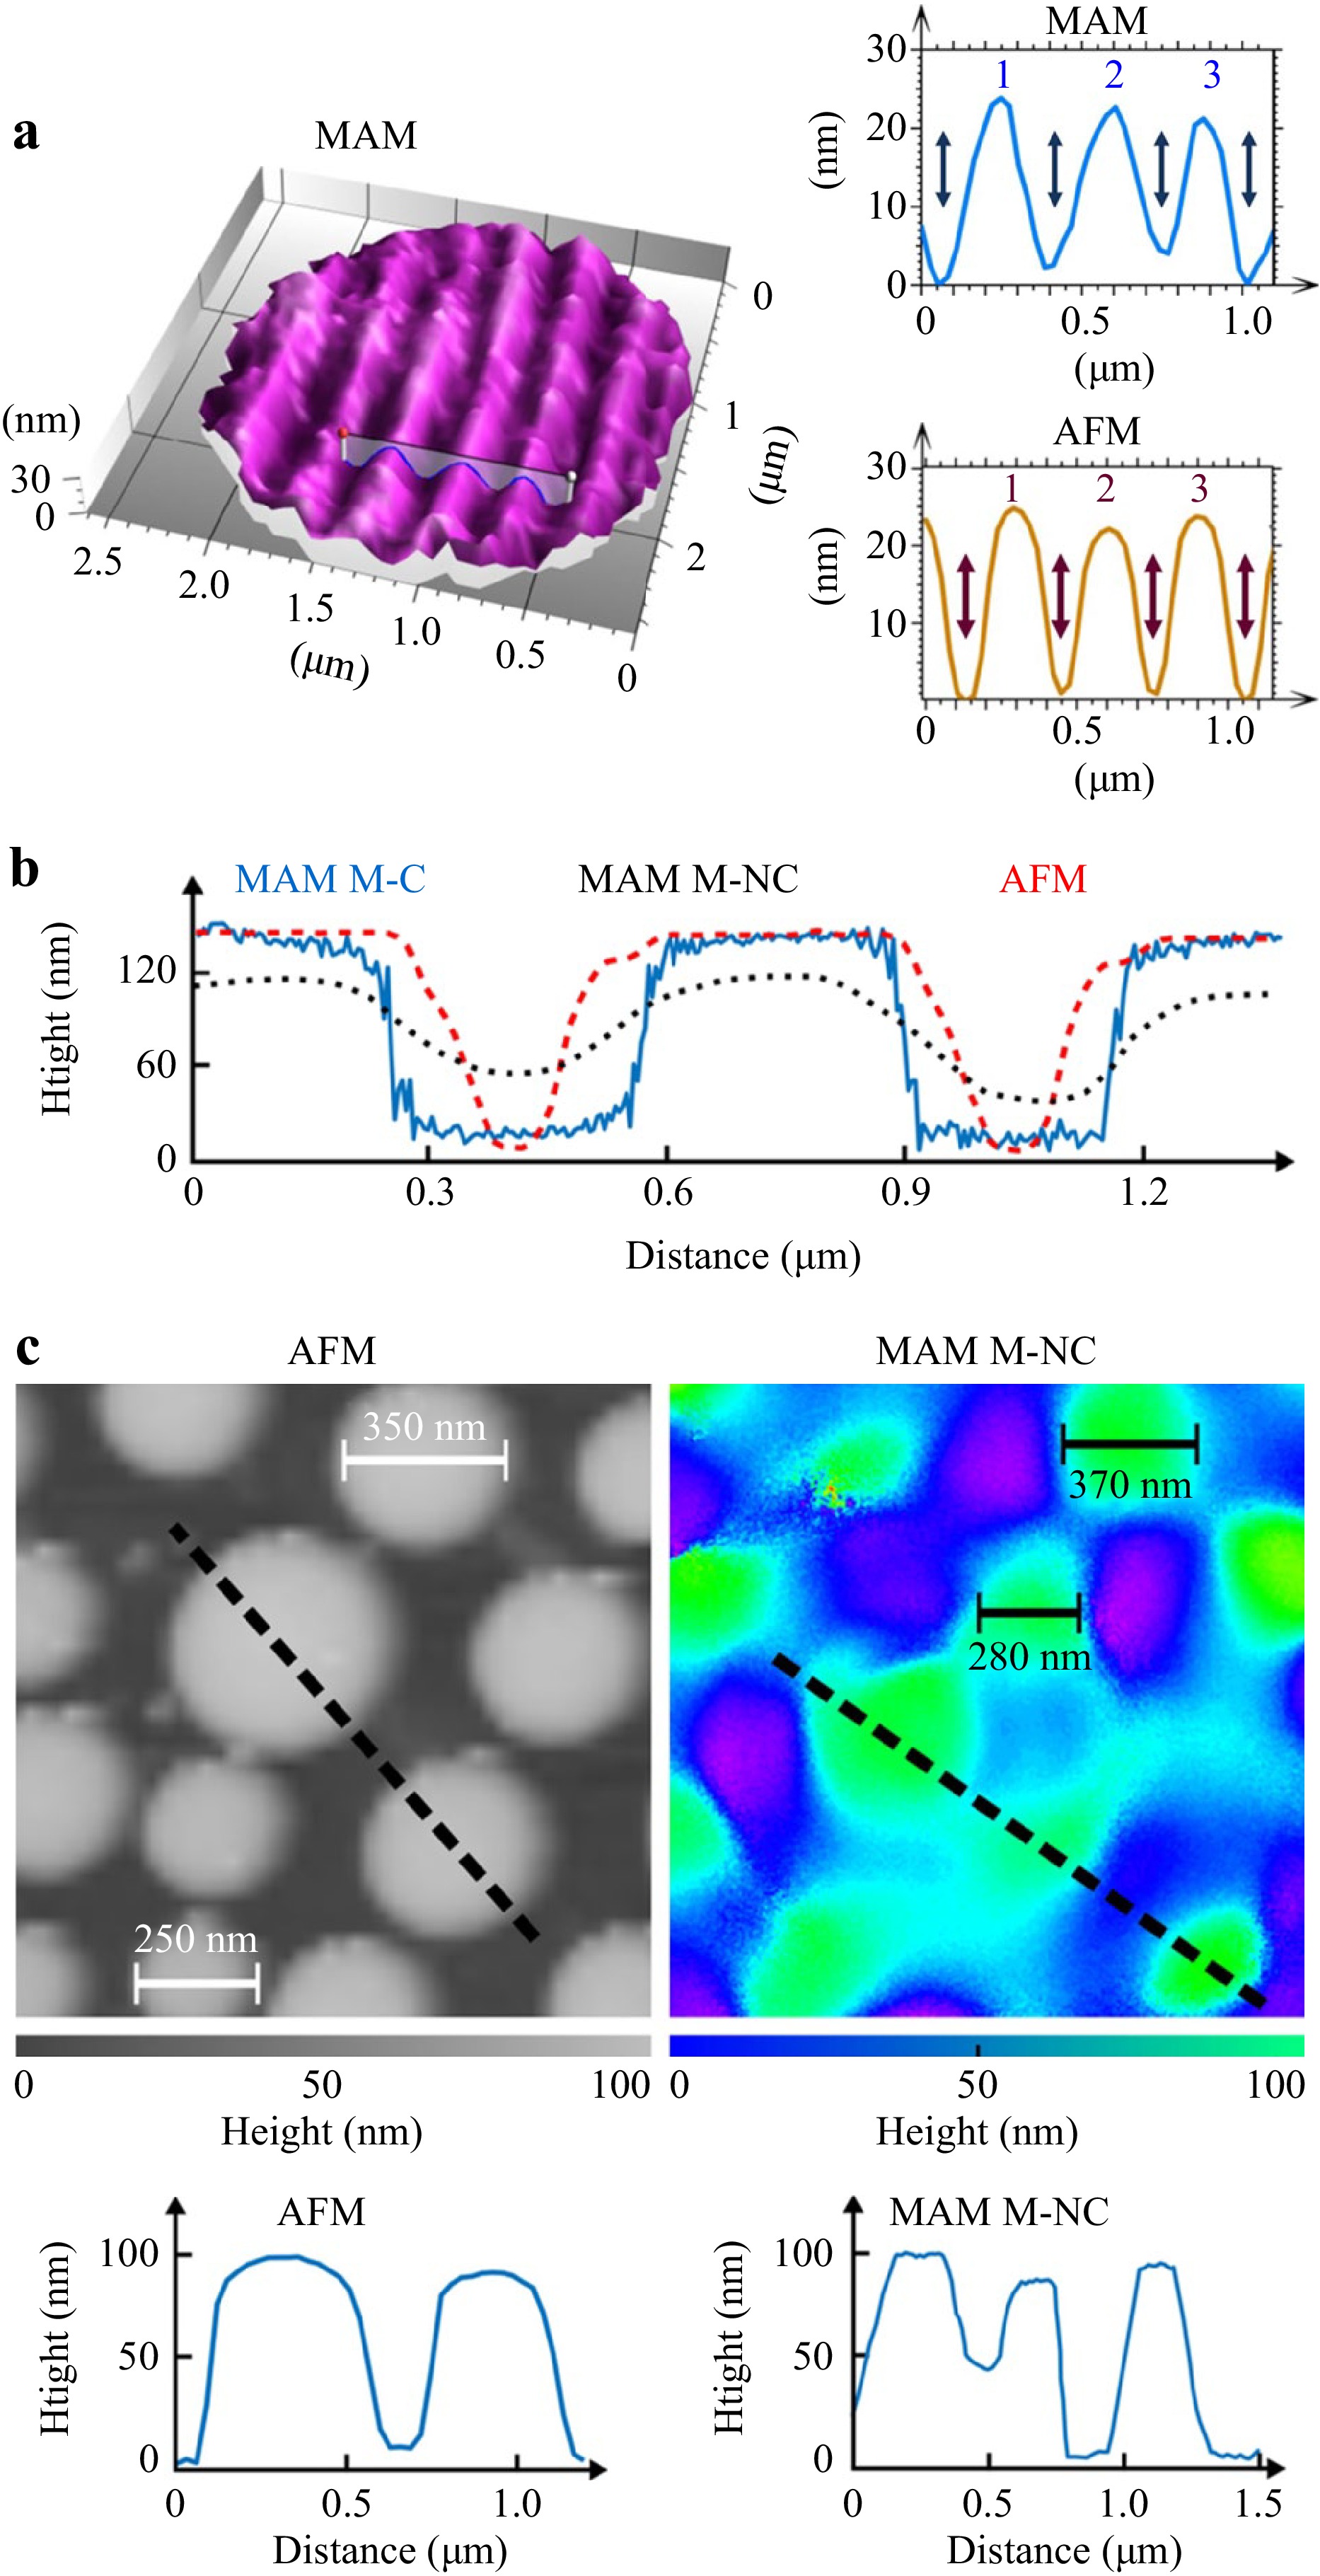
Fig. 3 Coherence scanning interference MAM experimental measurements. a 3D image of a Blu-ray Disc measured in Mirau configuration with an 11 μm melamine formaldehyde (n = 1.68) sphere, MAM and comparison with AFM42. Copyright 2017 Author(s), licensed under a Creative Commons Attribution license. b Section of a 600-nm-period and 140 nm depth 50%-duty-cycle grating standard from SiMETRICS measured in Linnik configuration with a 30 μm soda-lime (n = 1.52) sphere: MAM-C (solid blue curve) with and MAM-NC (dotted black curve) without a second microsphere in the reference arm to compensate the sphere response, and the AFM profile (dashed red curve) for comparison. c Disordered array of nanopillars measured in Linnik configuration with a 30 μm soda-lime sphere with a second microsphere in the reference arm to compensate the sphere response; and comparison with AFM. b, c Reprinted with permission from Ref. 45. Copyright American Physical Society.
Mostly white light sources such as halogen lamps or white-light LEDs are being used in microsphere-assisted CSIM since broadband light shows a sharp coherence envelope, thus enabling a robust fringe order determination. However, if the height differences of the sample are small such that the surface topography can be obtained solely from the phase of the interference signals or if the NA of the objective lens is large enough to induce a sharp envelope also color LEDs may be used. Color LEDs provide longer coherence lengths resulting in an axial extension of the coherence plane and in sufficient fringe contrast over a longer axial range. Further, dispersion effects are significantly reduced if color LEDs are used instead of white-light sources. In practice, the Mirau configuration is easier to use due to the common path between the two arms that makes the alignment of the two wavefronts simpler. However, as explained by Boudoukha et al.43 such a configuration is limited to the use of spheres having a diameter smaller than 15 μm. The insertion of a microsphere in the light path changes the positions between the image plane and the coherence plane along the optical axis. For spheres having a diameter smaller than 15 μm with white light illumination, the coherence length and the depth of field allow the image and the coherence planes to still overlap sufficiently for fringes to be acquired. Refocusing allows a compromise to be found between image clarity and fringe contrast for phase measurements to be made. However, this is no longer the case for larger microspheres, where the image position moves too far away from the coherence plane for interference to occur.
Such a limitation does not exist in using larger microspheres with a Linnik configuration, since not only the optimum image clarity can be found by refocusing, but the reference arm can also be easily adjusted to ensure the overlap of the two wavefronts41,44. The best configuration seems to be compensated microsphere-assisted interference microscopy where a similar microsphere is also added in the reference arm45. In this case, the phase response and the aberrations of the microsphere are compensated. 300-nm-width and nano-pilar have been reconstructed in the air using this technique (Fig. 3b, c). Marbach has also studied the possibility of achieving local spectroscopy with higher spatial resolution through microsphere using the data acquisition from phase shifting interferometry in a Linnik configuration46.
Hüser and Lehmann47 combined microsphere-assistance with a Linnik configuration using objective lenses of high NA (NA = 0.9) to resolve a grating profile with 230 nm period length. In the case of CSI systems of high NA, measured intensity signals consist of a broad spectrum of fringe frequencies due to the broad angular spectrum of contributing incident and captured light. Hence, the phase can be calculated depending on different so-called evaluation angular frequencies $ {q}_{z,\mathrm{e}\mathrm{v}\mathrm{a}\mathrm{l}} $ or similarly evaluation wavelengths $ {\lambda }_{\mathrm{e}\mathrm{v}\mathrm{a}\mathrm{l}}=4\pi /{q}_{z,\mathrm{e}\mathrm{v}\mathrm{a}\mathrm{l}} $. The evaluation wavelength, at which the phase of the wave field is analyzed, plays an important role for the lateral resolution and significantly influences the instrument response as explained by Lehmann et al.13. The dependency of the measured peak-to-valley height of a grating profile of 300 nm period length depending on the evaluation wavelength with and without microsphere-assistance is shown in Fig. 4. Obviously, the evaluation wavelength related to the maximum peak-to-valley height of the grating significantly shifts to smaller values using the microsphere. This effect can probably be explained by the magnification induced by the sphere leading to a larger measured period length, which requires a lower evaluation wavelength. For more explanation and a detailed view on the effects in the 3D spatial frequency domain, we refer to Hüser et al.15,40,48.
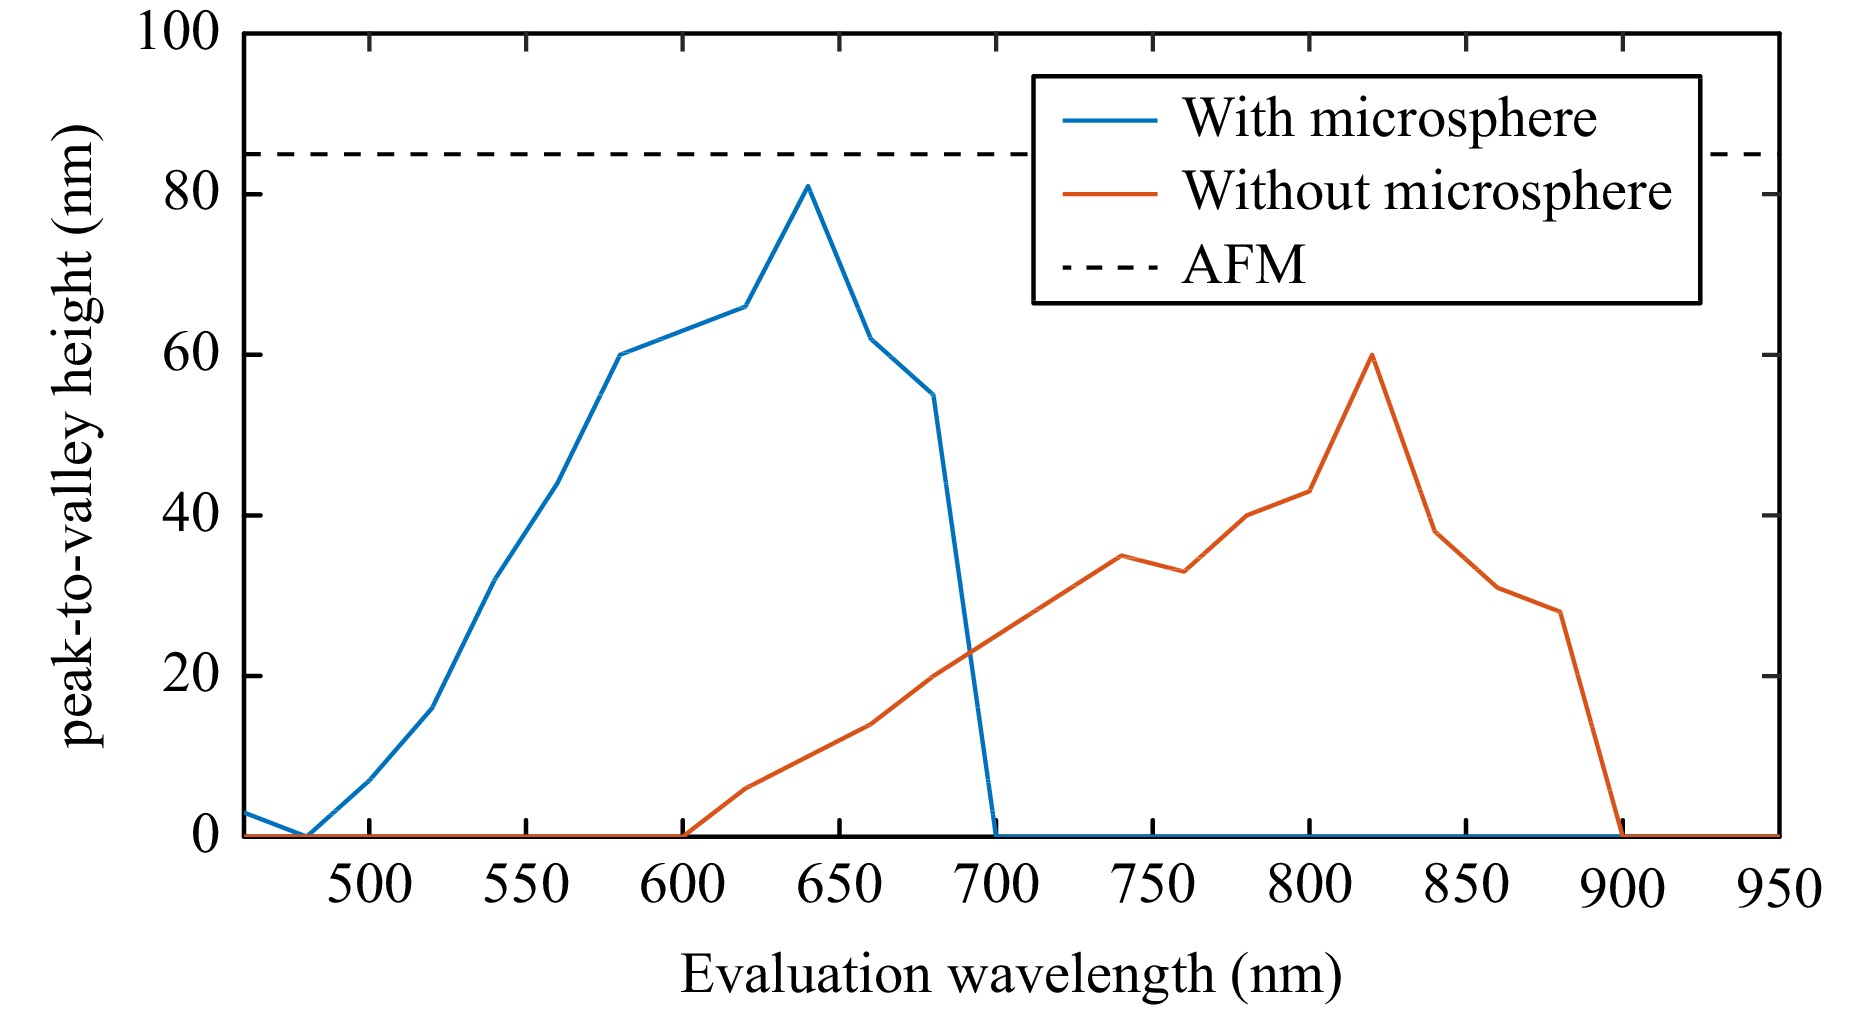
Fig. 4 Step height obtained from a rectangular grating profile of 300 nm period length and 85 nm step height measured with a conventional and a microsphere-assisted Linnik interferometer of NA = 0.9 depending on the evaluation wavelength $ {\lambda }_{\mathrm{e}\mathrm{v}\mathrm{a}\mathrm{l}}=4\pi /{q}_{z,\mathrm{e}\mathrm{v}\mathrm{a}\mathrm{l}} $ with fringe angular frequency $ {q}_{z,\mathrm{e}\mathrm{v}\mathrm{a}\mathrm{l}} $ used for phase analysis. The illuminating light source is a royalblue LED emitting at a central wavelength of 440 nm. Reprinted with permission form Ref. 47. Copyright Optical Society of America.
-
In general, theoretical and numerical studies can be split into two major approaches. The first one mainly focuses on the imaging properties of the microsphere or -cylinder without considering the transfer characteristics of the microscope setup in detail. In this context, classical ray tracing as well as rigorous methods are applied and, thus, conventional imaging based on refraction and non-linear effects are analyzed with respect to resolution enhancement. On the other hand, the full image formation process of an interference microscope considering conical illumination and detection, rigorous focusing and imaging of the microelement combined with the scattering from the measurement object, and depth scanning is simulated to reproduce measurement results and study parameter dependencies. Relating to both approaches, comprehensive insight into the physical mechanisms leading to resolution enhancement is achieved.
-
The ability of a dielectric microsphere or a microcylinder to scatter light in the far-field has been known for a long time49,50 and their ability to focus light beyond the diffraction limit in the near-field, in a beam known as a photonic jet or nanojet20,51,52, since 2004. However, their imaging properties have been theoretically studied more recently and the physical origin of the super-resolution in MAM is still not fully understood. Five main explanation of the super-resolution origin has been proposed: (1) the sub-diffraction size of the photonic jet considered as the PSF of the microsphere24,53,54. However, this cannot explain resolution smaller than $ \lambda $/3 in the air; (2) the ability of the microsphere to collect evanescent waves and to transmit them in the far field55-57; (3) the contribution of high spatial frequency of resonant whispering gallery modes (WGMs)58. This hypothesis is coherent with the previous one since the WGMs are excited by the evanescent waves coming from the sample. The resonance allows their contribution to be enhanced; (4) the possibility with a low coherent source to separate closely positioned image points by destructive interference42,59. Generally, imaging resolution is studied with incoherent light. However, with MAM, the low size of the microsphere and the high proximity of the object with respect to the coherence length of the source makes the interference between two close imaging points possible; (5) the high NA of the microsphere in combination with a spectral broadening due to the small FoV under the microsphere15. However, it is difficult to justify super-resolution with this last explanation.
For the theoretical study of microsphere imaging, the Snell-Descartes law has been used, taking into account evanescent waves55 but is probably too limited. Rigorous electromagnetic models are preferred with both, modal methods54,58,59 and 2D finite element methods42,47. In this context, comparison in the 3D spatial frequency domain can be useful for understanding15. The sample is generally described by several close point sources. A real image is simulated by direct propagation; however, in most cases, the microsphere generates a virtual image. This is due to the high proximity between the sample and the microsphere, as would be the case for a classical lens and object24. The simulation of a virtual image is not so direct. With modal methods, only the scattered field outside of the sphere must be considered. With the finite element method, the simulation of the virtual image is carried out in two steps. First, the outgoing wave from the microsphere is computed. Then a time reversal simulation in free space (without the microsphere) is applied to this outgoing wave42. Further, considering the light scattered from a grating profile and using a microcylinder, time reversal simulations show that the grating profile can be obtained from the phase of the field in the virtual image plane47.
-
The simulation model described in this section is based on the publication by Pahl et al.10. More details on the modeling are provided in previous publications related to coherence scanning interferometry (CSI)60,61 as a representative example of interference microscopy. An analog modeling of confocal microscopy is provided elsewhere62. It should be mentioned that all simulations published so far including the full measurement process of microsphere-assisted interference microscopy are based on microcylinders instead of microspheres due to computational burden.
Usually, simulation models of full microscopic imaging and measurement processes are split into three parts, the illumination, the light-surface interaction including the microelement in the case of microsphere-assisted CSIM, and the image formation in the microscope. Since the modeling of the illumination and the microscopic imaging remains similar compared to the modeling in conventional CSI60,61, we discuss the modeling of the light-surface interaction based on the finite element method (FEM) in the following. Generally, the light-surface interaction can be simulated by several rigorous methods, which all have advantages and disadvantages compared to each other. For a detailed insight in rigorous simulation techniques we refer to Jin63. A comparison of FEM to the commonly used rigorous coupled-wave analysis (RCWA) is provided by Bodermann et al.64. It should be noted that not all of the rigorous models are able to simulate WGMs accurately. As an example, due to the used staircase discretization problems appear if WGMs are simulated with the finite-difference time-domain (FDTD) method65-67. However, FEM enables accurate simulations of WGMs and is thus used for the following simulations.
Fig. 5a presents the FEM geometry used to calculate the electric field scattered by a grating profile of period length $ {l}_{x} $ with a microcylinder placed on it. The whole arrangement is considered to be periodic with period length $ {L}_{x} $ = 13.2 μm. In experimental investigations microspheres are quite often placed close to each other and, hence, periodicity does not seem to disturb the resolution enhancement. The far field is considered by calculating a Fourier series of the scattered light field closely above the cylinder.
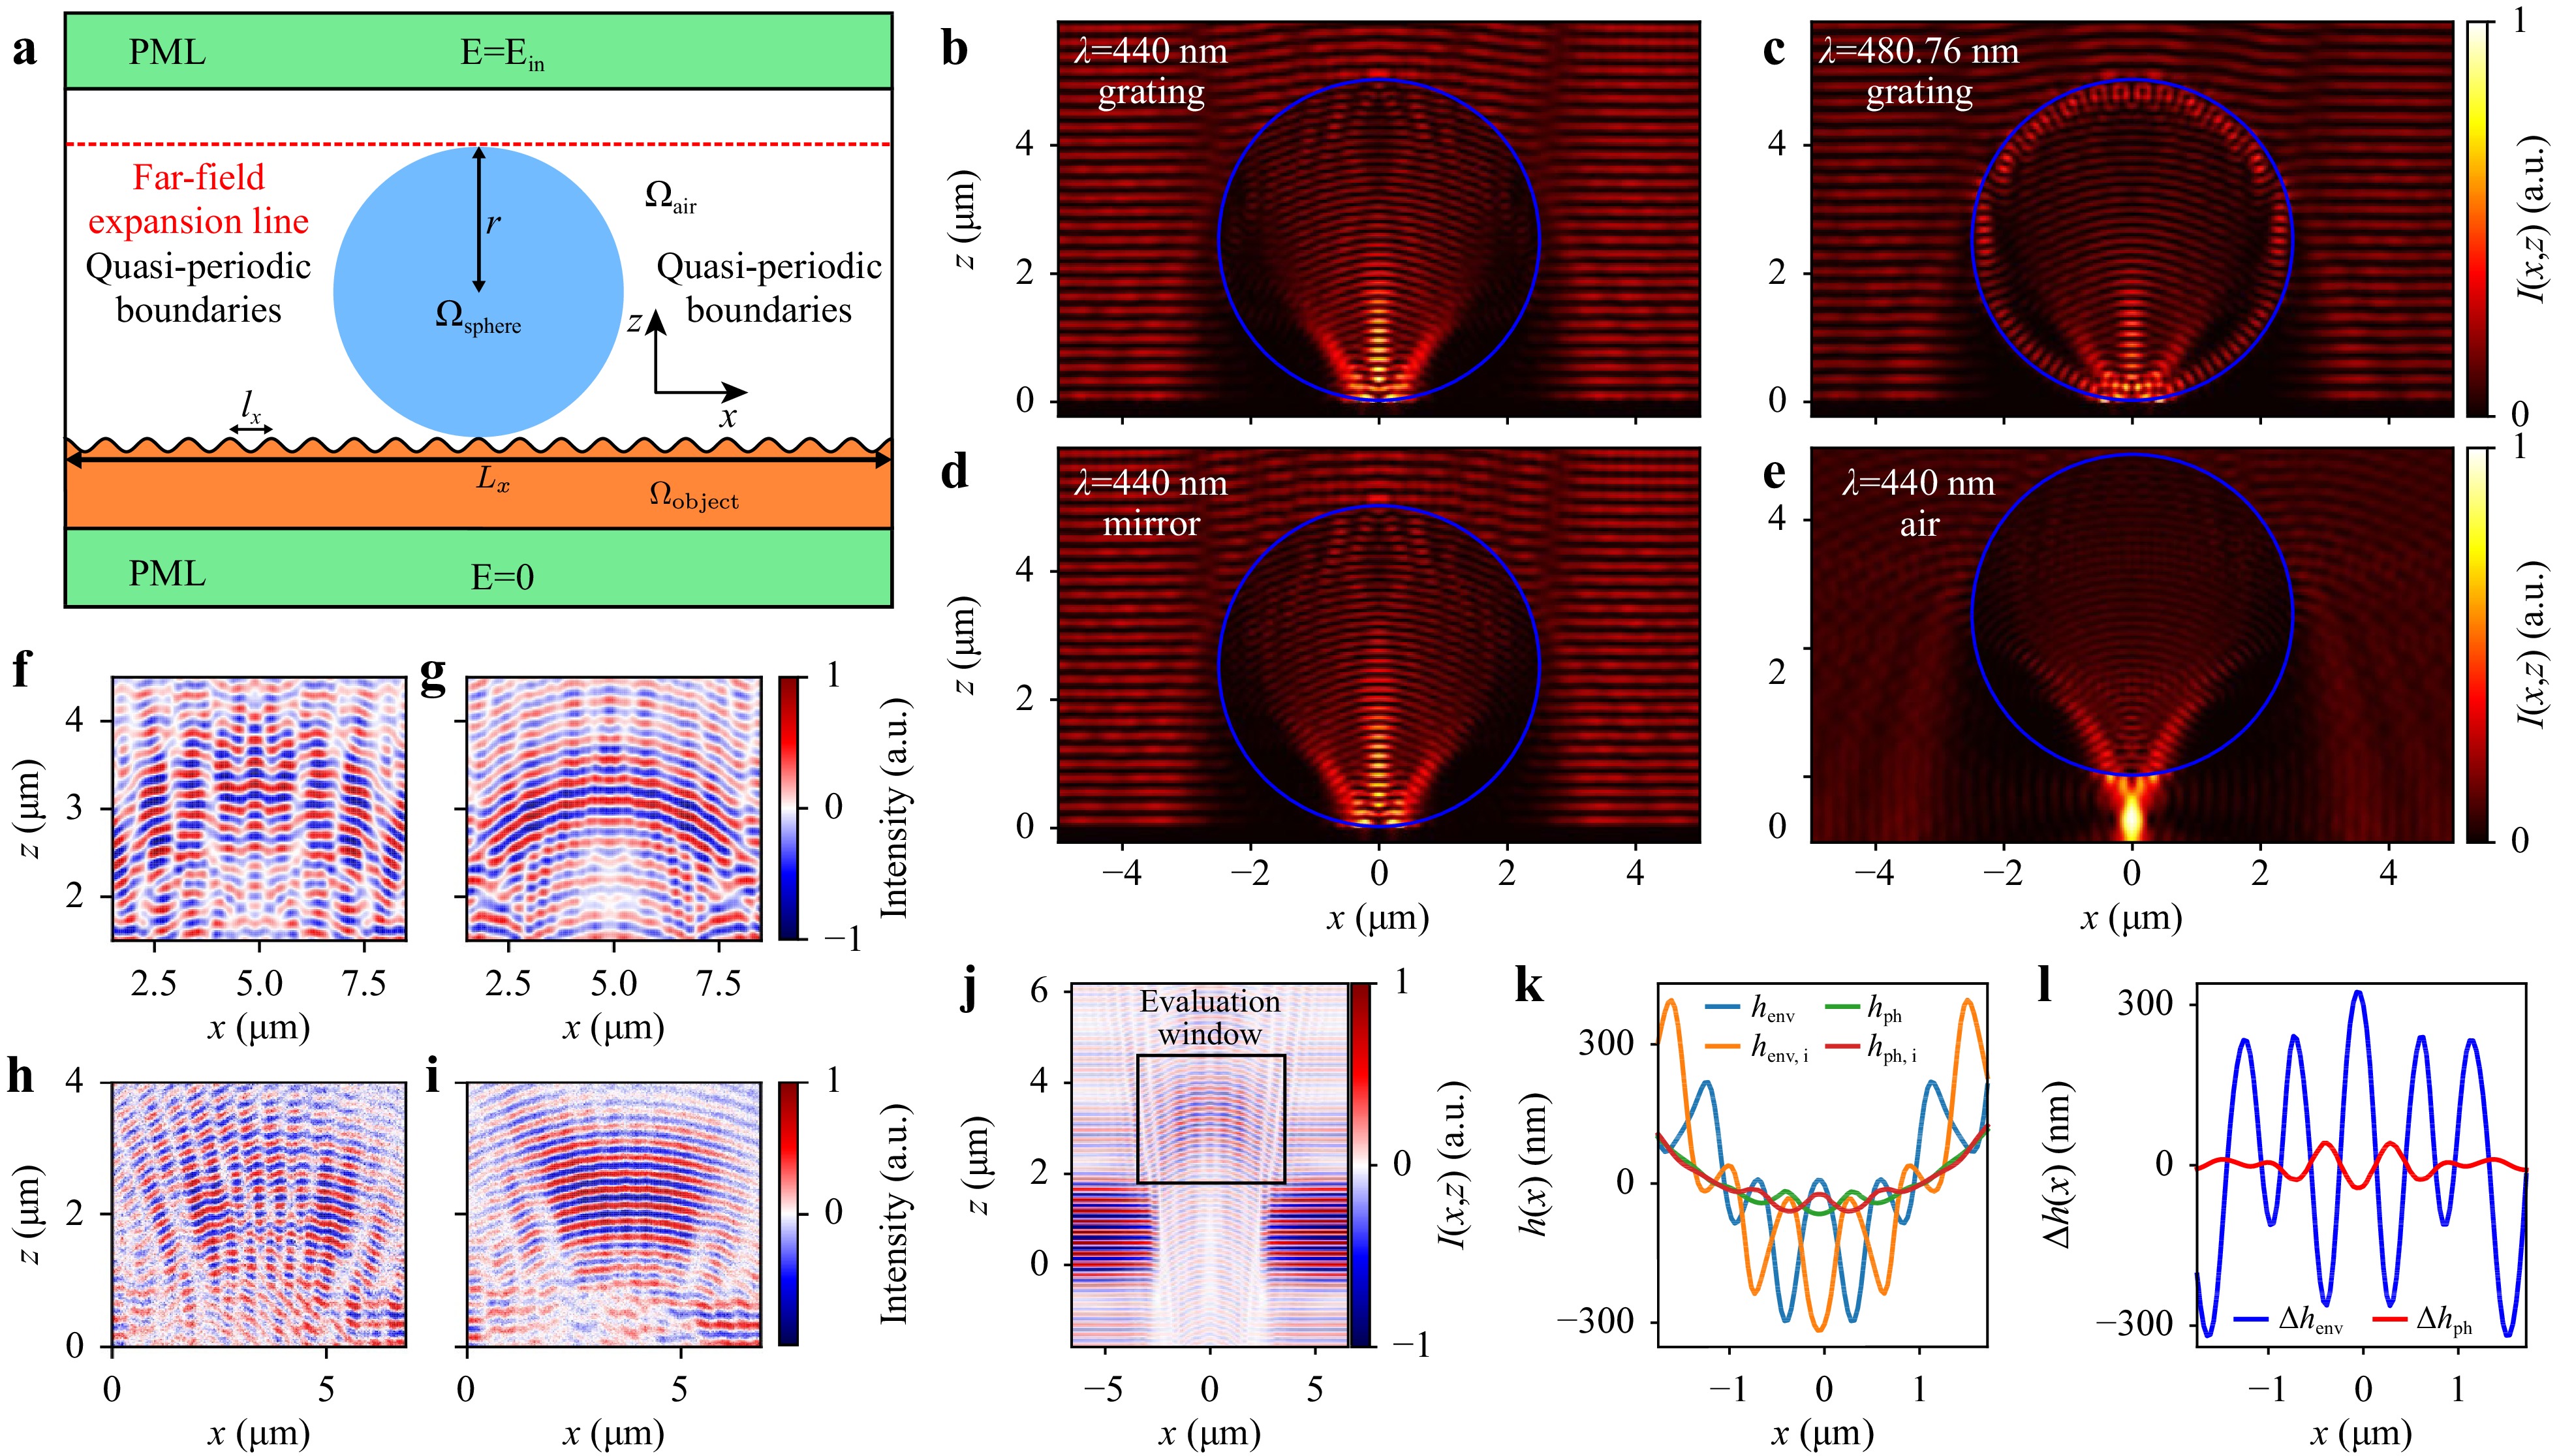
Fig. 5 a Schematic of the FEM geometry used to simulate the electromagnetic field scattered by a periodic object of period length $ {l}_{x} $ with microcylinder of radius r placed on. The top and bottom of the simulation domains are extended by perfectly matched layers (PMLs) to avoid reflections at the outer boundaries. The whole geometry is considered to be periodic with period length $ {L}_{x} $. The far-field is calculated using the field obtained at a single line in the xz-plane (marked by the red dotted line) placed closely above the cylinder by a Fourier series expansion10. b−e Intensities obtained from the total electric field solving the FEM problem sketched in a for a plane vertically incident, TM polarized wave of wavelength $ \lambda $ = 440 nm b,d,e and $ \lambda $ = 480.76 nm c. The microcylinder is marked by blue circles. The object is assumed to be a sinusoidal silicon grating of $ {l}_{x} $ = 300 nm and peak-to-valley amplitude $ h $ = 25 nm b,c, a plane dielectric surface referred to as mirror d and air e10. f−i Simulated f,g and measured h,i image stacks obtained from a Simetrics RS-N68 rectangular grating standard ($ {l}_{x} $ = 300 nm) imaged by a Linnik interferometer as sketched in Fig. 2 of NA = 0.9 with TM (f and h) and TE (g and i) polarized royalblue LED illumination. Simulated results are obtained for a microcylinder of 5 μm diameter, for the measurements microspheres of 5−9 μm are used48. j−l Methodology to quantify the resolution enhancement of microcylinder and microsphere-assisted interferometry simulatively. A simulated image stack of a sinusoidal grating of $ {l}_{x} $=300 nm, $ h $ = 25 nm obtained with $ \lambda $ = 440 nm and NA = 0.55 is shown in j. A window corresponding to the focal region of the microcylinder marked by the black rectangle is extracted and used for envelope (env) and phase (ph) analysis. k displays results occurring for the grating of j and additionally an inverted grating of the same dimensions. Differences between these two results are shown in l. The standard deviation (std) of the curves plotted in (l) is a measure for the resolution since std is expected to be zero if the grating is not resolved10. Copyright 2022 Author(s), licensed under a Creative Commons Attribution license.
Fig. 5b−e show simulated near-fields obtained from a microcylinder of radius r = 2.5 μm placed on a sinusoidal grating of $ {l}_{x} $ = 300 nm (Fig. 5b, c), a plane dielectric surface referred to as mirror (Fig. 5d) and a microcylinder solely surrounded by air (Fig. 5e). The vertically incident plane wave is TM polarized with wavelength $ \lambda $ of 440 nm (Fig. 5b, d, e) and 480.76 nm (Fig. 5c). As shown a WGM occurs only for $ \lambda $ = 480.78 nm and disappears for $ \lambda $ = 440 nm. Such near-field calculations are repeated for a discrete number of incidence angles cropped by the NA of the objective lens. It should be noted that not only rays within the xz-plane are considered but the complete conical illumination and detection in three dimensions. Following the procedure according to the references10,61, simulated interferograms are obtained, which correspond to the interference signals obtained in measurements during a depth scan.
In order to validate the simulation model, results shown in Fig. 5f, g are compared to measurement results (Fig. 5h, i) obtained using a Linnik interferometer of NA = 0.9 with royal blue LED illumination of central wavelength $ {\lambda }_{c} $ = 440 nm and spectral bandwidth of 20 nm defined by the full-width at half-maximum (FWHM)48. The incident light is either TM (Fig. 5f, h) or TE (Fig. 5g, i) polarized. The measurement results are obtained using microspheres of diameter between 5 μm and 9 μm, whereas simulations are performed for a microcylinder of 5 μm diameter. The measurement object is a rectangular grating of $ {l}_{x} $ = 300 nm and total height $ h $ = 140, nm according to the Simetrics RS-N standard68 in both, measurement and simulation.
The results qualitatively agree and the grating structure can be obtained from the phase of the interference signals in both, simulation and measurement. Furthermore, in simulation as well as in measurement, the focal plane in the area, where the sphere or cylinder is located, is axially shifted as expected. In the case of TM polarization, the modulation following from the grating profile is much stronger compared to TE polarization. This observation agrees with experimental results of MAM obtained by Darafsheh et al.27, where a higher contrast is obtained for TM polarization. Further comparisons especially with respect to the transfer behavior in the 3D spatial frequency domain are documented by Hüser et al.15.
However, all results lack quantitative comparability since measurement results are obtained using microspheres whereas simulations consider microcylinders. Generally, both are shown to enhance the resolution, but the imaging characteristics are different for spheres and cylinders. Further, different effects with respect to polarization appear when using microspheres and microcylinders. Therefore, in future studies measurements using microcylinders69 or simulations using microspheres need to be performed for quantitative comparisons. Nonetheless, rigorous near-field calculations need to be repeated for multiple angles of incidence within a cone in order to achieve reliable results. Using conventional workstations, rigorous FEM simulations for microspheres are not yet possible due to memory restrictions and extremely long run times but could be enabled using high performance clusters.
In order to quantify the resolution obtained using microsphere-assisted CSIM simulated image stacks obtained from a microcylinder placed on sinusoidal phase gratings of different period lengths are analyzed. As an example, a cross-section of a simulated image stack for $ \lambda $ = 440 nm, $ {l}_{x} $ = 300 nm with NA = 0.55 is displayed in Fig. 5j. Note that the intensity is offset-reduced and hence negative intensity values occur. The intensity in an area around the focal plane of the microcylinder marked by the black rectangle in the figure is extracted and the corresponding signals are analyzed using envelope and phase evaluation39. The resulting envelope and phase profiles are shown in Fig. 5k. Although $ {l}_{x} $ = 300 nm is well below the Abbe resolution limit of 400 nm, the grating period is clearly visible in both profiles. Thus, the microcylinder obviously enhances the lateral resolution and this effect can be demonstrated by the use of the simulation model. Analogously, an image stack is simulated for an inverted grating of the same dimensions, which means that the grating is laterally shifted by 180°. The resulting profiles for the inverted grating are shown in Fig. 5k, too. Both, the envelope as well as the phase profile of the inverted grating show the original grating structure. Further, it should be noted that the envelope and the phase profiles are inverted compared to each other. This effect appears in conventional interference microscopes if profiles with features close to the lateral resolution limit are measured12. It should be mentioned that the sign of the phase profile is correct, whereas the reconstructed envelope profile is inverted.
Fig. 5l presents the difference $ \Delta h\left(x\right) $ between the envelope and phase height profiles $ h\left(x\right) $ obtained from the grating and its inverse, respectively. If the grating profile would not be resolved by the microsphere-assisted CSIM, no differences between the two gratings are expected leading to $ \Delta h\left(x\right) $ = 0. Hence, the standard deviation (std) of $ \Delta h $ can be used as a measure of the resolution capability. Only if $ \Delta h\ne 0 $, the grating will be resolved. Therefore, std($ \Delta h $) depending on the period length $ {l}_{x} $ of the grating is analyzed in order to investigate the resolution enhancement. The value of $ {l}_{x} $, for which std($ \Delta h $) becomes zero, can be used as a criterion for the resolution in this context. With this approach, the following major results are obtained10:
• The resolution enhancement seems to be independent of the occurrence of a WGM. Comparing results obtained with and without WGM (see Fig. 5b, c), the achieved resolution enhancement is not affected by the WGM.
• The resolution enhancement is independent of the NA of the objective lens of the microscope. Hence, it seems to be useful to use setups of smaller NA and larger FoV since the achieved resolution is solely due to the microcylinder.
• The most likely effect for the resolution enhancement is a local enhancement of the effective NA.
These results are in good agreement with the conclusions drawn based on experimental MAM results shown by Duocastella et al.70. Nonetheless, note that these results are obtained by a case study. In a recent publication71 the presented model is extended to MAM and an improved resolution appears for amplitude objects in transmission mode. Hence, the physical arrangement seems to play an important role for the resolution enhancement and the underlying physical effects.
In general, a few major open questions and tasks to do remain:
• Comparison of simulated and measurement results for microcylinders.
• Implementing a simulation model for microsphere-assisted interference microscopy on high-performance clusters and comparing the results with measurement results. Therewith, differences in the resolution enhancement for microspheres, microcylinders and other microelements can be investigated.
• Since the resolution enhancement is shown to be independent of the NA of the objective lens, a microsphere-assisted CSIM system based on the Michelson configuration might be useful. Such a system would be of low-cost, have a larger FoV, and be much easier to handle compared to a Linnik setup.
• The presented model can be used for parameter studies, where the resolution enhancement depending on the material properties of the cylinder as well as the surrounding medium is investigated. Furthermore, analyses of the optimum size of the cylinder or tests with differently shaped microelements are of interest. In addition, other measurement objects different from rectangular phase gratings such as gratings also modulating the amplitude of the electric field can be studied.
-
DHM has emerged as a powerful single-shot QPM approach with numerous applications in life and material sciences72-74. It is a non-invasive tool that enables high-contrast 3D imaging of phase objects either in reflection or transmission mode and also serves as a non-abrasive technique for measuring surface profiles75-79. The numerical reconstruction of holograms recorded by a digital sensor provides whole-field information about the object at any desired plane. Off-axis geometry is popular due to the introduction of a slight angle between the object and reference beam, which separates the undiffracted reference beam from the virtual and the real image of the object at the reconstruction plane, resulting in high-quality quantitative imaging. However, such arrangements including two independent beams that travel along separate paths result in uncorrelated phase variations. Additionally, this technique requires many optical components, which can make the setup complicated and costly. Yet, off-axis common-path and self-referencing geometries offer elegant solutions to overcome the drawbacks80-82. In common-path systems, two separate beams propagate along the same path, while in self-referencing setups, a portion of the object beam serves as the reference beam. Irrespective of how the DHM setup is arranged, achieving high lateral resolution remains a key concern in this field. In addition to diffraction, the lateral resolution can be influenced by the detector’s features such as pixel size, signal-to-noise ratio, and dynamic range, as well as the windowing function in reconstruction for off-axis DHM19,81. Improvement in resolution can be practically achieved by utilizing either shorter wavelengths or by enhancing the effective NA. Although the former has been suggested in some studies83,84, its application can pose risks to bio-samples85. On the other hand, manipulating the system’s degrees of freedom, including the object’s shape, temporal behavior, dimensions, wavelength, and polarization, can synthetically increase the NA of the detection system86,87.
MAM offers significant advantages over other resolution enhancement techniques for DHM. In addition to being surprisingly simple, low-cost, and easy to implement, MAM achieves resolution enhancement simultaneously in all spatial directions through a single hologram, which is essential for real-time imaging of live specimens with rapid dynamics19,88. MAM also benefits from DHM’s advantageous features. Adding a spherical lens to a conventional microscope can introduce non-negligible spherical aberrations and curved deformation in the measured phase in interference microscopy, leading to a further sacrifice in the effective FoV44. Yet, any contamination, image distortion, and aberrations can be suppressed in DHM simply by taking a reference hologram, which is recorded in the absence of the object81,89,90. The final phase map of the target sample is obtained through subtraction of the numerically reconstructed object hologram’s phase information from the obtained phase of the reference hologram76,81,91. In the numerical reconstruction process, the reference wavefront is simulated and numerically propagated along free space, providing amplitude and the phase information of the sample as a complex wave field throughout the axial distance using a computer algorithm91,92. This enables the formation of an image at any desired plane by adjusting the reconstruction distance. The numerical refocusing capability also may allow for the synthetic expansion of the image depth of field. Hence, the precise positioning of the microsphere and maintaining a consistent microsphere-to-sample distance, which are challenging issues during imaging in MAM, become less pronounced in microsphere-assisted DHM.
-
The Mirau interferometric objective can be considered for an off-axis common-path DHM, by tilting the sample stage at just a small angle. Nevertheless, it has not received much attention for digital holography due to the significant difference between lateral and axial resolution. Additionally, high-magnification Mirau objectives are costly and have limited working distances, yet the low-magnification Mirau objectives commonly used lack high lateral resolutions. Recently, promising experimental results have been reported from integrating MAM with Mirau-DHM78,93. In this approach, a silica microsphere placed within the working distance of a low-magnification Mirau objective offers a vibration-immune and compact apparatus to perform QPM with a high resolving power.
A scheme of the optical setup used for microsphere-assisted Mirau-DHM is shown in Fig. 6a. A He-Ne laser at 632.8 nm wavelength and 2 mW power was used as the light source. However, to reduce the speckle noise resulting from the laser’s high spatial coherence, it was directed into the system after passing through a rotating diffuser positioned at the back focal plane of a lens with a focal length of 100 mm. The beam was then guided by a cube beam-splitter into a 10× Mirau objective (NA = 0.3). As shown in the inset of Fig. 6a, the entering beam was divided into two parts by a plate beam splitter that was built-in at the front aperture of the objective. One-half of the intensity is reflected back onto a small mirror integrated inside the objective, serving as the reference beam for forming a digital hologram of the sample. The other half is transmitted through the beam splitter and focused onto the sample after passing through the microsphere. Upon reflection, the diffracted wave containing high spatial frequencies of the object is collected by the microsphere. The interfering beams propagate along a common path and create interference patterns at the sensor plane using a tube lens with a focal length of 160 mm. A digital camera was employed to record the patterns as digital holograms. Subsequently, the recorded hologram underwent numerical reconstruction to generate 3D images based on the complex amplitude of the sample.
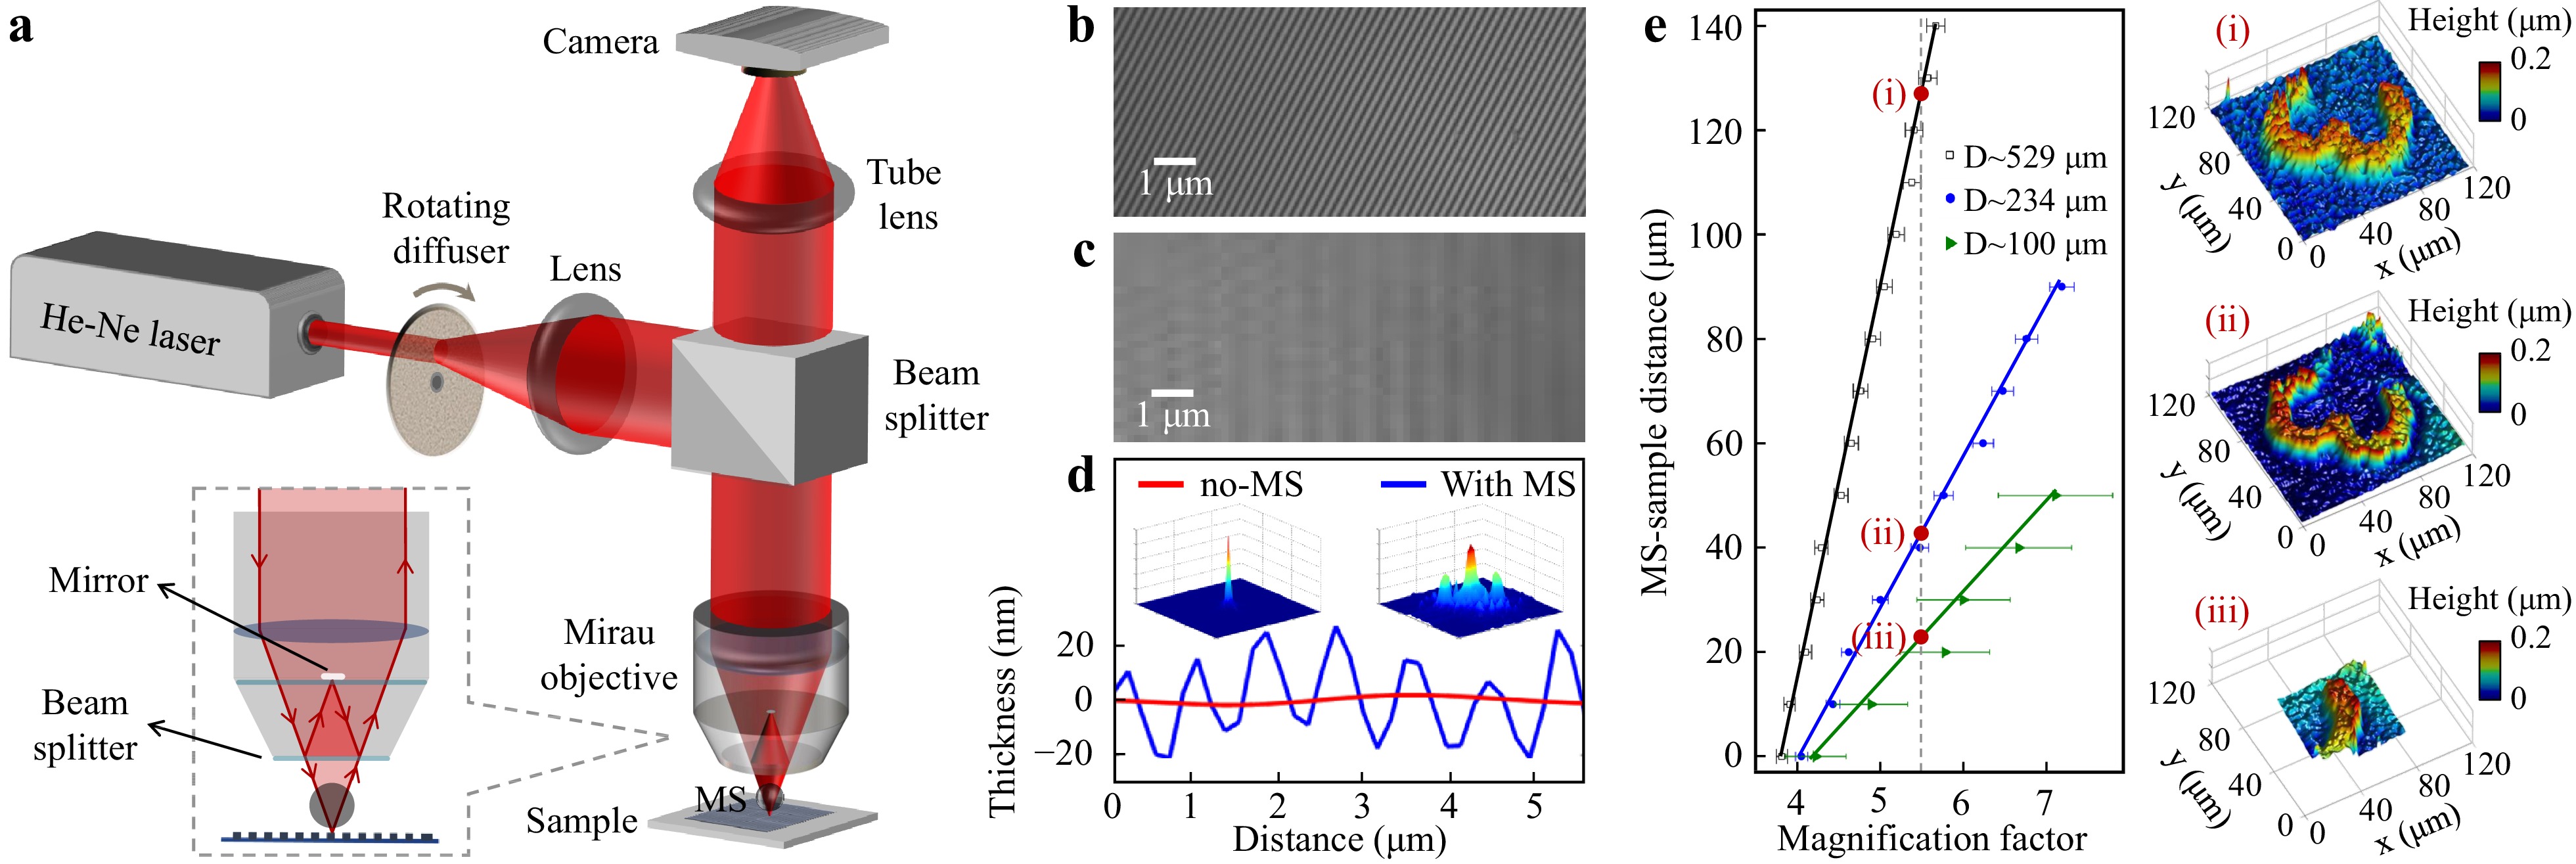
Fig. 6 a Schematic setup for microsphere-assisted Mirau-DHM, in which a slight tilt (few degrees) is applied to the sample stage to achieve an off-axis digital holography configuration. b−d Experimental results of a DVD sample: Recorded digital holograms of the structure by the setup b without, and c with the assistance of a D~234 μm diameter silica microsphere in the setup. d Corresponding averaged cross-sectional profiles along with Fourier spectra obtained from the reconstruction images. e Magnification factor and FoV dependence on the size and distance from the sample for three different microspheres through experimental adjustment by a resolution target sample. Adapted with addition from Ref. 93. Copyright 2017 Optical Society of America.
The authors investigated various adjustment parameters by applying the setup to a resolution target and a standard grating. The results are summarized in Fig. 6b−e. The recorded holograms of a grating structure on a digital versatile disk (DVD) grating by the DHM setup with and without the assistance of a D~234 μm diameter silica microsphere are shown in Fig. 6b, c, respectively. The corresponding averaged height distribution along the lines crossing the grating structure and Fourier spectra of the reconstructed height maps for the two cases are compared in Fig. 6d. The appearance of the first diffraction orders in the Fourier spectrum and the horizontal periodic structure in the hologram for the microsphere-assisted case are related to the DVD grooves, proving the concept by revealing the structure that is beyond the diffraction limit of the initial system.
In the presented setup, the microsphere was glued to the end of a narrow rod (an optical fiber as a lever) that was inserted into a micropipette tip (as a holder). An x-y-z micropositioner was then attached to the micropipette tip to precisely control the movement and positioning of the MS. The possibility to vary the microsphere’s size and position provides a large range of resolution, magnification factor, and FoV, allowing one to opt for a desired imaging property. Experimental results showing changes in the final magnification factor and FoV as influenced by the diameter and position of the microsphere have been reproduced in Fig. 6e. Three different sizes of microspheres were investigated, along with various vertical positions of the MSs. Smaller microspheres were found to cause a limited FoV, but the magnification improvement factor was more sensitive to the vertical position of the microsphere. The red dots (i), (ii), and (iii) indicated on the vertical dashed line suggest that a specific enhanced magnification factor can be achieved by each size of the microspheres. However, as the associated reconstructed 3D maps of an element of the target sample show, the results may differ in terms of the effective FoV and the image quality. The magnification factors were calculated by averaging the values along several cross-sectional lines, for such reconstructed images. The greater the FoV limitation, the smaller the number of pixels that can be counted along the considered lines, leading to higher error bars in the averaged values.
-
The combination of MAM and DHM in transmission mode offers a low-cost bench-top apparatus for high-resolution 3D imaging of phase objects, which covers a large class of biosamples88,94-97. Abbasian et al.97 demonstrated microsphere-assisted self-referencing DHM in transmission mode based on lateral shearing interferometry using a glass plate, which comes along with higher temporal phase stability81,98,99. The scheme of the presented arrangement is shown in Fig. 7. The same laser, camera, and approach used for the mentioned Mirau-DHM setup were applied to illuminate the sample, record the hologram, and hold the MS, respectively. They found out that when the object plane is placed below ($ {p}_{-} $) or beyond ($ {p}_{+} $) the focal length of the microsphere, a magnified virtual or real image is formed, respectively. Either of these images can be placed at the sample plane of the objective ($ z $ = 0) and captured by the system. Ray tracing of the image formation protocol, showing the potential of the setup to be operated in either virtual image (gray color) mode or real image mode (red color) is provided in the inset of Fig. 7a. The resolution enhancement is almost the same for the two cases because the extended acceptance cone by introducing the microsphere (from $ {\theta }_{0} $ to $ {\theta }_{1} $) would be almost the same for both geometries. In contrast, the real-image operating mode offers the advantage of additional space as the sample is positioned beyond the working distance of the MO, providing flexibility for further adjustments to the imaging properties. As shown in the schematic, the sample was placed just beyond the focal length of the MS. The diffracted object beam was collected by the microsphere and a magnified real image was formed on the other side at the sample plane of a conventional objective lens (NA = 0.3, 10×) to be considered as the imaging target of the system. The spherical wavefront was then laterally sheared by a 1-cm-thick fused silica glass plate. After being reflected from the two sides of the plate, the two wavefronts interfere and build an interference pattern at the camera using a tube lens.
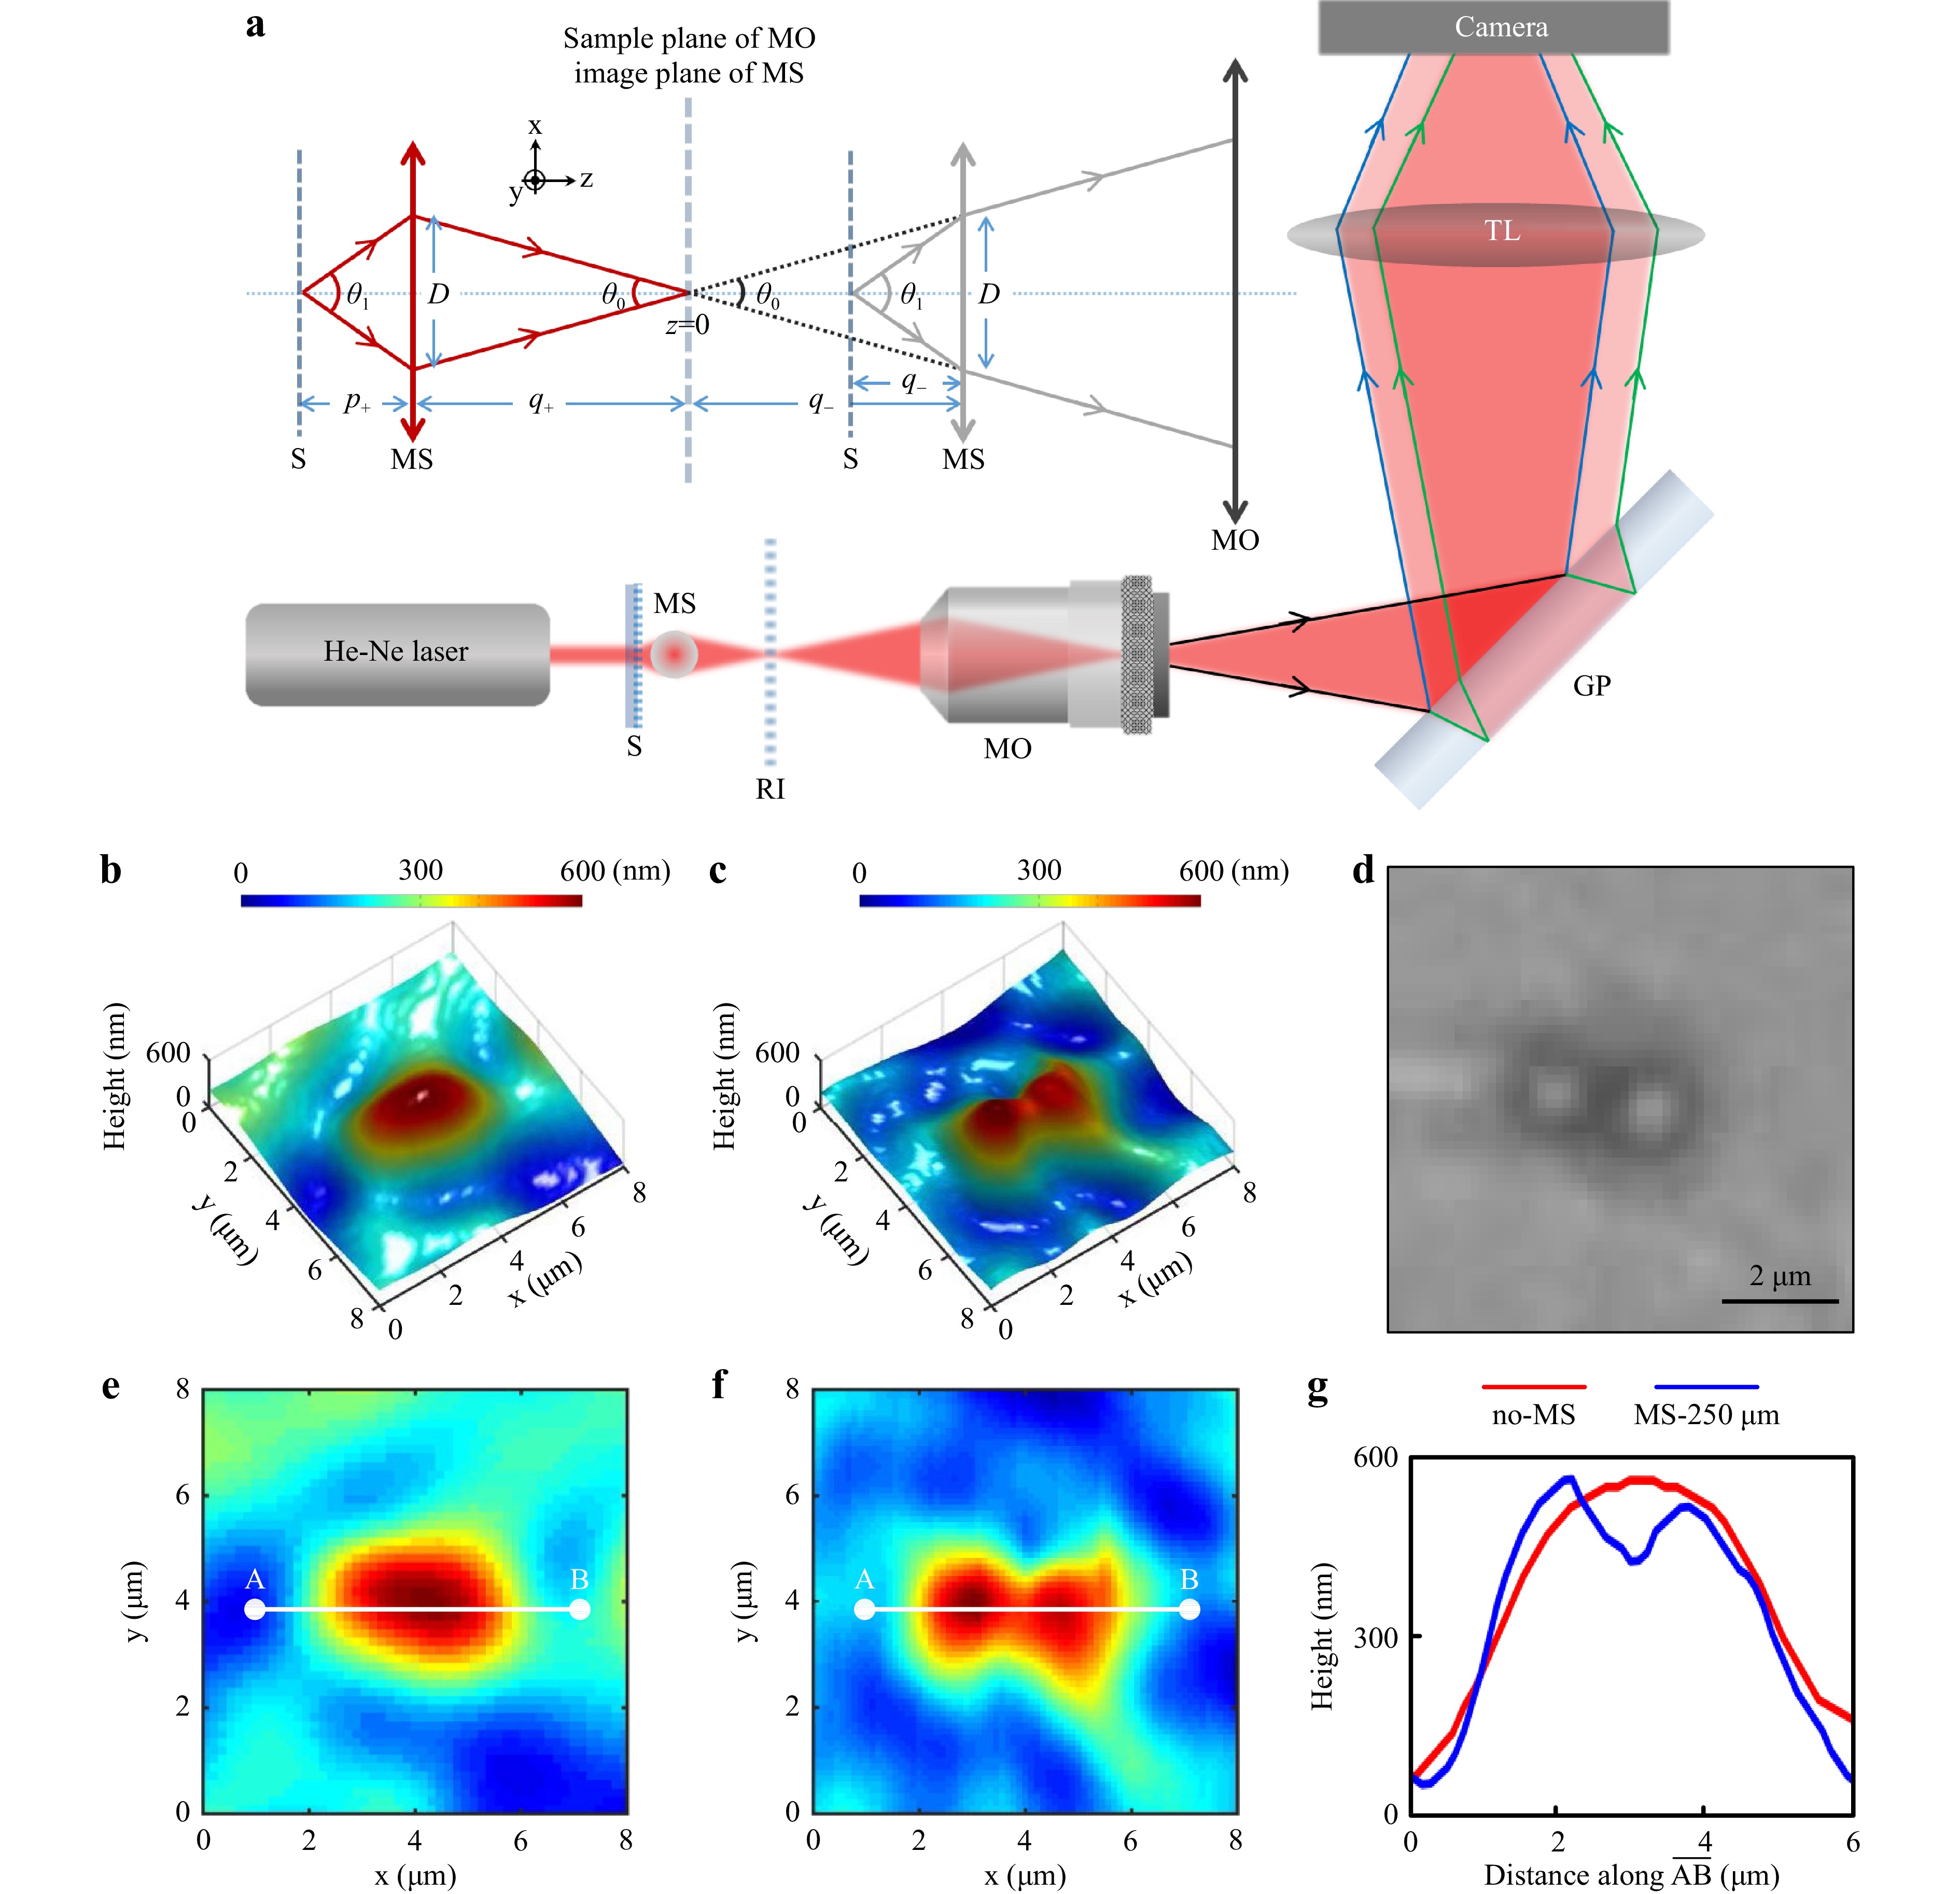
Fig. 7 a Schematic setup of the microsphere-assisted self-referencing DHM in transmission mode; S: sample; RI: real image; MO: microscope objective; GP: glass plate; TL: tube lens. b−g Experimental results of distinguishing two adjacent transparent micro-particles. b and c the reconstructed 3D images, and e and f the corresponding 2D maps of the particles with and without the insertion of a microsphere with a diameter of 250 μm in the DHM setup, respectively. d Bright-field microscopy image captured using a 60× objective. g Comparison of cross-sectional profiles along the lines $ \overline{\rm{AB}} $ depicted in panels e and f. Reprinted with permission from Ref. 97. Copyright 2019 IOP Publishing Group.
The proof-of-concept experiments were conducted to resolve a standard grating with a structure beyond the diffraction limit of the used objective lens. They also tested the setup for the aggregation of micro-particles as a non-periodic phase specimen. Figs. 7b−g show the experimental results of two adjacent polystyrene micro-particles ($ D $ = 1.65 μm). In Fig. 7b, e, the reconstructed 3D image and corresponding 2D map of the particles are shown without employing a microsphere in the setup, respectively. Similarly, in Fig. 7c, f, the reconstructed 3D image and corresponding 2D map of them are shown with the insertion of a diameter of 250 μm microsphere in the setup. Fig. 7d shows a bright-field microscopy image of the particles taken with a 60× objective. The cross-sectional profiles along the depicted $ \overline{\rm{AB}} $ lines on the 2D maps are provided in Fig. 7g. Figures highlight the capability of the microsphere-assisted DHM setup in distinguishing particles that were previously indistinguishable without the microsphere.
-
In an application reported for microsphere-assisted DHM, the microsphere-assisted Mirau-DHM represented in Fig. 6a has been introduced for cell identification and biomedical measurements93,100. To be a case in point, it was successfully applied to identify thalassemia red blood cells (RBCs) from healthy RBCs. Blood samples were obtained from a healthy individual and a subject diagnosed with thalassemia minor. Thalassemia encompasses various forms, including thalassemia major and thalassemia minor. Thalassemia minor occurs when an individual inherits a faulty gene from only one parent. In medical laboratories, anemia can be detected through a complete blood count (CBC) test, while abnormal hemoglobin forms can be identified via a hemoglobin electrophoresis test. Thalassemia RBCs appear small and abnormal under a microscope. Yet, QPM is expected to achieve a precise identification of thalassemia RBCs in relation to normal ones as it is able to measure the volumetric characteristics of individual cells. The recorded holograms of normal RBCs without and with using a D~234 μm diameter microsphere in the arrangement are shown in Fig. 8a, b, respectively. Fig. 8c, d show the corresponding reconstructed 3D distribution profiles. The volume distribution and histogram of 140 RBCs from both normal and thalassemia cells are provided in Fig. 8e, f, respectively. Blue, red, and black dashed lines are the average volume of the normal, thalassemia, and all 140 cells, respectively. Even for these few numbers, the figures show a clear distinction between the two groups of cells, highlighting the superiority of the presented setup over common methods for medical diagnoses. While the changes in cell volume proved effective in distinguishing abnormal cells in the case of thalassemia, the collected holograms through the approach contain additional valuable information. Depending on the experimental conditions, each of the parameters, such as the roughness of the cell membranes, thickness distribution behavior, cell circularity, volumetric aspect ratio, and cell convexity has the potential to serve as criteria for cell identification or classification76,82,93,100,101.
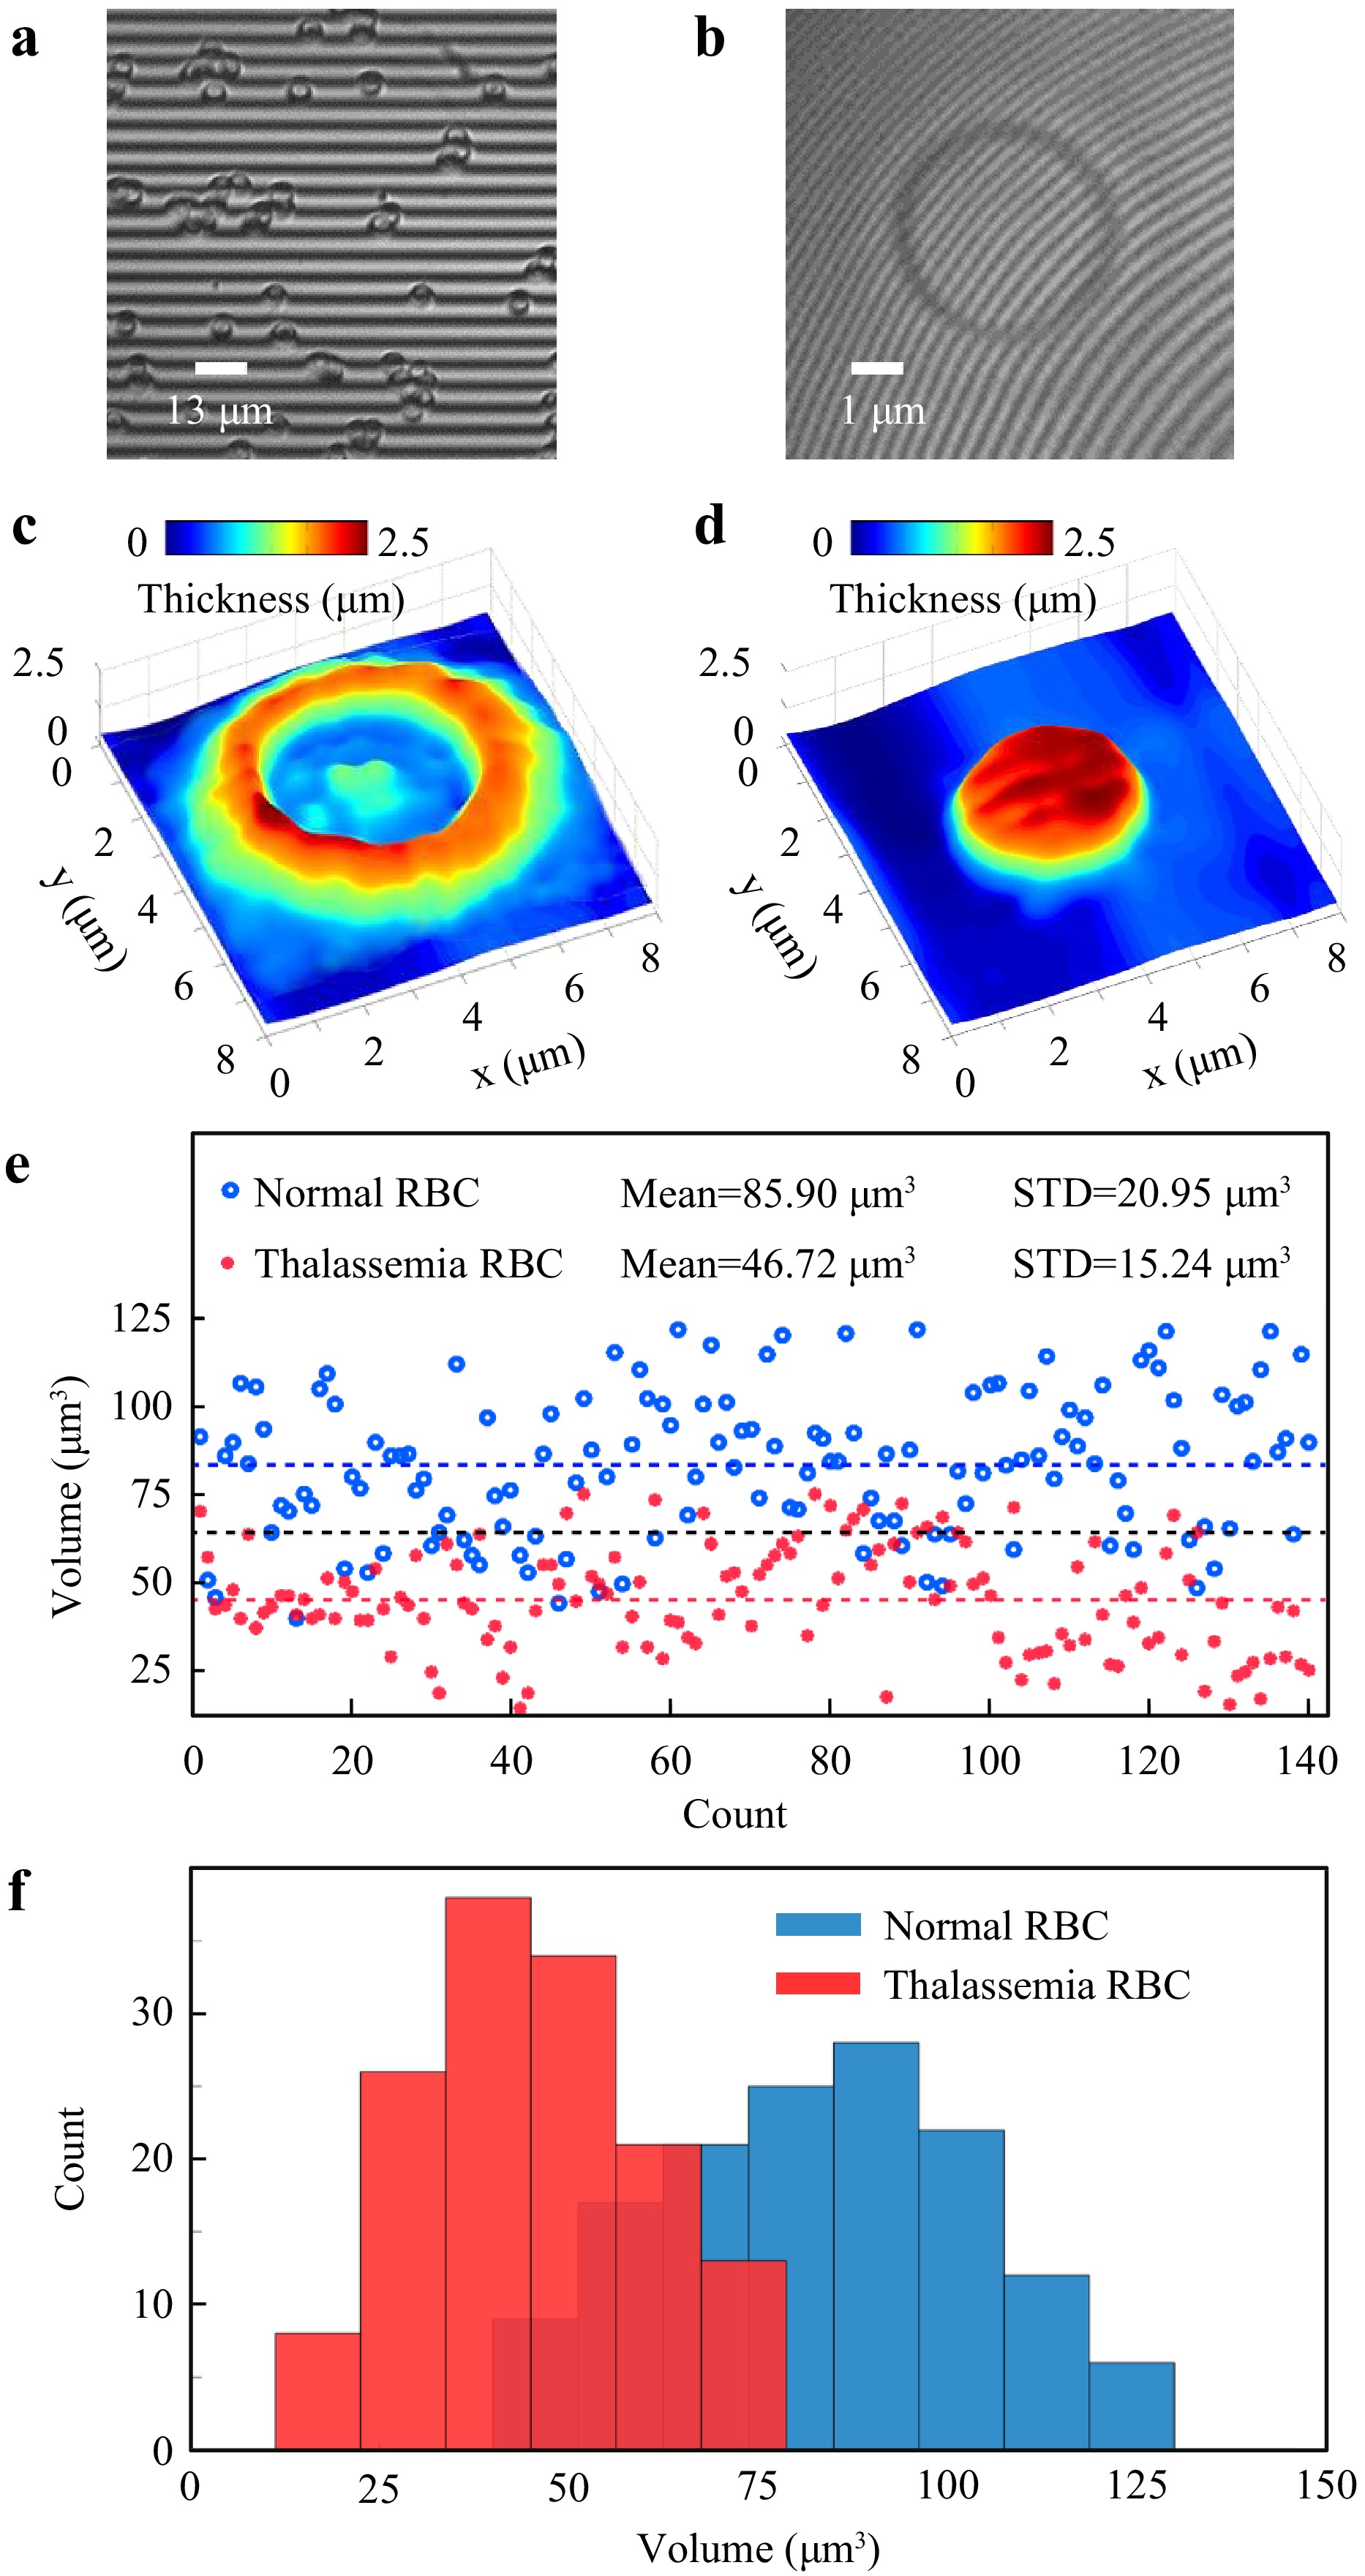
Fig. 8 Microsphere-assisted DHM for cell identification. Hologram of RBC a without and b with an MS. c Reconstructed 3D map of a normal RBC and d thalassemia RBC. e Volume and f Histogram distributions of a limited number of RBCs from the normal (blue) and thalassemia (red) cells, demonstrating clear discrimination between the two types. Reprinted with permission from Ref. 93. Copyright 2017 Optical Society of America.
-
Non-optical-based techniques widely used for surface profilometry, despite offering much better resolution, are beyond the reach of many users and also have their own shortcomings. These sophisticated and expensive methods typically suffer from a limited scanning area, and acquiring a single piece of data may take several minutes and require specific isolation conditions, making them unsuitable for studying temporal changes and dynamic behaviors. Not only is their applicability limited to a narrow range of samples, but there is also always a potential risk of surface damage associated with their usage102.
To address these challenges, a promising solution has been proposed using microsphere-assisted DHM in reflection mode for 3D surface profilometry with a large and adjustable FoV78. The concept was successfully proved by applying the microsphere-assisted Mirau-DHM setup to characterize the 3D surface of pure poly(triazole-amide-imide) (PTAI) and PTAI nanocomposite reinforced with surface-modified TiO2 nanoparticles (PTAI/30% MN-TiO2) samples. A silica microsphere with a diameter of 234 μm was positioned within the working distance of the objective to visualize the fine surface structures.
The reconstructed 3D profiles of pure PTAI and PTAI/30% MN-TiO2 nanocomposite surfaces are shown in Fig. 9a, b, respectively. Cross-sectional profiles along the arbitrary lines AB, A'B', and A"B" indicated in the 2D view of the reconstructed map of pure PTAI shown in Fig. 9c are provided in Fig. 9e. Similarly, the height distribution along CD, C'D', and C"D" lines in Fig. 9d provide morphological information of the PTAI/30% MN-TiO2 sample. The reconstructed holographic results were validated by comparing them with AFM images of the surfaces. The analysis revealed significant morphological changes on the surface of PTAI polymers caused by the presence of nanocomposites, even at levels as low as 10%. Besides, various statistical roughness parameters were computed from multiple 3D height distribution profiles to quantitatively assess and classify the two surfaces. Notably, Fig. 9g highlights the spatial standard deviation (Sq) for 124 cases of pure PTAI and PTAI/30% MN-TiO2, along with the associated histogram distribution. The blue and red dashed lines show the mean value of Sq pure PTAI, PTAI/30% MN-TiO2, respectively. The black dashed line shows the average Sq of the total samples, serving as the discrimination threshold. The figures suggested that the overall roughness of the nanocomposites decreases when reinforced with nanoparticles, implying the capability of the presented approach in detecting the presence of nanoparticles in the polymer surfaces.
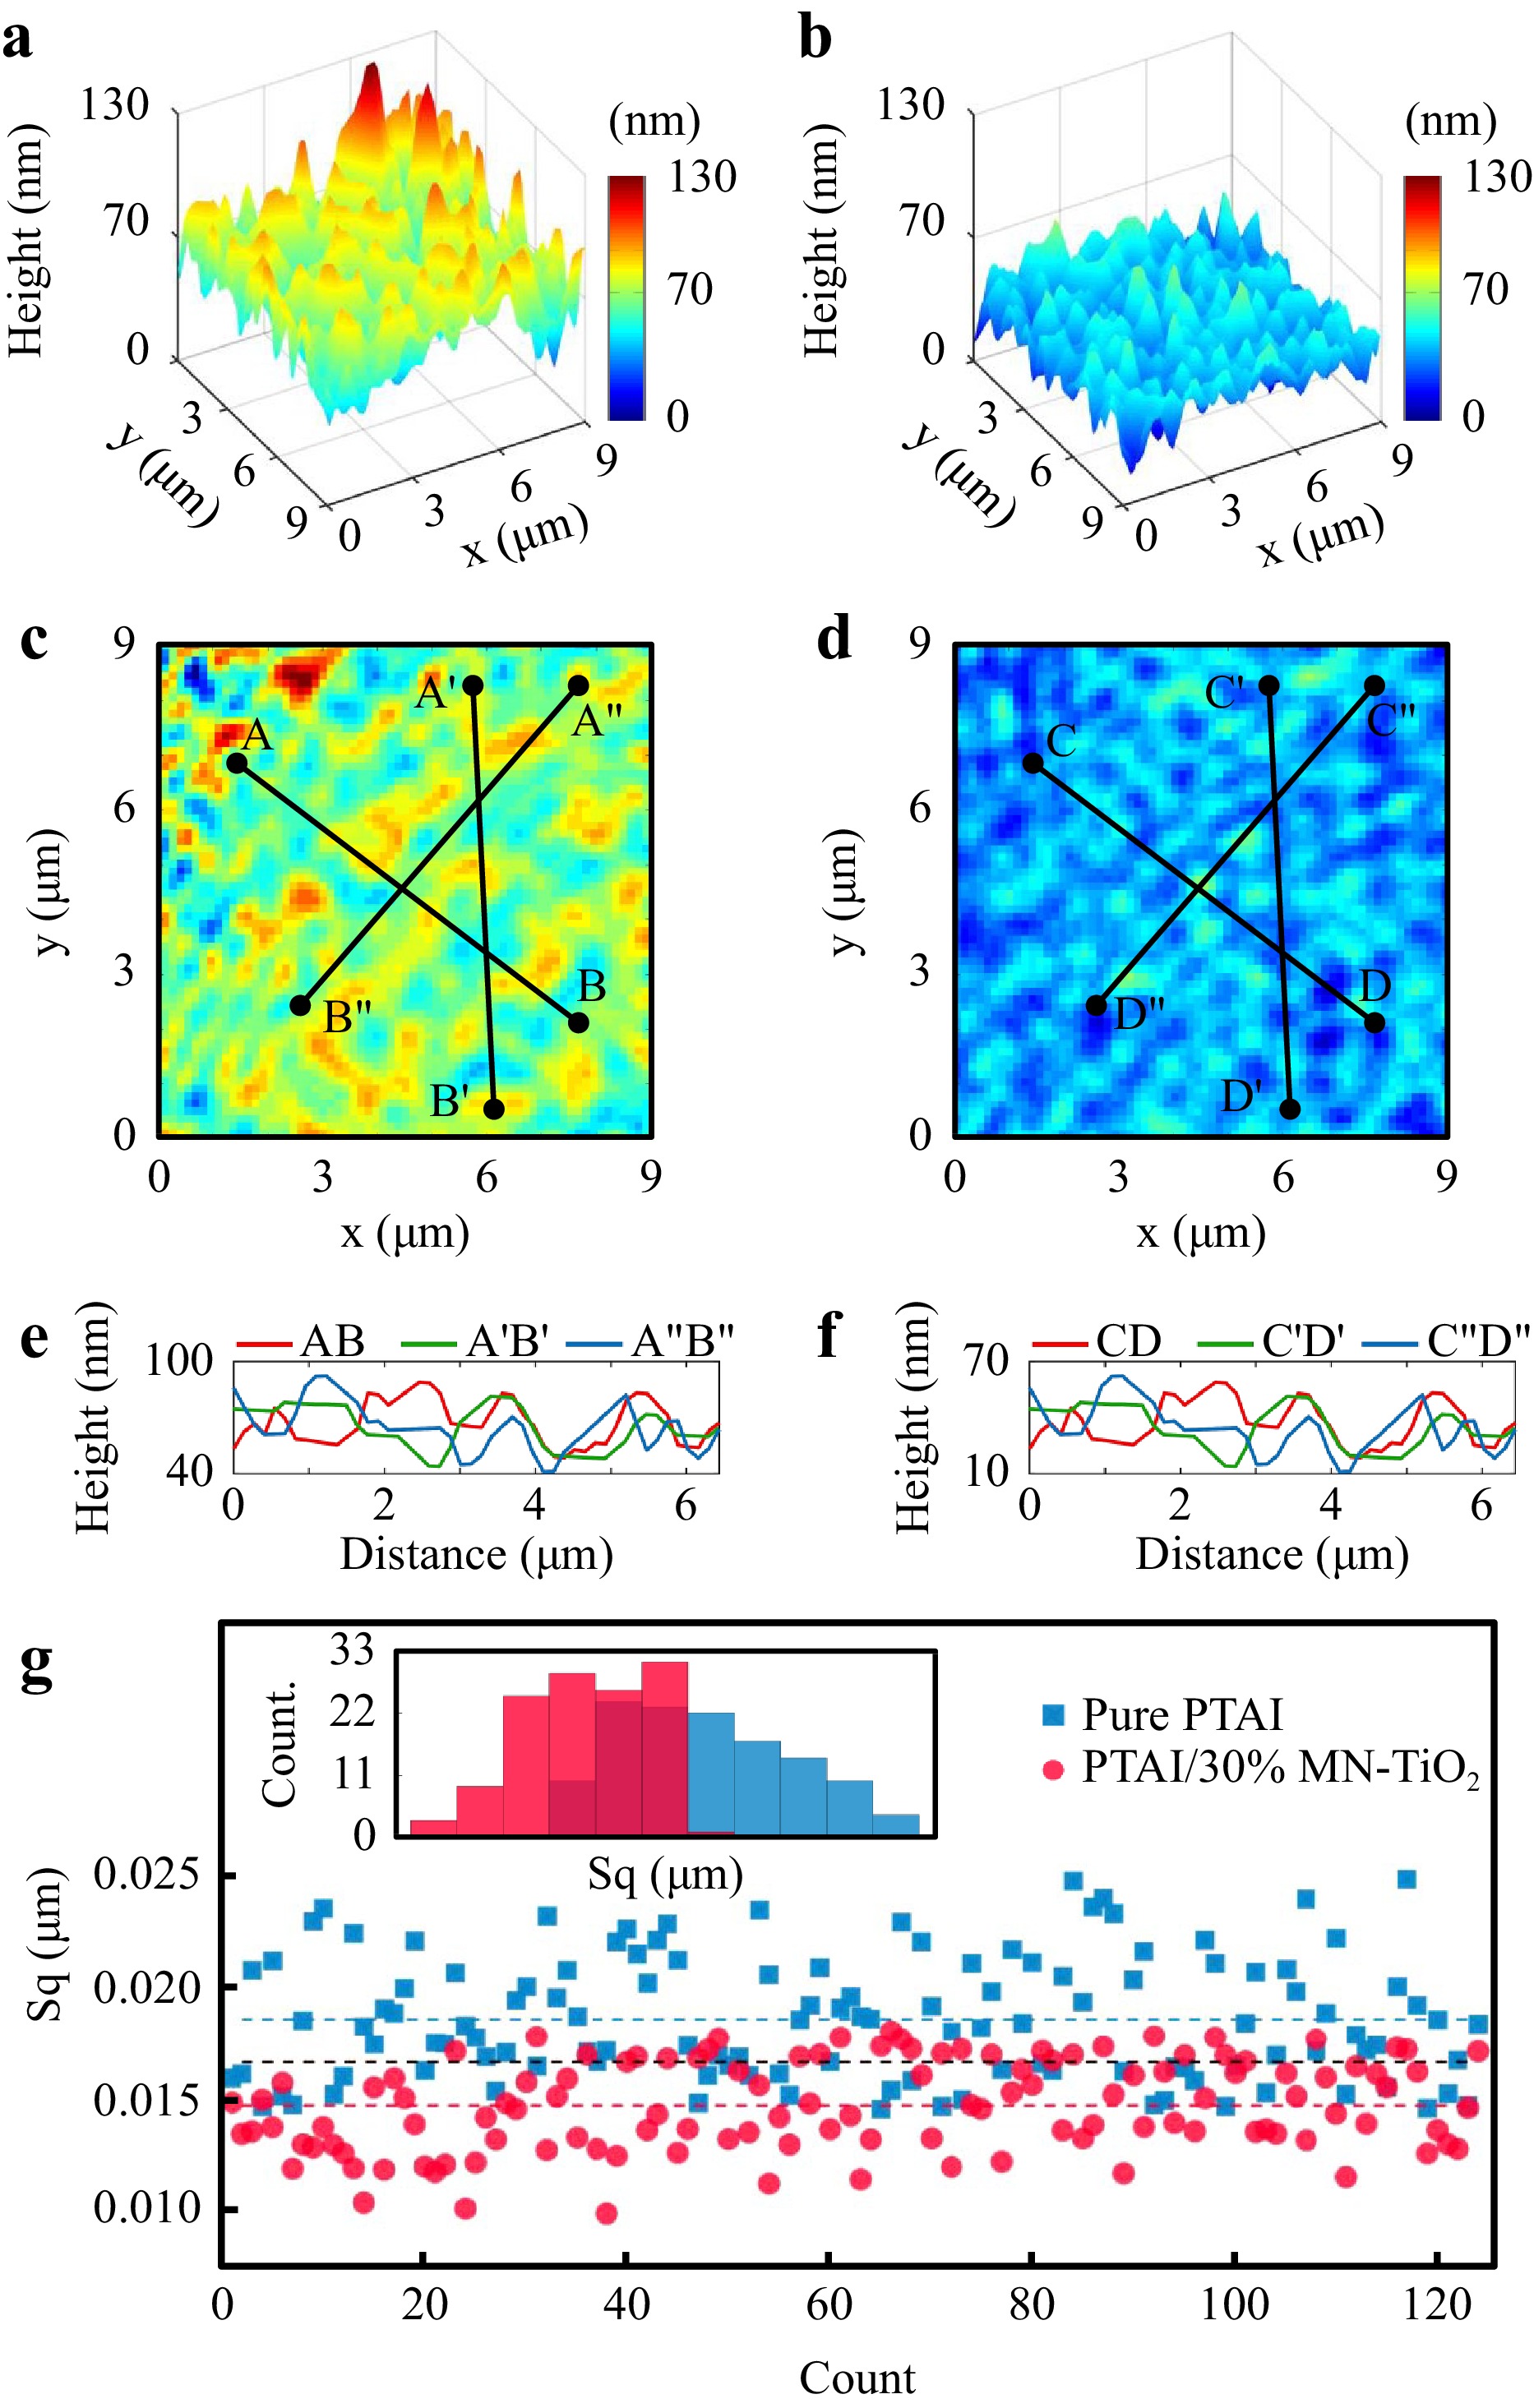
Fig. 9 Microsphere-assisted DHM for 3D surface characterization of polymeric nanocomposites. Reconstructed 3D images and corresponding 2D maps of a and c pure PTAI, and b and d PTAI/30% MN-TiO2. Cross-sectional profiles of pure PTAI along the lines AB, A'B', and A"B" are depicted in (e), similarly cross-sectional profiles of PTAI/30% MN-TiO2 along the lines CD, C'D', and C"D" are shown in (f). The standard deviation of the height distribution for 124 samples is presented in (g), with blue indicating pure PTAI and red representing PTAI/30% MN-TiO2. The blue, red, and black dashed lines represent the mean values of Sq for pure PTAI, PTAI/30% MN-TiO2, and all the samples combined, respectively. Reprinted with permission from Ref. 78 Copyright 2018 Elsevier Publishing Group.
-
The exact mechanism responsible for resolution enhancement in MAM is not yet fully comprehended and is currently the subject of intense investigations3,103. Different effects including the increase in the system’s effective NA and the collection of evanescent waves, as well as the photonic nanojet effect, resonance, and coherent effects, may play a role. However, it should be noted that in different optical arrangements, e.g. reflection mode, transmission mode with microsphere in the illumination or imaging path, different mechanisms may play a major or minor role. The primary factor contributing to the resolution gain is believed to be the enhancement of the system’s effective NA and evanescent wave collection.
To comprehend the super-resolution mechanism of MAM, extensive research has been undertaken, and a range of hypotheses have been proposed primarily based on theoretical assumptions. In order to verify these hypotheses, it is necessary to obtain a meticulously acquired set of quantitative experimental data instead of relying on anecdotal evidence. To ensure a fair comparison between the resolution gain in MAM and that in other imaging modalities, adherence to the classic definition of resolution and a specimen-agnostic method is required.
-
In MAM, microspheres can be either placed directly on the sample or controlled by a lever in a non-contact manner. However, attaching the microsphere to a shaft provides a major benefit, as it enables the adjustment of the system’s main imaging properties by changing the distance between the microsphere and the surface of the specimen. This adjustment affects magnification, resolution, and FoV, and also allows the system to operate in either virtual or real-image mode97.
Several techniques have been proposed to precisely move the microsphere over the specimen, these include a microneedle attached to a micromanipulator25, sharpened tip of a rigid shaft (glass rod)104, the tip of the cantilever105, using optical fiber93, using micropipette106, and fiber-microsphere107.
Nevertheless, achieving precise positioning of a microsphere over the desired area of a sample has remained a challenge. Yet, when it comes to microsphere-assisted DHM, this issue becomes less important. As mentioned earlier, the complex wave field can be retrieved at any desired plane through the numerical reconstruction of a recorded hologram76,81,91.
-
The FoV in MAM is limited by the size of the microspheres. A study showed that FoV is approximately D/5-D/4, where D is the diameter of the microsphere25. Although, the FoV increases with the microsphere size, the magnification and resolution decrease, indicating a trade-off between these parameters. Increasing the FoV is one of the challenges in MAM. Several approaches have been proposed and under investigation to enhance the FoV; the main research line is toward taking a series of images by scanning the specimen by a sphere or arrays of spheres and then stitching the obtained images to create a wide FoV image3. However, for samples with nonuniform surfaces, a precise feedback system is required to control the distance between the sphere and the sample’s surface as resolution and magnification may strongly change with the gap between the sphere and sample23. Nevertheless, the scanning-stitching techniques may have limited viability in imaging samples with high temporal dynamics.
-
MAM is subject to image distortions and aberrations introduced by the microsphere3. It has been shown that microspheres may bring about negligible spherical aberration and high NA when the refractive index contrast between the microsphere and its surrounding medium falls within the range of 1.5 to 1.75108. Designing dedicated MOs and adaptive optics may provide a solution. Furthermore, studies have reported an increase in imaging magnification for barium titanate glass microspheres as the distance from the center of the image increases, which is attributed to pincushion distortion27.
In phase microscopy, the use of a microsphere introduces a distinctive curved deformation in the measured phase. Fig. 10a−c and Fig. 10d−f show a distinct visual representation of the distortion impact on reconstructed profiles microsphere-assisted interference microscopy and microsphere-assisted DHM, respectively. Fig. 10a−c show the reconstructed 3D image, 2D view, and cross-sectional profile of a 400-nm period grating obtained by a microsphere-assisted interference microscopy setup based on a Linnik configuration using a 25 μm diameter microsphere illuminated by a white-light LED44. In this study, assuming a flat sample, the aberration terms were mitigated by reducing the FoV and subsequently applying a polynomial 2D fit using a linear least-squares method, as depicted in Fig. 10c through the red dotted lines. Besides, by incorporating an identical microsphere in the reference arm, wavefront distortion arising from optical aberrations may be circumvented45. On the other hand, in DHM, as discussed earlier, the recording of a reference conjugated hologram enables phase compensation through the numerical reconstruction process89. This approach involves the separate reconstruction of object and reference holograms. By subtracting the reference phase distribution from the sample phase, the phase change introduced by the optical elements, which remained constant during the exposures, is effectively canceled out. As a result, potential contamination and aberrations from the optical train are eliminated from the extracted phase information. Fig. 10d−f and g−i show the reconstructed 3D image, 2D view, and cross-sectional profile of a compact disk (CD) grating with the microsphere-assisted Mirau-DHM setup, utilizing a microsphere with a diameter of a 234 μm, obtained without and with consideration of phase subtraction in the reconstruction processes, respectively.
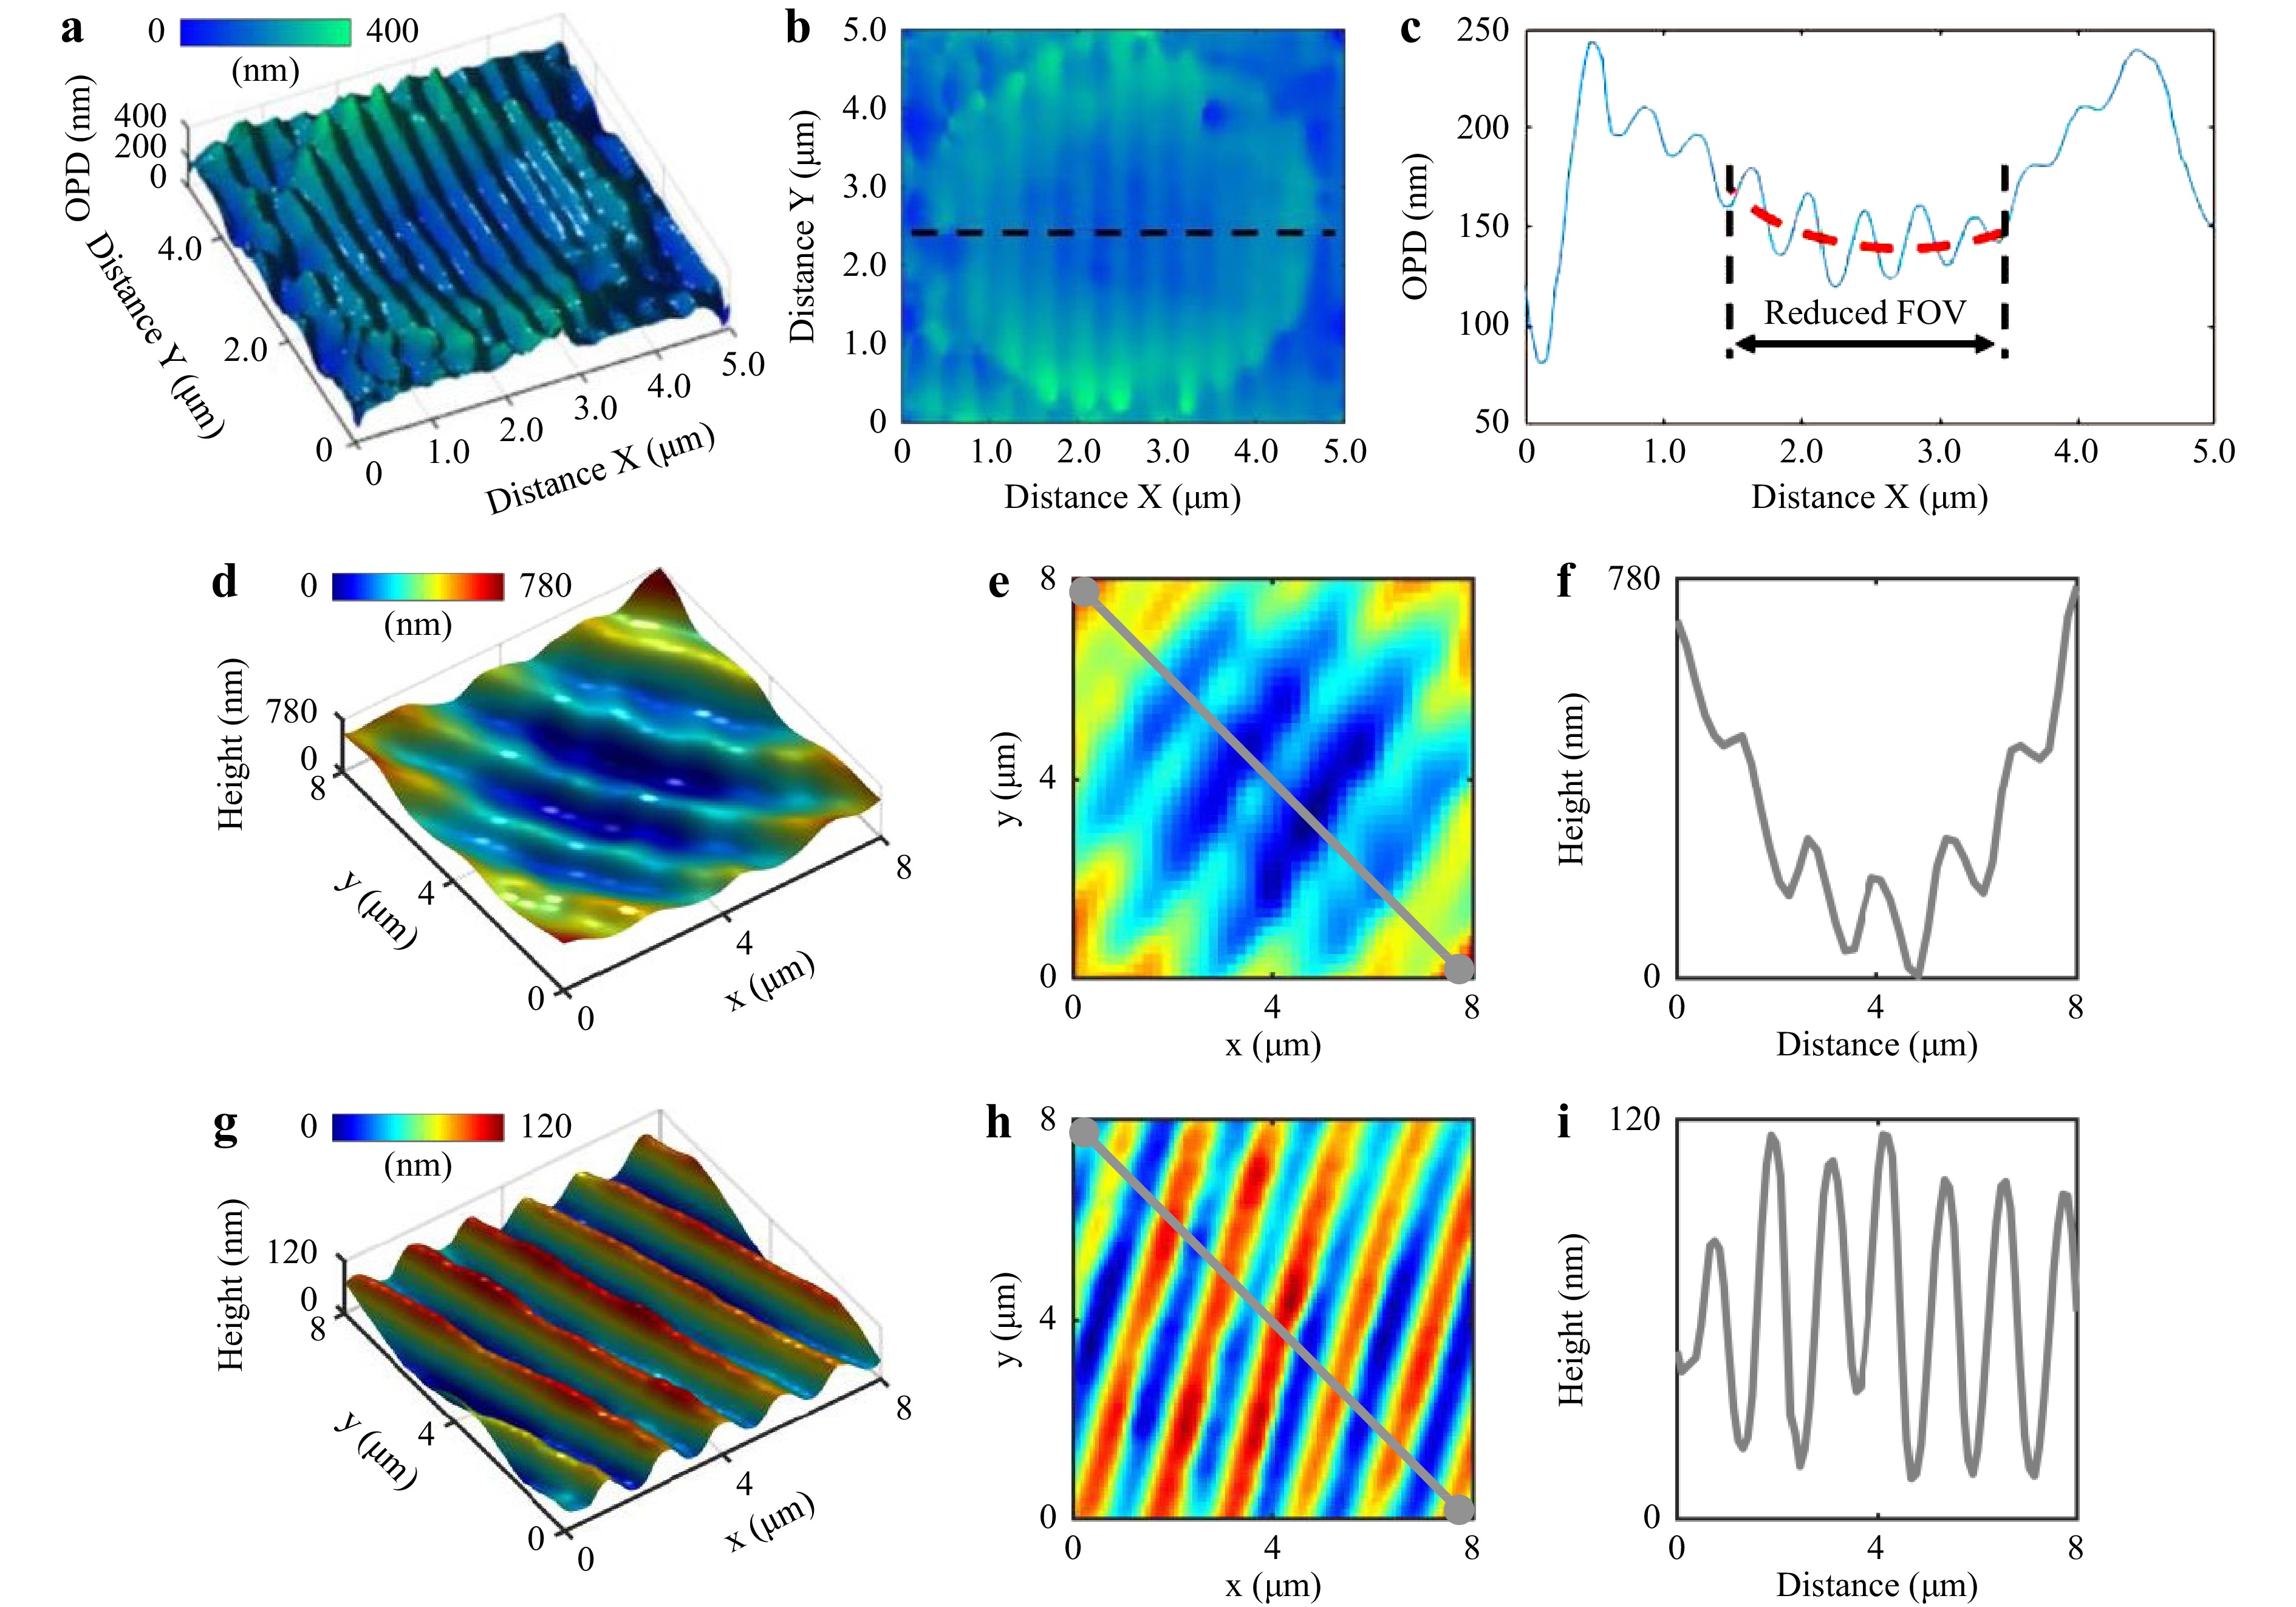
Fig. 10 Image distortion impact introduced by microsphere on reconstructed profiles in microsphere-assisted QPM. a−c Reconstructed 3D image, 2D view, and cross-sectional profile of a 400-nm period grating obtained using microsphere-assisted interference microscopy setup. Reprinted with permission from Ref. 44. Copyright Optical Society of America. Reconstructed 3D image, 2D view, and cross-sectional profile of a compact disk (CD) grating obtained using the microsphere-assisted Mirau-DHM setup d−f without and g−i with subtracting the reference hologram from that of the object during the numerical reconstruction process.
-
Dielectric microspheres can improve the lateral resolution of a given microscopy setup compared to that without the use of the microsphere. A major advantage of this technique, called MAM, is that it does not require additional accessories for the system. On the other hand, a microscopic system of higher NA may reach similar lateral resolution for a much wider field of view. However, in some cases MAM is referred to as a super-resolution technique, i.e. the resolution achieved by MAM surpasses the resolving power of conventional high-NA microscopy systems. Hence, a lot of research has been spent to understand the physical mechanisms that take effect in MAM and care must be taken not to confuse the specific MAM configurations being used.
There are numerous possibilities to incorporate a microsphere in microscopy setups; among them, we discussed in detail microsphere-assisted scanning interferometric and digital holographic microscopies. We focused our discussion on the option to use the microsphere and did not intend to compare which system is better. We mentioned several applications in metrologic measurements and biological sciences. There is ample room for research in MAM as discussed in this review. From the theoretical viewpoint, a comprehensive 3D model to describe the whole imaging system, including the illumination, microsphere, objective lens, 3D sample and its substrate, and imaging sensor as described on the example of CSI for microcylinders in this review would be of great interest to completely understand the resolution enhancement mechanism of MAM. Besides a better understanding, full models help to further improve the resolution by optimizing system parameters. However, such models require an extremely large computational effort and hence cannot be implemented on current conventional computers.
From the experimental point of view, implementation of MAM in some scenarios may not be very straightforward; for example, the FoV is small and the speed for investigating larger areas may not be high. Overcoming these issues would bring new possibilities for the future of MAM.
Microsphere-assisted quantitative phase microscopy: a review
- Light: Advanced Manufacturing , Article number: (2024)
- Received: 19 December 2023
- Revised: 06 January 2024
- Accepted: 09 January 2024 Published online: 15 March 2024
doi: https://doi.org/10.37188/lam.2024.006
Abstract: Light microscopes are the most widely used devices in life and material sciences that allow the study of the interaction of light with matter at a resolution better than that of the naked eye. Conventional microscopes translate the spatial differences in the intensity of the reflected or transmitted light from an object to pixel brightness differences in the digital image. However, a phase microscope converts the spatial differences in the phase of the light from or through an object to differences in pixel brightness. Interference microscopy, a phase-based approach, has found application in various disciplines. While interferometry has brought nanometric axial resolution, the lateral resolution in quantitative phase microscopy (QPM) has still remained limited by diffraction, similar to other traditional microscopy systems. Enhancing the resolution has been the subject of intense investigation since the invention of the microscope in the 17th century. During the past decade, microsphere-assisted microscopy (MAM) has emerged as a simple and effective approach to enhance the resolution in light microscopy. MAM can be integrated with QPM for 3D label-free imaging with enhanced resolution. Here, we review the integration of microspheres with coherence scanning interference and digital holographic microscopies, discussing the associated open questions, challenges, and opportunities.
Research Summary
Microsphere-assisted quantitative phase microscopy
Light microscopes, undoubtedly, are one of the most widely used devices for sample inspection in life and material sciences. However, their spatial resolution is limited due to the wave nature of light. Enhancing the resolution in microscopy has been subject to intense investigation since the invention of the microscope. In the past decade, microsphere-assisted microscopy, the use of transparent microspheres to enhance the resolution, has emerged as a simple yet efficient approach to enhance microscopy resolution. In this work, international teams of authors, invited by Prof. Arash Darafsheh from Washington University School of Medicine in St. Louis, joined together to provide a comprehensive review on the integration of microspheres with coherence scanning interference and digital holographic microscopies, while discussing the associated open questions, challenges, and opportunities.
Rights and permissions
Open Access This article is licensed under a Creative Commons Attribution 4.0 International License, which permits use, sharing, adaptation, distribution and reproduction in any medium or format, as long as you give appropriate credit to the original author(s) and the source, provide a link to the Creative Commons license, and indicate if changes were made. The images or other third party material in this article are included in the article′s Creative Commons license, unless indicated otherwise in a credit line to the material. If material is not included in the article′s Creative Commons license and your intended use is not permitted by statutory regulation or exceeds the permitted use, you will need to obtain permission directly from the copyright holder. To view a copy of this license, visit http://creativecommons.org/licenses/by/4.0/.

 DownLoad: