


-
Accelerometers are essential physical quantity sensors that play a critical role in numerous fields, ranging from automobile attitude control to earthquake monitoring1–6. Although microelectromechanical system (MEMS) accelerometers such as capacitive, piezoelectric, or piezoresistive types7–11, currently dominate consumer electronics and industrial control applications, they face challenges related to circuit noise, temperature variation, and external low-frequency vibrations in many high-requirement applications such as inertial navigation. These obstacles can be addressed using optical accelerometers. However, the challenge remains in the integration of various mechanical and optical components to develop compact, high-precision optical accelerometers with strong environmental adaptability, including temperature resistance and anti-interference capability.
One of the most promising solutions to these challenges is optical fiber sensor technology because of its unique advantages such as small size, light weight, immunity to electromagnetic interference, and potentially low cost. Over the past few decades, significant efforts have been devoted to the development of optical fiber accelerometers12–29. For instance, fiber Bragg grating (FBG) accelerometers have been utilized for seismic monitoring and structural dynamic analysis12,13, demonstrating their capability to detect small movements with high precision. Mechanical and optical methods have been proposed to enhance sensitivity14,15. Recent developments have expanded the capabilities of FBG accelerometers to include low-temperature sensitivity, high-frequency detection, and multi-axis detection16–18. However, FBG-based accelerometers still face challenges in distinguishing directions and demodulating signals19. Fabry–Pérot (FP) interferometers are widely used in vibration measurements due to their simple structure, low cross-axis interference, high sensitivity, and stability20–22. Typically, these accelerometers have centimeter-scale dimensions that limit their application scenarios. Fiber-tip accelerometers have been proposed to reduce the structure size23–26. These devices feature an FP interferometer between the optical fiber end face and the suspended sensing structure, most commonly a cantilever. However, conventional cantilever structures may tilt slightly during displacement, which can cause additional perturbations to the optical signal. In the fabrication process of these miniature accelerometers, mechanical assembly27, femtosecond laser23–25, focused ion beam28, and lithography, electroplating, and molding combined with manufacturing processes29 have been applied. However, these techniques increase the cost and complexity of the fabrication process. Additionally, currently demonstrated optical fiber accelerometers have a resonant frequency of approximately several hundred to thousand Hz, making them susceptible to low-frequency environmental vibrations and resulting in a narrow bandwidth.
In this work, we present a miniature optical fiber interferometric accelerometer based on an FP microinterferometer that is directly 3D printed on the end face of a fiber-optic ferrule. An in-situ 3D microprinting technology is developed to fabricate a submillimeter proof mass-integrated FP microinterferometer. Through laser interferometric measurements, the acceleration-induced changes in the cavity length of the FP microinterferometer can be demodulated by varying the light intensity. The experimental results revealed that the miniature optical fiber accelerometer can achieve not only a wide bandwidth with a flat frequency response of up to 2 kHz but also a low limit of detection, with a noise-equivalent acceleration of 62.45 μg/Hz.
-
Fig. 1 shows a schematic design of the single-axis optical fiber interferometric accelerometer for monitoring acceleration in the z direction. The sensor head consists of two layers: the bottom layer is a three-petal base and the upper layer is a 3D microstructure that combines a proof mass and a thin-film reflector. The components are suspended by three microbeams and pillars on a three-petal base.
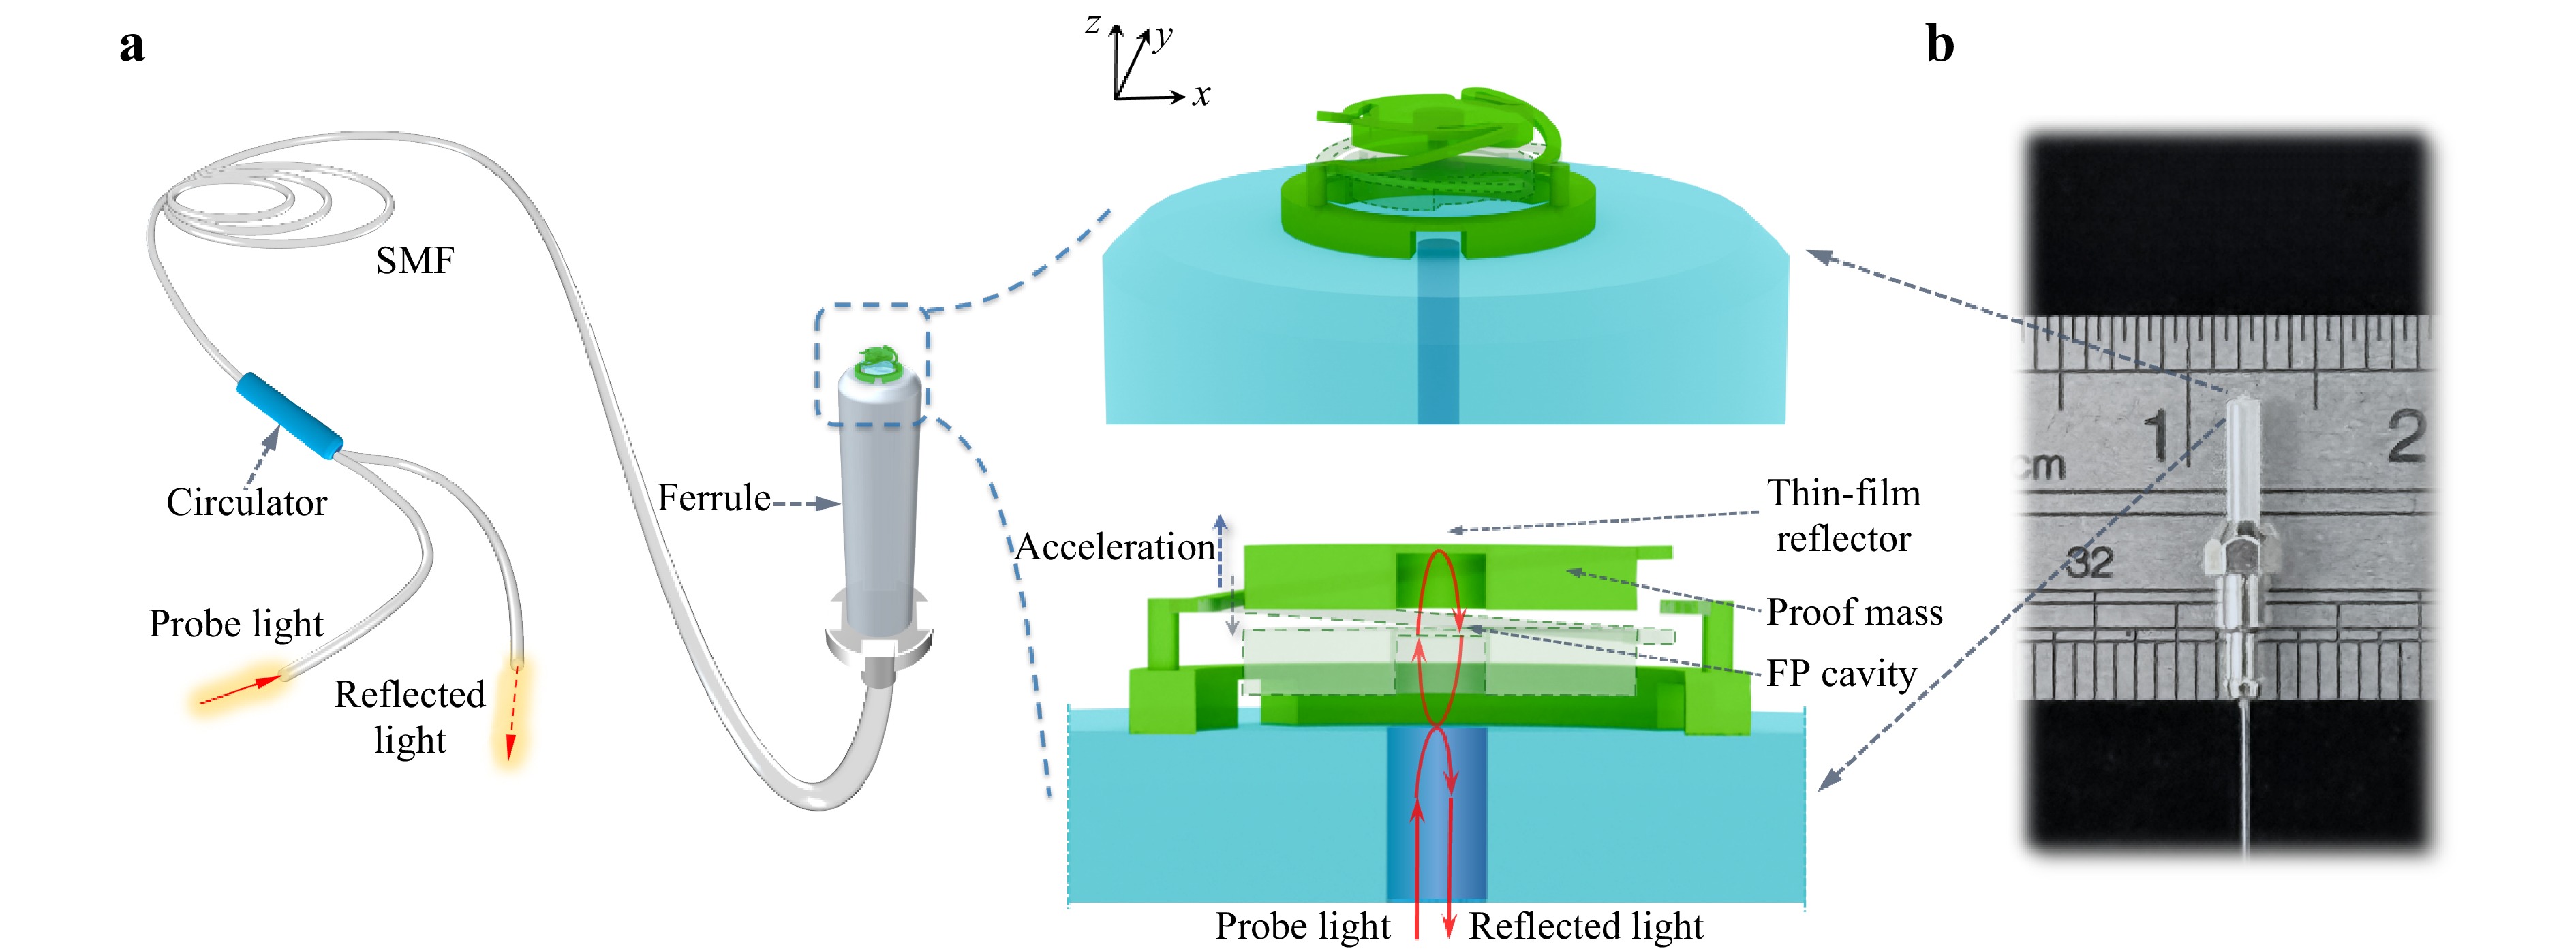
Fig. 1 a Schematic design of the miniature optical fiber accelerometer based on a ferrule-top FP microinterferometer. b Photo of a fiber optic ferrule with a fabricated sensor head.
A three-petal base is designed to construct a relatively long cavity for the FP microinterferometer. This design shortens the free spectral range of the reflection spectrum, thereby enhancing the optical sensitivity of the accelerometer. In addition, it provides free space for the proof mass to move in response to acceleration. The proof mass part is significantly thicker than the microbeams to achieve high sensitivity to acceleration, whereas the thin-film reflector is very thin to reduce the dual-cavity effect. The thin-film design of the reflector helps eliminate a slowly varying envelope, resulting in a reflection spectrum with a high-distinguishing-ratio fringe pattern for laser interferometric interrogation. The use of the three supporting pillars efficiently prevents displacement of the proof mass in the horizontal (x and y) directions, thereby increasing the linearity of the sensor response. Furthermore, microbeams can be designed to be either folded or straight, allowing the resonant frequency of the suspended 3D microstructure to be flexibly tailored.
Because the FP microinterferometer is formed by air/fiber end-face and air/epoxy thin-film interfaces, the reflectivities of these two interfaces are very small and nearly identical. When considering the effect of acceleration a on the change in cavity length, the reflected interference light intensity I can be expressed as follows30,31:
$$ I = 2R\left[ {1 - \cos \left( {\frac{{4{\text π} n}}{\lambda }\left( {{L_0} + \frac{{ma}}{k}} \right)} \right)} \right]{I_0} $$ (1) where R is the reflectivity of the two interfaces, λ is the wavelength of the incident light, n is the refractive index of the medium (1.0 for the air cavity in our accelerometer), L0 is the original FP cavity length, m is the mass of the proof mass, k is the mechanical stiffness of the supporting microbeams, and I0 is the input light intensity. $ ma/k = \Delta L $ represents the acceleration-induced displacement of the proof mass. It can be seen that the reflected interference light intensity depends on the cavity length in the form of a cosine function.
The sensitivity of the output light intensity to changes in acceleration, often referred to as mechanical sensitivity, is given by
$$ \frac{{\partial I}}{{\partial a}} = \frac{{8{\text π} mR}}{{k\lambda }}\sin \left[ {\frac{{4{\text π} }}{\lambda }\left( {{L_0} + \frac{{ma}}{k}} \right)} \right]{I_0} $$ (2) This indicates that the mechanical sensitivity of the accelerometer can be enhanced using a heavier proof mass and/or softer mechanical stiffness. However, this may result in a relatively low mechanical resonant frequency, which is provided by $ {\omega _m} = \sqrt {k/m} $.
The optical sensitivity of an FP interferometric accelerometer, defined as the slope of the light intensity in the spectrum, is given by
$$ \frac{{\partial I}}{{\partial \lambda }} = - \frac{{8{\text π} R}}{{{\lambda ^2}}}\left( {{L_0} + \frac{{ma}}{k}} \right)\sin \left[ {\frac{{4{\text π}}}{\lambda }\left( {{L_0} + \frac{{ma}}{k}} \right)} \right]{I_0} $$ (3) Because the acceleration-induced displacement is very small compared to L0, the maximum optical sensitivity of the FP interferometric accelerometer can be estimated using $ 8{\text π}R{L_0}{I_0}/{\lambda ^2} $. The maximum sensitivity can be achieved by selecting the wavelength of the probe light at the quadrature point of the reflection spectrum of the FP microinterferometer. The formula also indicates that a higher reflectivity and longer cavity are beneficial for improving the optical sensitivity of the accelerometer, although this may increase the fabrication complexity and cost.
-
Using an own-built digital ultraviolet (UV) exposure setup32, as shown in Fig. 2a, we further improved our optical 3D microprinting technology. This enhancement enables direct in-situ 3D microprinting of the proof mass-integrated FP microinterferometer on the end face of a fiber-optic ferrule, thereby creating the designed optical fiber accelerometer. The setup consisted of a high-power UV source (with a wavelength of 365 nm), a UV-grade digital micromirror device (DMD for the dynamic generation of light patterns, a set of projection optics for demagnifying light patterns, a digital camera for machine vision metrology, a high-precision motorized XY stage, and a vertical stage for high-accuracy alignment. The complete setup of the in-situ optical 3D microprinting system is shown in Fig. S1.
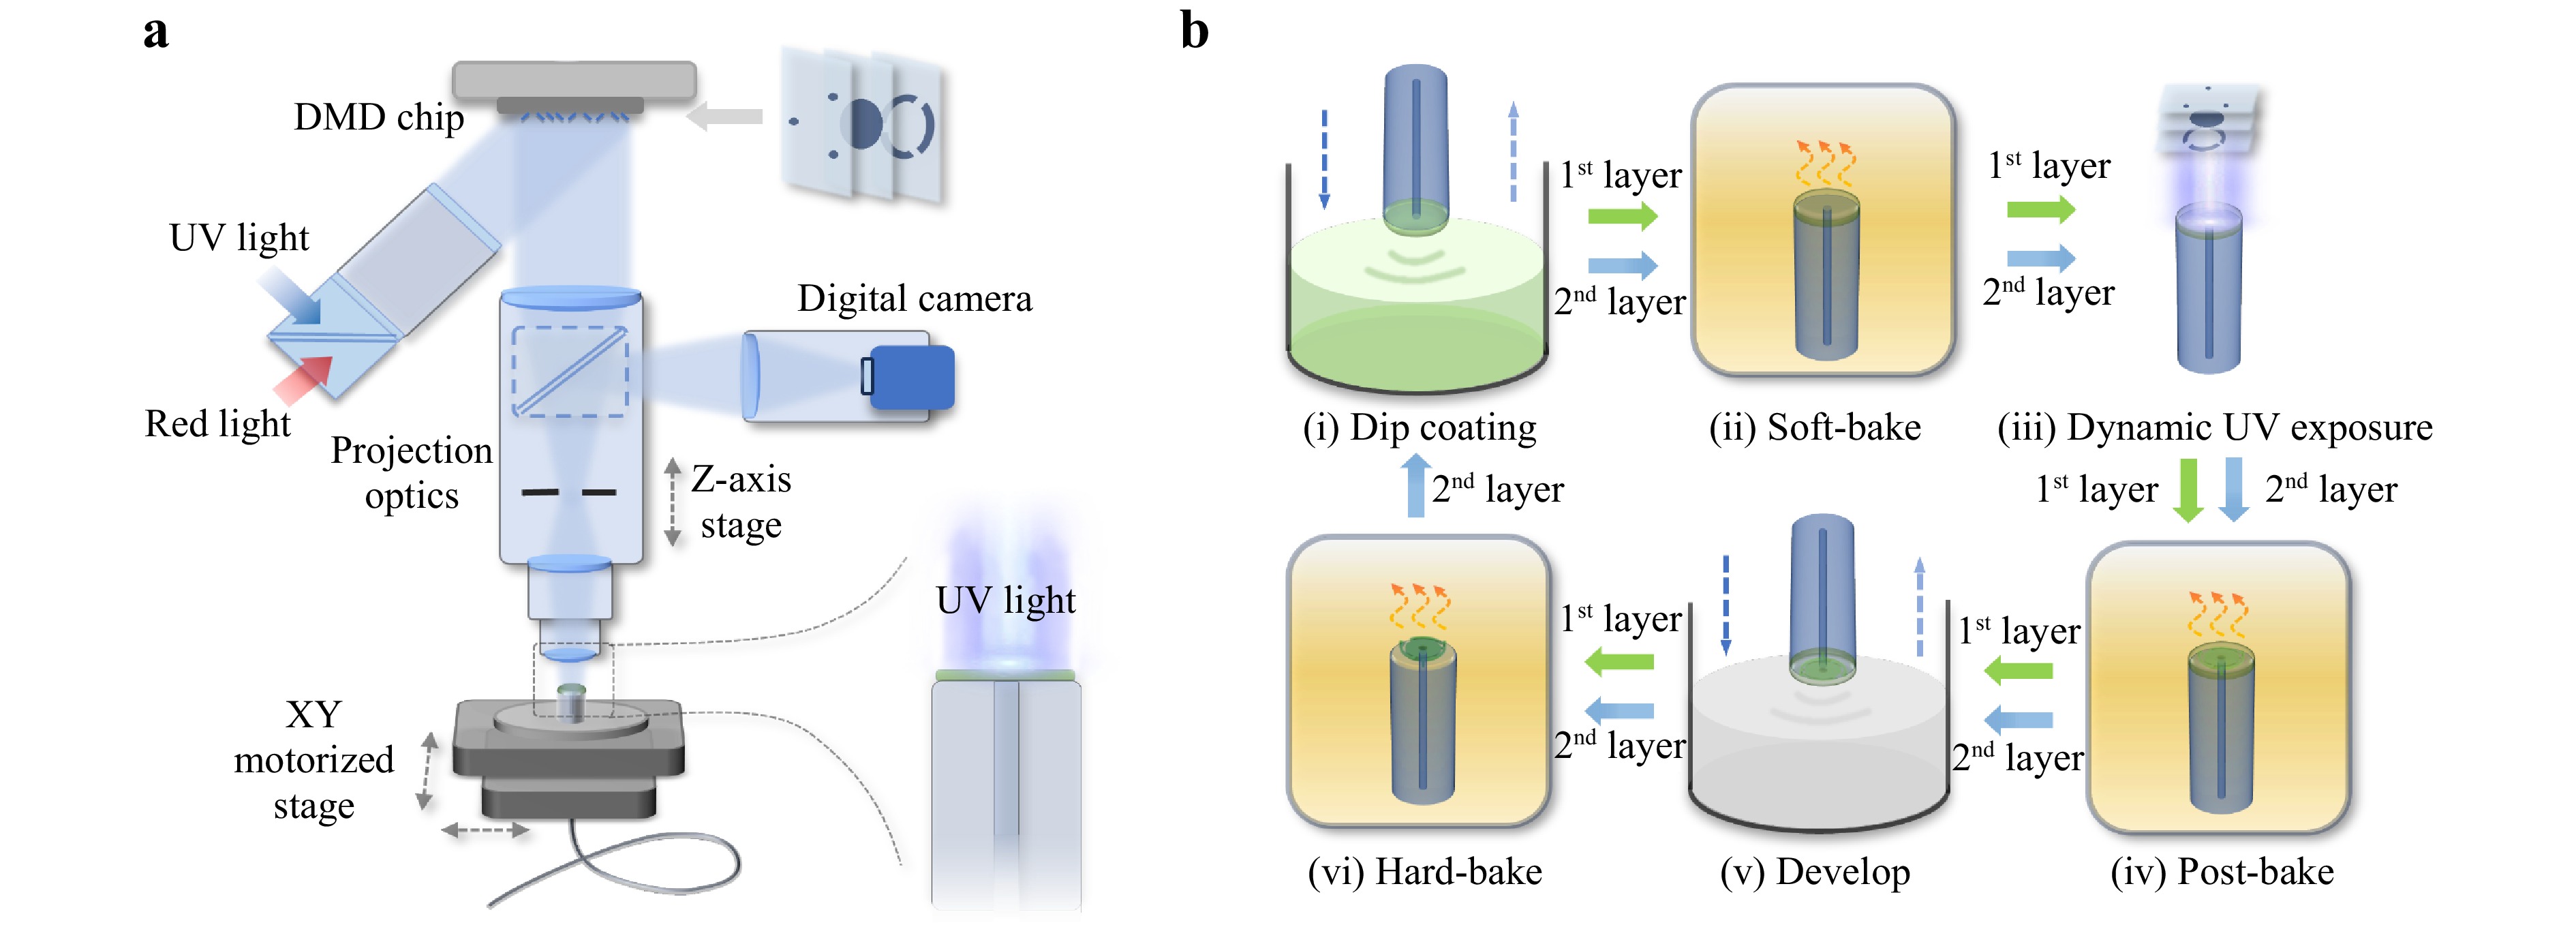
Fig. 2 a Schematic of the in-situ optical 3D microprinting system. b Flow of all fabrication processes. The fabrication processes are repeated for two rounds: the first round, indicated by green arrows, fabricates the bottom-layer three-petal base, whereas the second round, indicated by blue arrows, fabricates the upper-layer 3D microstructure, including the reflection mirror, proof mass, supporting microbeams, and pillars.
The EPON resin SU-8 was chosen to fabricate the designed 3D microstructure because of its good optical properties, including high transparency in both the visible and near-infrared ranges, as well as its outstanding chemical resistance and mechanical strength. SU-8 was dissolved in cyclopentanone to a concentration of 20 wt%. The photoinitiator 4-octyloxyphenyl phenyliodonium hexafluoroantimonate was added to 4 wt% SU-8 to produce photoacids upon light absorption. Tributylamine was added to 0.373 wt% SU-8 as an inhibitor. Tinuvin 234 was added to 0.4 wt% SU-8 as a UV absorber to improve the vertical resolution of the optical printing process.
Fig. 2b shows a flow of the in-situ 3D microprinting process. A newly cleaved optical fiber was inserted into the fiber-optic ferrule. The optical fiber and ferrule were then dipped into the prepared SU-8 solution. After dipping, a soft-baking process was applied to evaporate the solvent using an oven at 65 °C for 5 min and at 95 °C for 15 min, resulting in a thin SU-8 film with a thickness of approximately 45 μm. Subsequently, dynamic optical exposure was performed using image data sliced from the CAD model of the bottom layer, utilizing a custom-built in-situ 3D microprinting setup. A digital camera-based machine vision module was employed to align the fiber-optic ferrule precisely, enabling high-precision optical exposure on the end face of the ferrule. After optical exposure, the sample was post-baked at 75 °C for 30 min and then developed sequentially with propylene glycol monomethyl ether acetate and a low surface tension solvent, methyl nonafluorobutyl ether, to create a 3D microstructure. Finally, the sample was hard-baked in an oven at 105 °C for 15 min to enhance the mechanical strength of the fabricated 3D microstructure. These processes were repeated with different pattern data to fabricate the second layer of the sensor head, including the supporting pillars, suspended microbeams, proof mass, and thin-film reflector.
-
In the experiments, the outer diameter of the bottom layer (i.e., the three-petal base) is approximately 400 μm, which is determined by the maximum exposure area of our 3D microprinting setup. The height of this layer is approximately 45 μm, depending on the dip coating process. The diameter of the three supporting pillars is approximately 25–30 µm. These pillars can effectively prevent the displacement of the proof mass in the horizontal direction because the SU-8 photoresist is a strong epoxy and the proof mass is very light, weighing only approximately 1.6 µg.
Fig. 3 shows two designs for the sensor heads of the optical fiber accelerometers, referred to as accelerometers 1 and 2, with different sensitivities and resonant frequencies. Design 1 used three folded microbeams to suspend the proof mass, whereas Design 2 employed three circular arc microbeams. The width and thickness of the microbeams in both designs are 20 and 10 μm, respectively. The thickness of the proof mass is increased to 35 μm. To suppress the dual-cavity effect, the thickness of the thin-film reflector is chosen to be approximately 3–5 μm, which was printed together with the proof mass and microbeams by using a gray-scale pattern, as shown in Fig. S3b. The height of the entire two-layer structure is approximately 90 μm, which not only provides a relatively high optical sensitivity (see Eq. 3) but also maintains a low optical loss by avoiding observable divergence of the light beam within the cavity.
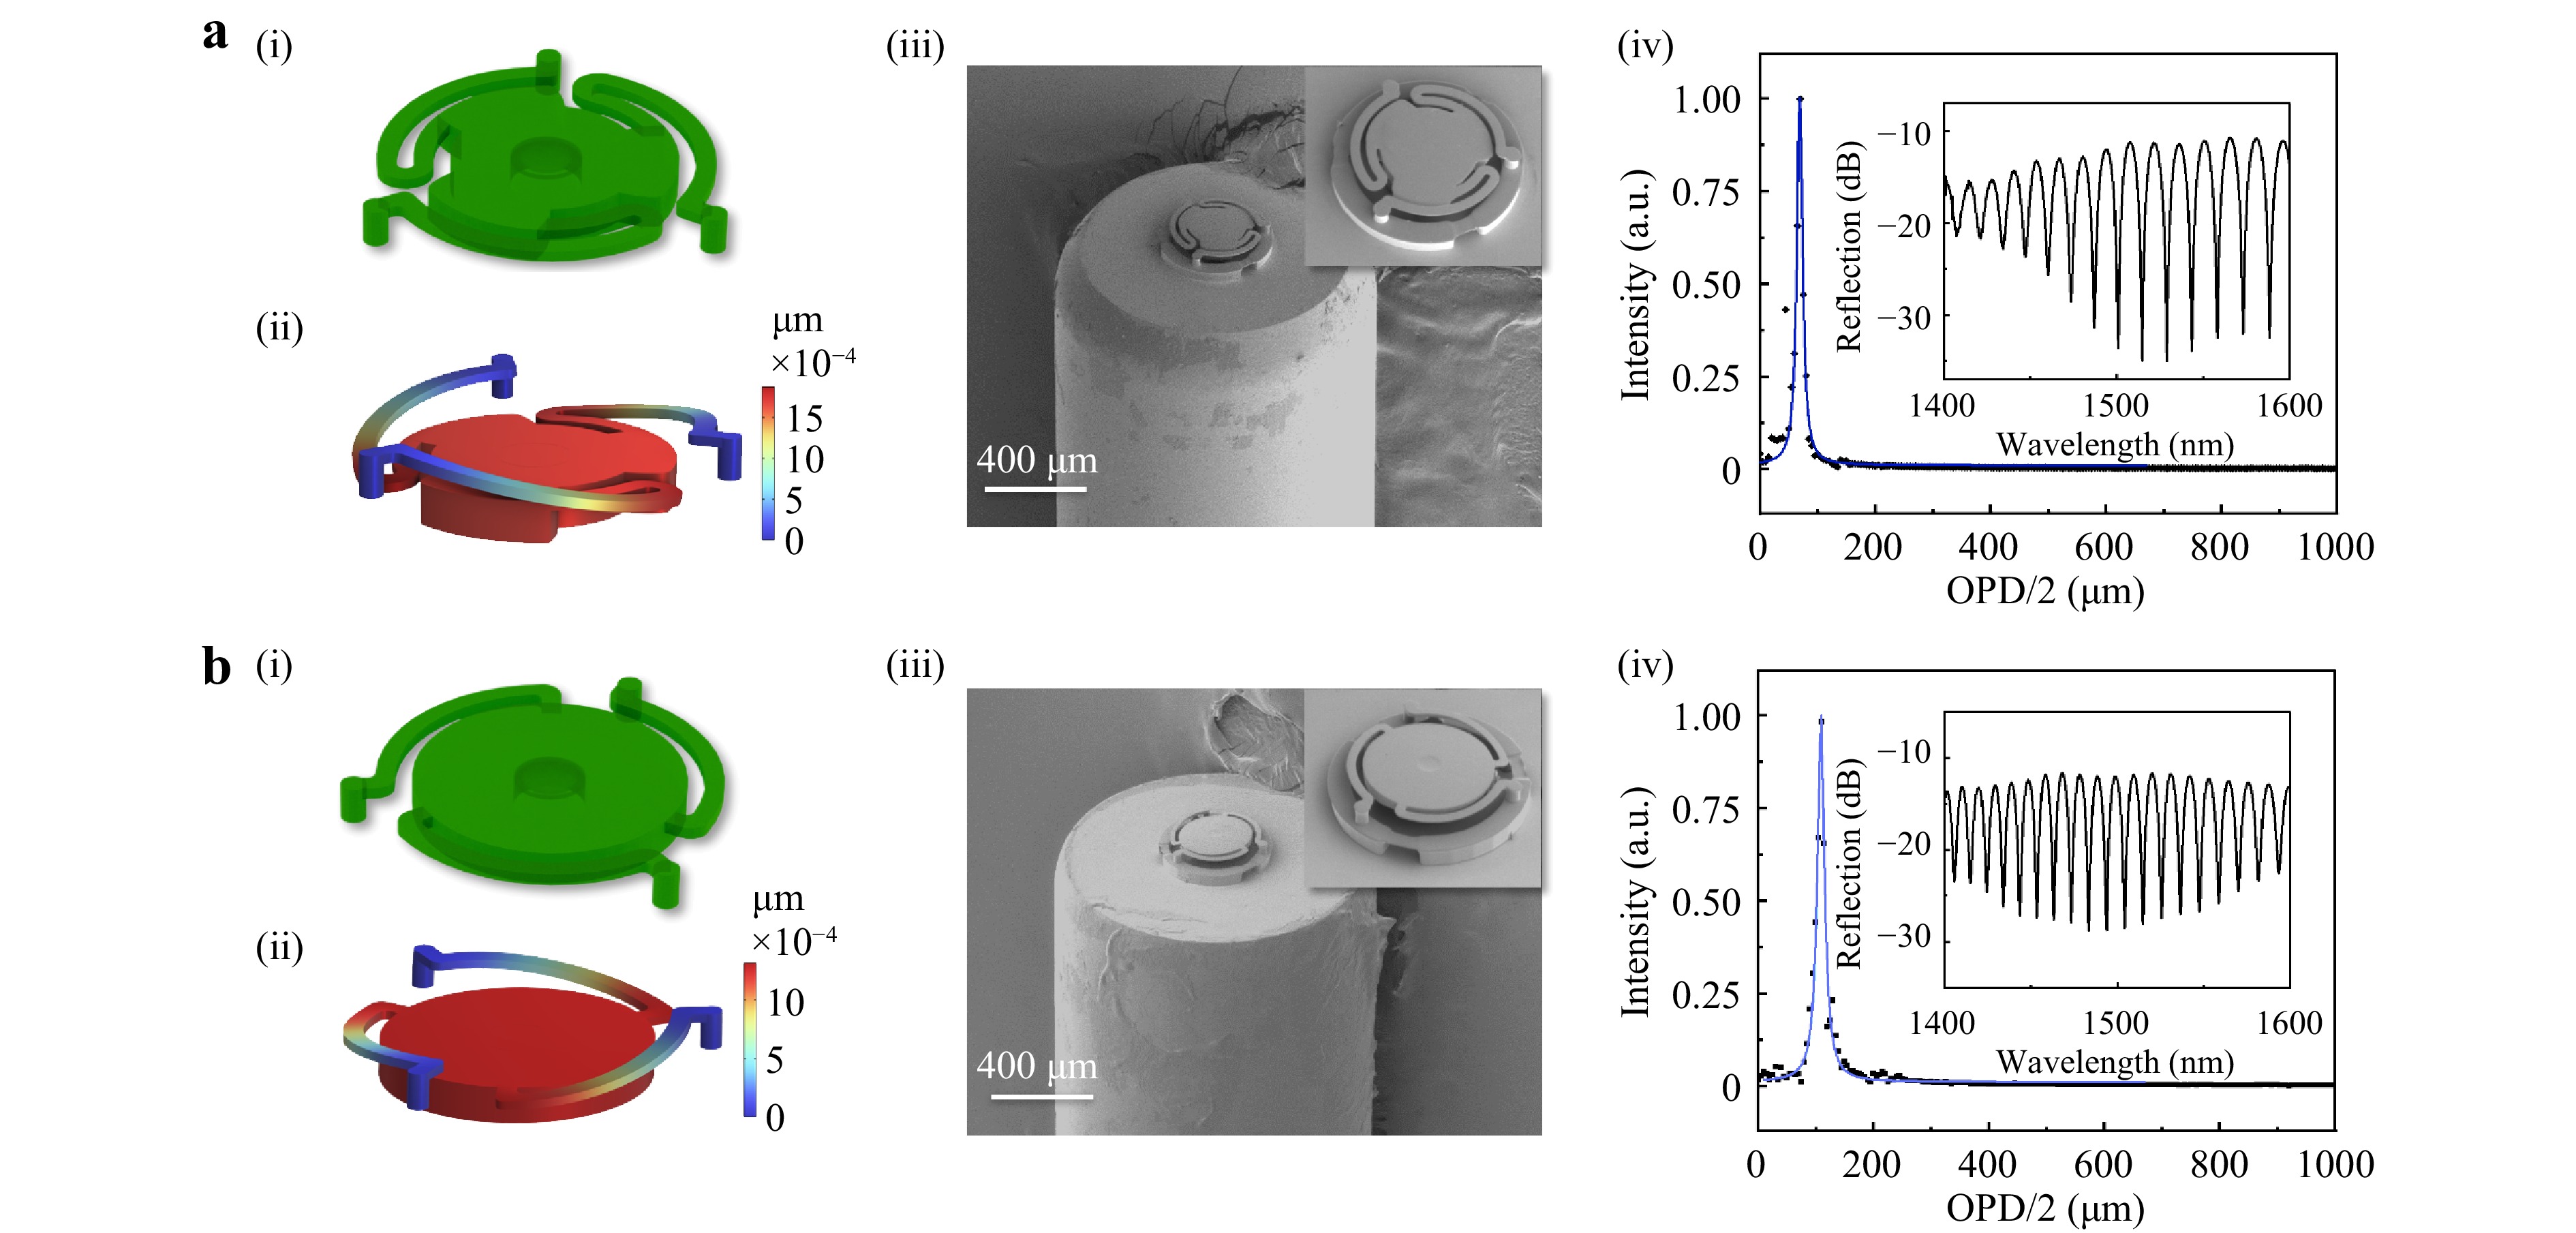
Fig. 3 Modeling, fabrication and optical testing results of the sensor heads of two designed accelerometers: a Accelerometer 1 with three folded microbeams: (i) CAD model; (ii) Numerical simulation result of the displacement of sensor head under 1-g acceleration; (iii) SEM image of the fabricated sensor head; (iv) FFT result of the measured reflection spectrum. The peak position of one-half of the optical path difference (i.e., OPD/2) indicates the cavity length. The inset is the measured reflection spectrums in log scale. b Accelerometer 2 with three circular-arc microbeams: (i) CAD model; (ii) Numerical simulation result of the displacement of sensor head under 1-g acceleration; (iii) SEM image of the fabricated sensor head; (iv) FFT result of the measured reflection spectrum.
The acceleration sensitivity and frequency responses of the two designs were numerically analyzed using the commercial finite element method software COMSOL Multiphysics. The Young’s modulus and Poisson’s ratio of SU-8 used in the simulation were 4.0 GPa and 0.22, respectively33. Under an acceleration of 1-g (i.e., 9.8 m/s2), the centers of the thin-film reflectors of accelerometers 1 and 2 exhibited displacements of 1.85 and 1.31 nm, respectively. Their calculated resonant frequencies are 11.49 and 13.62 kHz, respectively (see the simulated frequency response curves in Fig. S2). Another design using a relatively short microbeam is shown in Fig. S3, with 1-g induced displacement and resonant frequency of 0.68 nm and 16.12 kHz, respectively.
Figs. 3a(ii), 3b(ii) show the scanning electron microscopic (SEM) images of the fabricated sensor heads of the optical fiber accelerometers. The geometries of the fabricated structures agreed well with those of the CAD models. The upper-layer 3D microstructure was suspended directly above the bottom layer (i.e., three-petal base). The thin-film reflector part of the sensor head of accelerometer 2 was clearly visible because the thin-film reflector was relatively thin and experienced slight deformation during the fabrication processes.
The optical reflection spectra of the fabricated accelerometers and their fast Fourier transform (FFT) results are presented in Figs. 3a(iv), 3b(iv), respectively. These measurements were obtained using a broadband light source and an optical spectrum analyzer. The maximum extinction ratio of the measured spectra is approximately 20 dB. The free spectral ranges of the two accelerometers are 13.9 and 10.5 nm, respectively. The FFT results of the measured spectra clearly indicate the cavity lengths of the fabricated FP microinterferometers. The cavity lengths of the two FP microinterferometers are approximately 70 and 109 μm, respectively. Notably, the maximum optical sensitivity of accelerometer 1 around 1550 nm was measured to be 0.05 mW/nm when the input light intensity was 1.743 mW. Given that the reflectivities of both the optical fiber end face/air and air/SU-8 thin-film reflector interfaces are approximately 4%31, the theoretical optical sensitivity estimated by (3) was 0.0512 mW/nm, which agrees well with the measured values.
The experimental setup used to test the responses of the fabricated accelerometers is shown in Fig. 4. A tunable laser was used as the interrogation laser source for the signal demodulation of the interferometric accelerometers. Its wavelength was tuned to the quadrature point of the reflection spectrum to maximize optical sensitivity. Based on the measured spectrum, a quadrature point at 1547 nm was selected to test accelerometer 1. A commercial vibration exciter (Type 4808, Brüel & Kjær Company) equipped with a commercial reference accelerometer was employed to apply the sinusoidal acceleration and test the accelerometer’s responses. The reflected light is redirected to a photodiode (PD via a circulator, where the light signal is converted into an electrical signal. The output signal was collected using a lock-in amplifier and an oscilloscope.
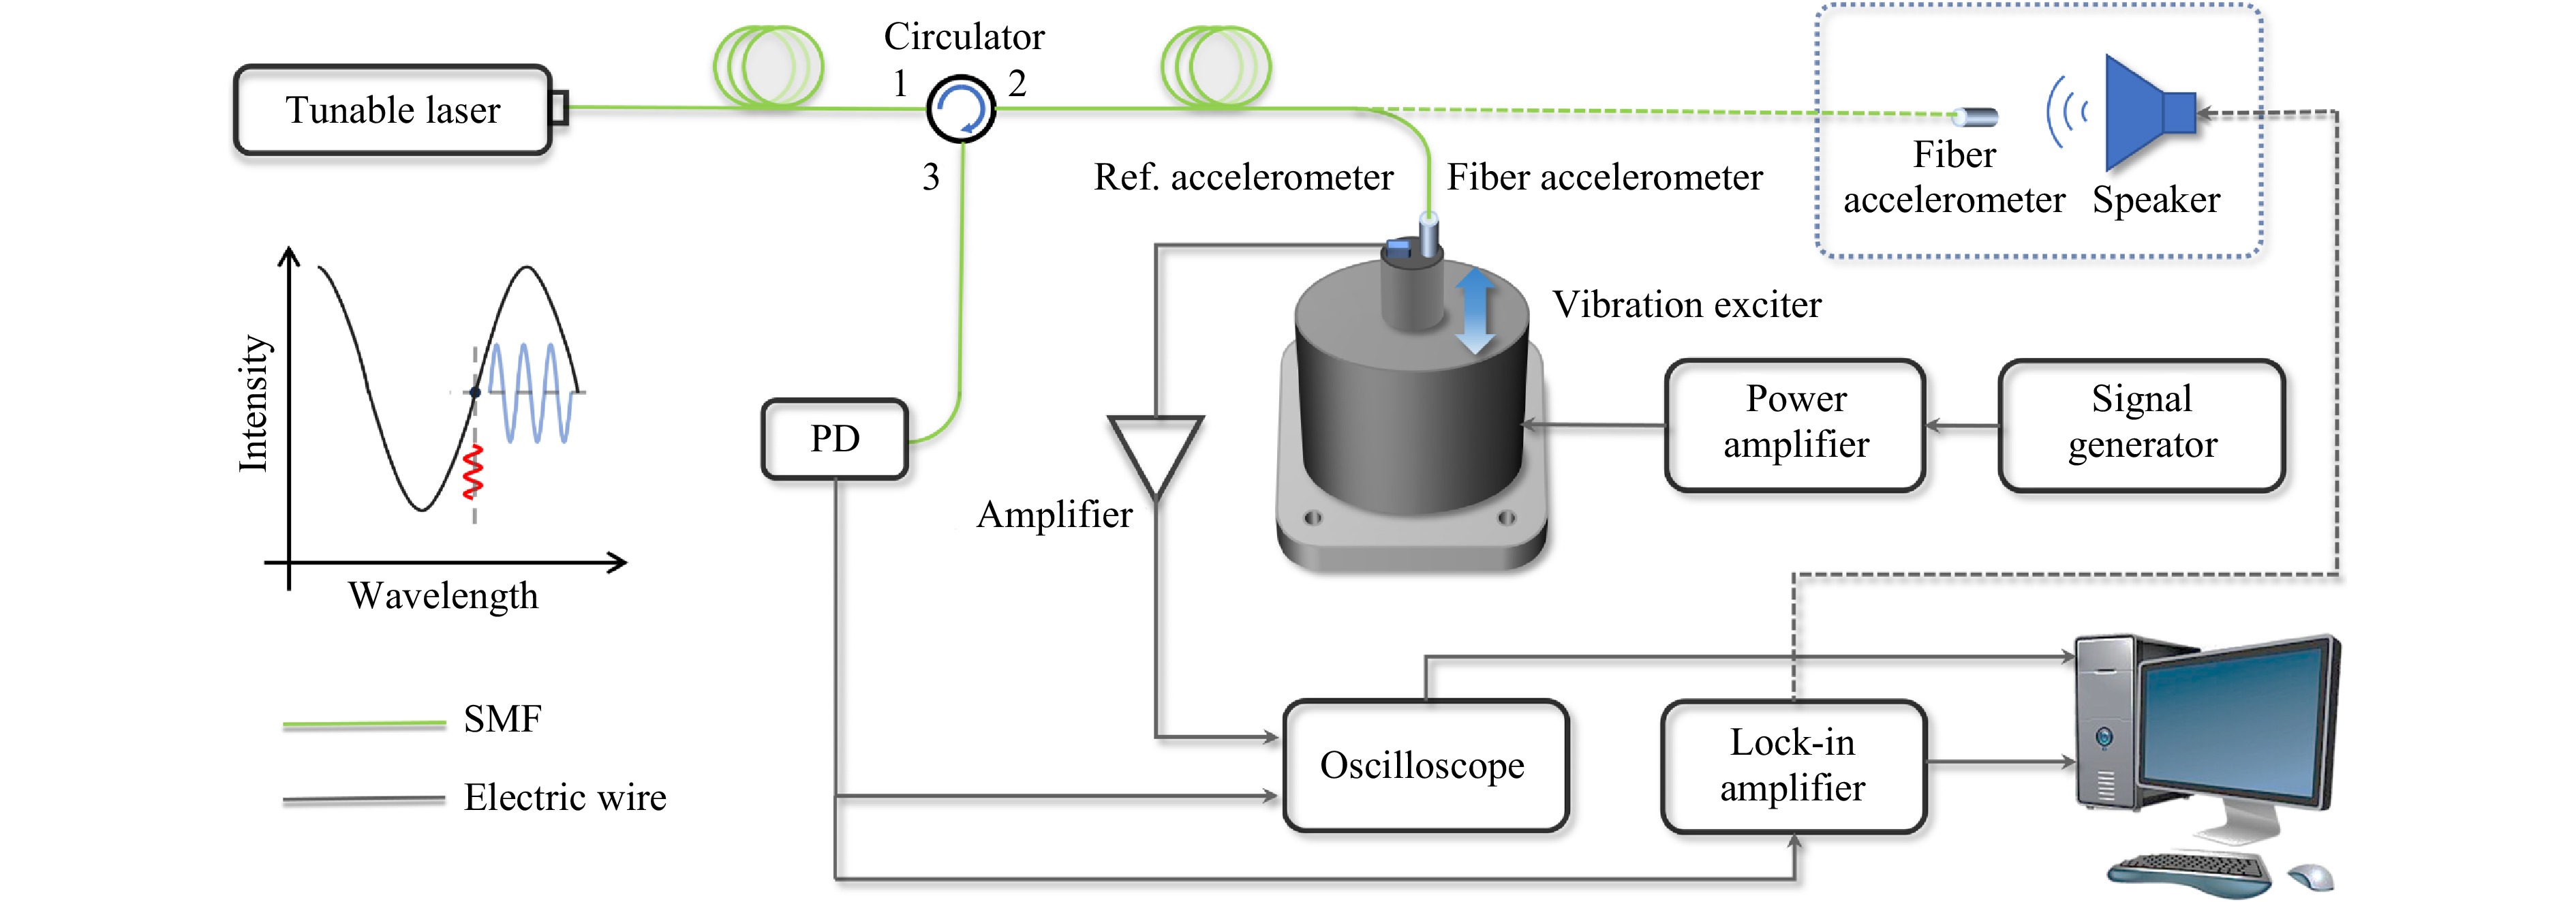
Fig. 4 Experimental setup for the test of responses of the fabricated optical fiber accelerometer. In the dashed part, a piezoelectric speaker was used for frequency response tests. A vibration exciter was used for acceleration tests.
Fig. 5 shows the test results for accelerometer 1. Fig. 5a, b show the measured power spectra of the output signals, whose time-domain signals are shown in the insets, when 1-g sinusoidal accelerations at frequencies of 100 and 2000 Hz, respectively, were applied to the accelerometer. It can be seen that the peak positions of the measured power spectra match exactly with the frequencies of the excitation accelerations, and their signal-to-noise ratios (SNRs) are as high as 60.8 and 67.1 dB, respectively. Given that the resolution bandwidth in the measurement is 50 Hz, the noise equivalent acceleration of the accelerometer at the frequency of 2000 Hz was calculated to be 62.45 μg/Hz by using the applied acceleration and the measured SNR23,34,35.
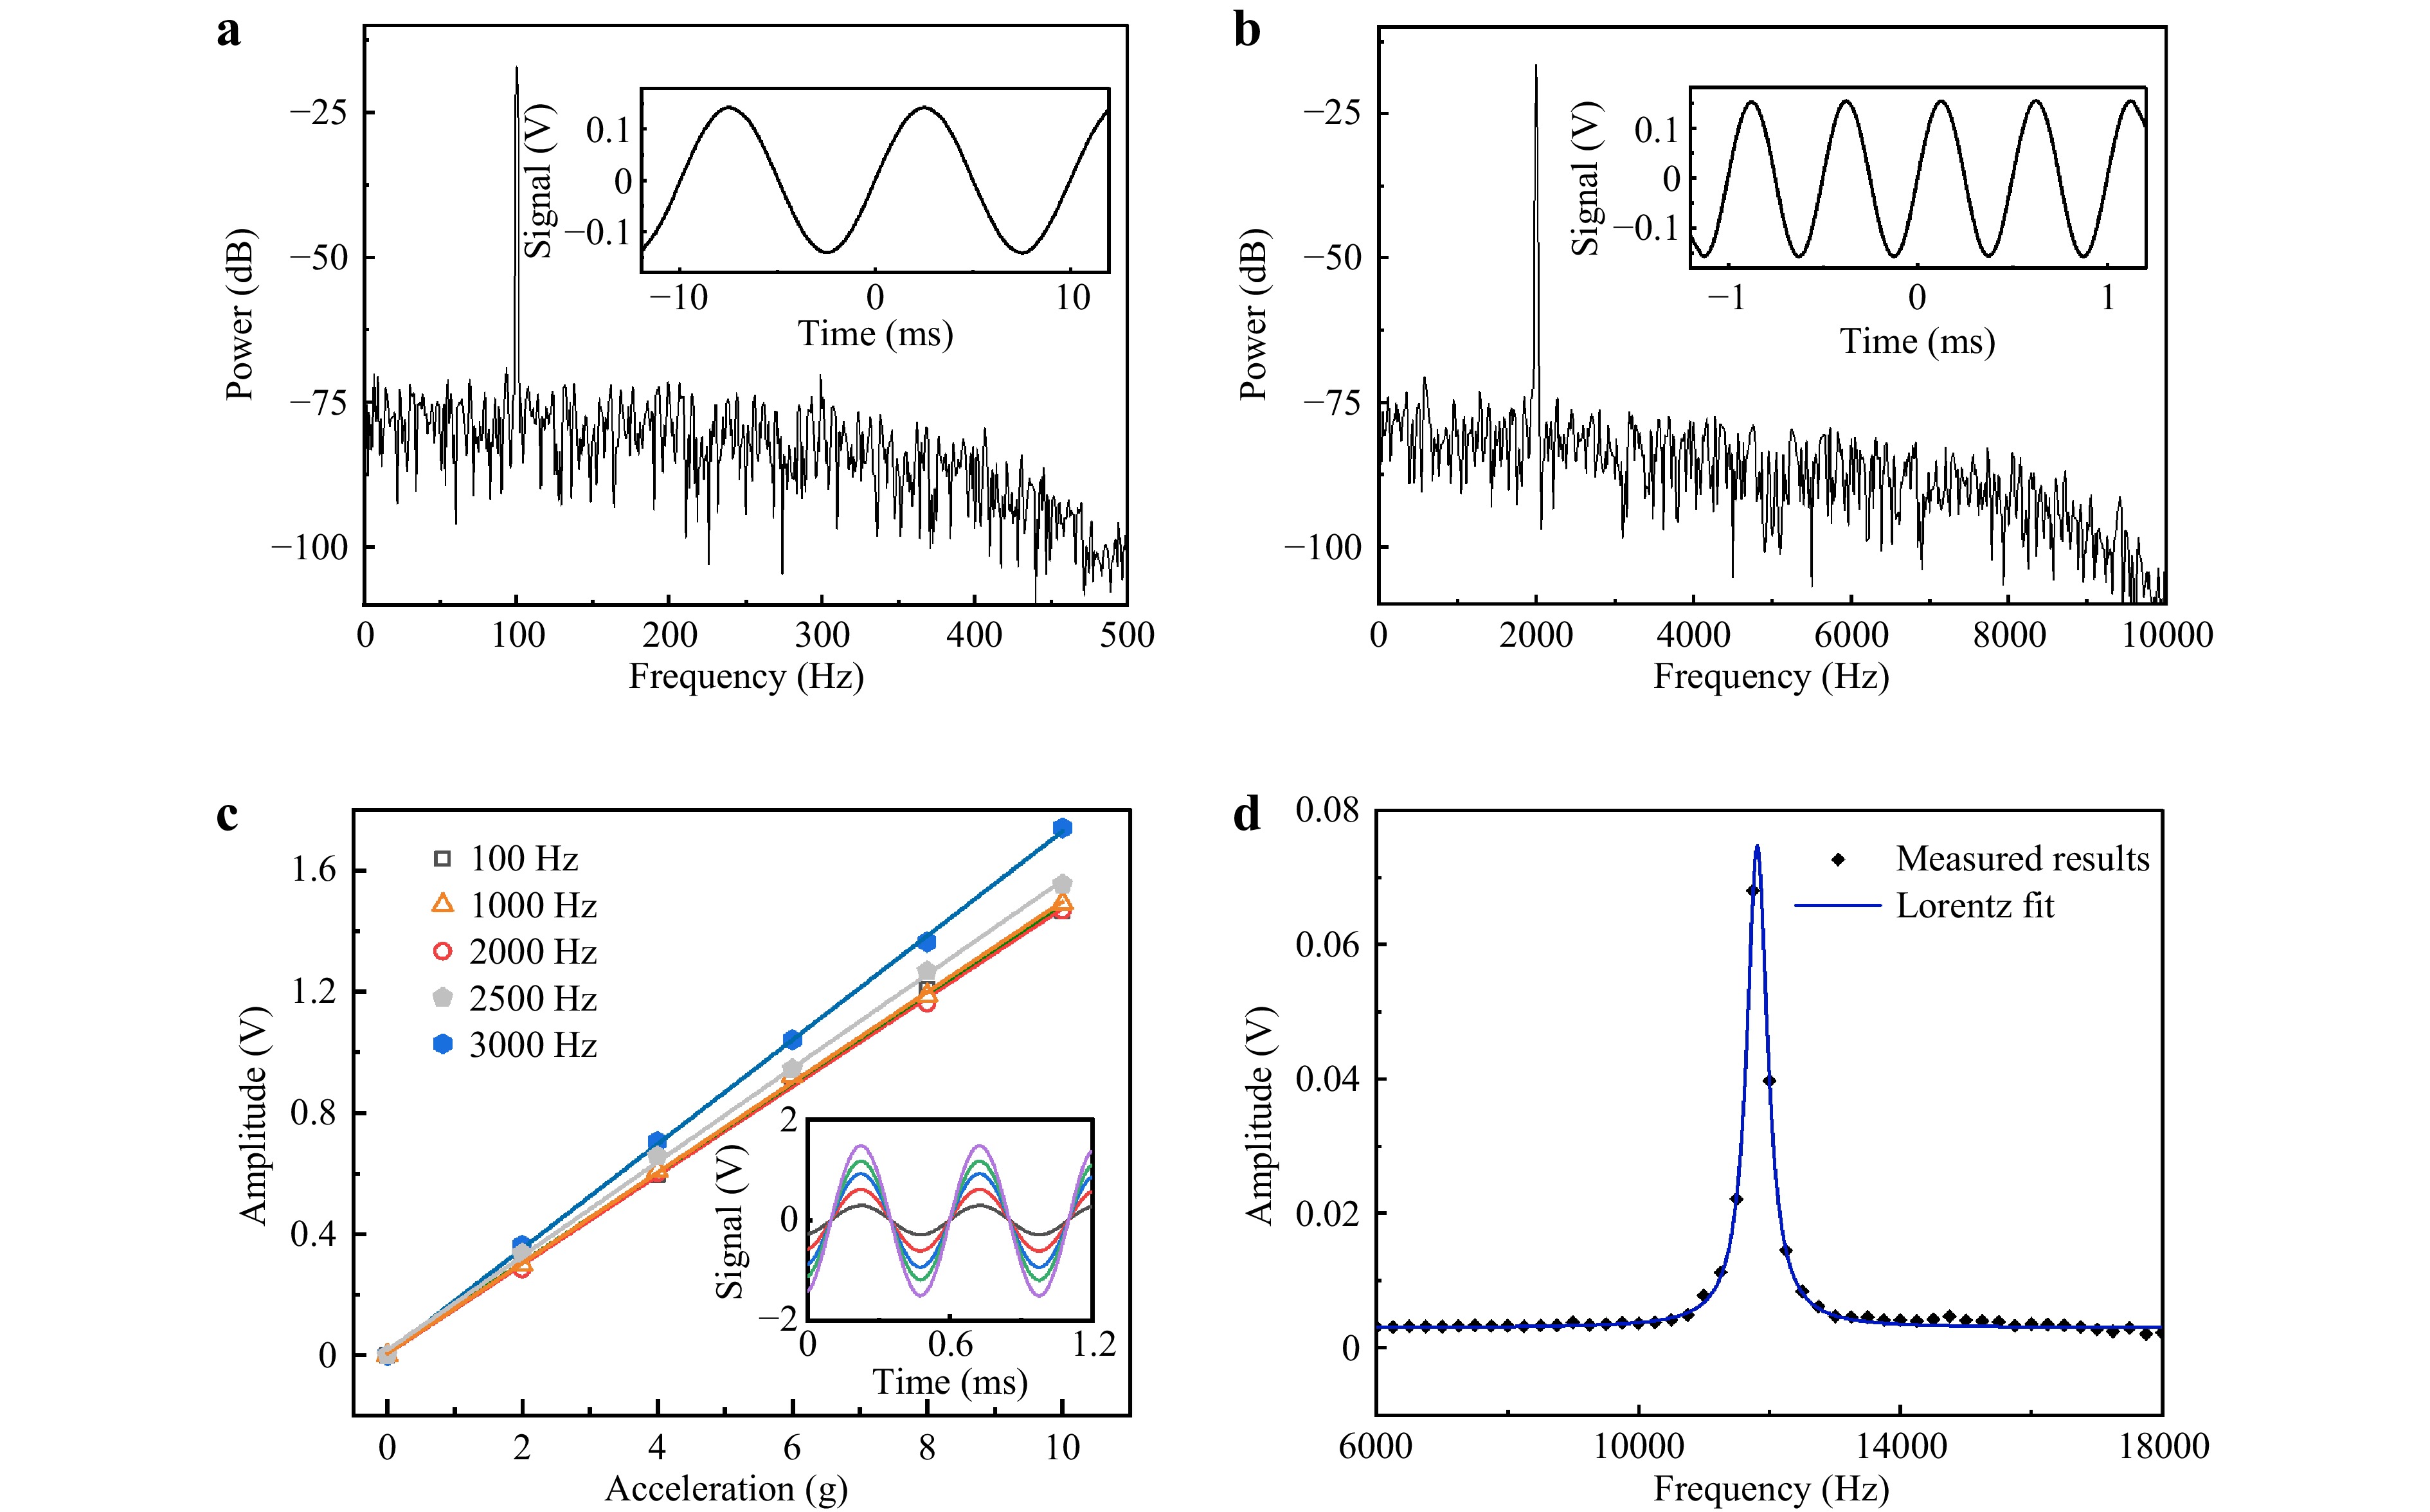
Fig. 5 Measured responses of the fabricated accelerometer 1. a and b Measured power spectra under 1-g acceleration at 100 and 2000 Hz, respectively. c Output signals versus the applied acceleration at 100, 1000, 2000, 2500, and 3000 Hz, respectively. The inset shows the measured output signals with respect to the accelerations varied from 2 to 10 g at 2000 Hz. d Measured frequency response in the range of 6000–18000 Hz.
Fig. 5c shows the measured signal amplitude versus applied acceleration at frequencies of 100, 1000, 2000, 2500, and 3000 Hz. The inset shows the measured signals of the accelerometer when the applied acceleration was varied from 2 to 10 g at a frequency of 2000 Hz. It is clearly seen that the sensor exhibits a linear response within the measurement range. The sensitivities of the accelerometer at these frequencies are 147.82, 148.9, 147.92, 156.13, and 170.2 mV/g, respectively. The sensitivities at the first three frequencies are very close to each other, but increase at or above 2.5 kHz, which is believed to be influenced by the fundamental resonance of the accelerometer.
The frequency response of the accelerometer was measured using the acoustic wave excitation method. A piezoelectric speaker driven by a lock-in amplifier was used to generate acoustic waves for testing the accelerometer over a relatively wide frequency range, as indicated by the dashed part of Fig. 4. The measured frequency response of accelerometer 1 in the range of 6000-18000 Hz is shown in Fig. 5d. The figure shows that the peak resonant frequency of accelerometer 1 is approximately 12 kHz. The closer the frequency is to resonance, the higher the sensitivity of the accelerometer.
A comparison of the responses of the different accelerometer designs is presented in Fig. 6. Fig. 6a shows the measured frequency responses of the three accelerometers. Their peak resonant frequencies were 11.81, 13.82, and 16.06 kHz, respectively, which align very well with the simulation results and confirm the design flexibility of our accelerometer. Their 3-dB bandwidths are 0.39, 0.72, and 0.63 kHz, respectively, from which the mechanical Q factors of the fundamental vibration modes of all three accelerometers were deduced to be approximately 25.
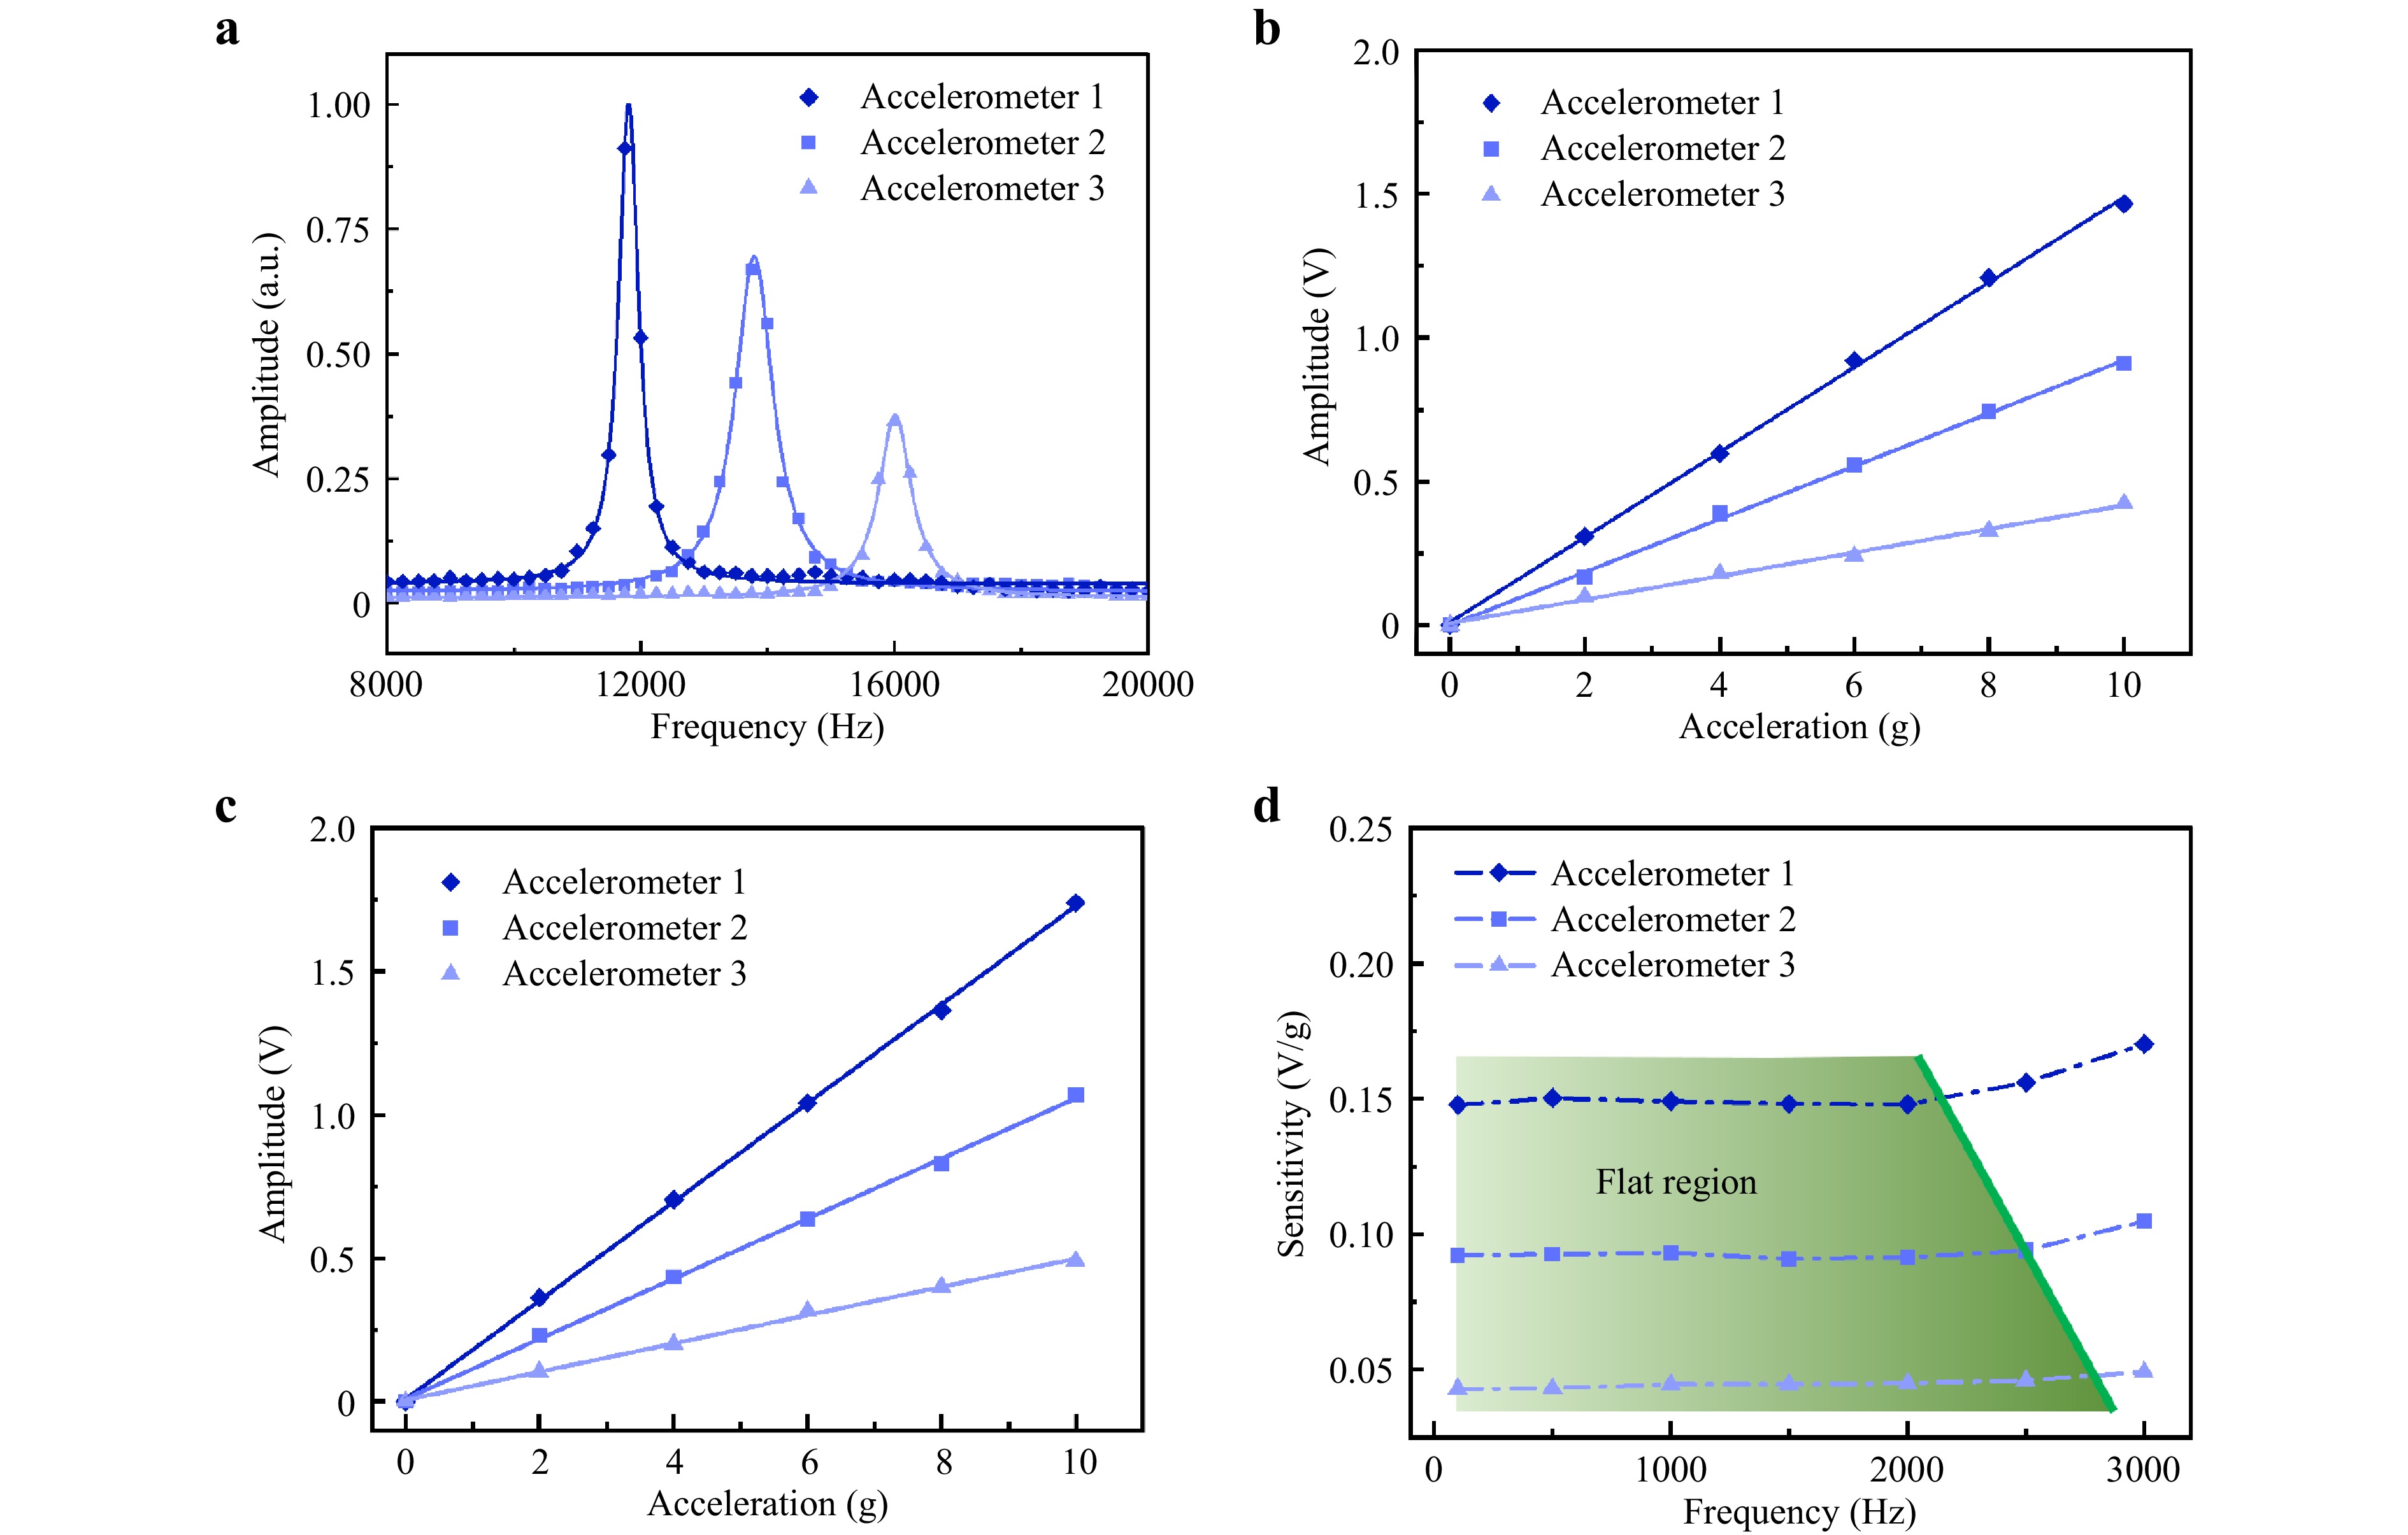
Fig. 6 a Measured frequency responses of the three designed accelerometers. b and c are the measured dependances of the accelerometer outputs on accelerations at the frequencies of 100 and 3000 Hz, respectively. d Measured dependances of the three accelerometer sensitivities on frequency.
Fig. 6b, c compare the responses of the three accelerometers to different accelerations at frequencies of 100 and 3000 Hz, respectively. All three accelerometers exhibited highly linear responses to changes in acceleration from 0 to 10 g. The goodness of fit for all the fitting lines (i.e., R2) was greater than 0.998. As expected, the sensitivities, represented by the slopes of the response lines, exhibited a proportional relationship with the length of the supporting microbeams. This indicates that the sensitivity of the designed accelerometer can be flexibly tailored by customizing the lengths of the supporting microbeams. Additional experimental data regarding the accelerometer responses at frequencies of 1000 and 2000 Hz are provided in Fig. S4 in Supplementary Information.
A detailed comparison of sensitivities is shown in Fig. 6d. Accelerometer 1 has a flat response (i.e., maintains nearly identical sensitivity) up to 2000 Hz, whereas the flat responses of accelerometers 2 and 3 extend to 2500 Hz and above 3000 Hz, respectively. On the other hand, accelerometer 1 exhibits the highest sensitivity, with a sensitivity of approximately 148.61 mV/g within the flat region, whereas the sensitivities of accelerometers 2 and 3 are 92.01 and 43.98 mV/g, respectively. Therefore, one may appropriately choose different geometric designs of the optical fiber accelerometer, particularly the supporting microbeams, to achieve either a high bandwidth or high sensitivity for various applications. A comparison of our accelerometers with other reported works is presented in Table S1, which shows that our optical fiber accelerometers offer advantages in terms of both miniature size and good performance in terms of resolution and bandwidth.
-
We presented a miniature optical fiber accelerometer based on a sub-millimeter-scale 3D microprinted ferrule-top FP microinterferometer. In-situ optical 3D microprinting technology was demonstrated to directly fabricate a 3D proof mass/thin-film reflector-integrated FP microinterferometer on the inherently light-coupled end face of a fiber optic ferrule for optical interferometric acceleration sensing. The experimental results revealed that the fabricated accelerometer could achieve a flat response over a bandwidth of 2–3 kHz. Its noise equivalent acceleration can be as low as 62.45 μg/Hz under 1-g acceleration at 2 kHz. This ultracompact optical fiber interferometric accelerometer offers advantages such as a small size, immunity to electromagnetic interference, remote sensing ability, and high customizability, making it very promising for many applications with stringent requirements.
-
This work was supported by a grant from the Research Grants Council of Hong Kong SAR, China (Grant No. 15213522).
Miniature optical fiber accelerometer based on an in-situ 3D microprinted ferrule-top Fabry–Pérot microinterferometer
-
Peng Wang1,
 ,
, - Taige Li1,
- Htein Lin1,
- Pengcheng Zhao1,
- Shangming Liu1,
- Hwa-Yaw Tam1,
-
A. Ping Zhang1, 2, *, ,
- Light: Advanced Manufacturing 6, Article number: 18 (2025)
- Received: 30 May 2024
- Revised: 03 January 2025
- Accepted: 20 January 2025 Published online: 07 March 2025
doi: https://doi.org/10.37188/lam.2025.018
Abstract: Accelerometers are crucial sensors that measure acceleration resulting from motion or vibration. Compared with their electromechanical counterparts, optical accelerometers are widely regarded as the most promising technology for high-requirement applications. However, compact integration of various optical and mechanical components to create a miniature optomechanical microsystem for acceleration sensing remains a challenge. In this study, we present a miniature optical fiber accelerometer based on a 3D microprinted ferrule-top Fabry–Pérot (FP) microinterferometer. In-situ 3D microprinting technology was developed to directly print a sub-millimeter-scale 3D proof mass/thin-film reflector-integrated FP microinterferometer on the inherently light-coupled end face of a fiber optic ferrule. Experimental results demonstrate that the optical fiber accelerometer has a flat response over a bandwidth of 2 to 3 kHz and its noise equivalent acceleration is 62.45 μg/Hz under 1-g acceleration at 2 kHz. This ultracompact optical fiber interferometric accelerometer offers several distinct advantages, including immunity to electromagnetic interference, remote-sensing capability, and high customizability, making it highly promising for a variety of stringent acceleration-monitoring applications.
Research Summary
3D Microprinted Optical Fiber Interferometric Accelerometer
Accelerometer is an inertial sensor that measures the acceleration of motion. Compared with electromechanical counterparts, optical accelerometers are widely regarded as the most promising technology for high-requirement applications. However, it remains a challenge to compactly integrate optical and mechanical components to create a miniature optomechanical microsystem for acceleration sensing. Researchers from The Hong Kong Polytechnic University demonstrate a miniature optical fiber accelerometer based on a proof mass-integrated Fabry–Pérot (FP) microinterferometer that is directly in-situ 3D micro-printed on the end-face of a fiber-optic ferrule. It provides a new technique route to develop highly compact and sensitive optical accelerometers for high-precision acceleration monitoring in complex environments and confined spaces.
Rights and permissions
Open Access This article is licensed under a Creative Commons Attribution 4.0 International License, which permits use, sharing, adaptation, distribution and reproduction in any medium or format, as long as you give appropriate credit to the original author(s) and the source, provide a link to the Creative Commons license, and indicate if changes were made. The images or other third party material in this article are included in the article′s Creative Commons license, unless indicated otherwise in a credit line to the material. If material is not included in the article′s Creative Commons license and your intended use is not permitted by statutory regulation or exceeds the permitted use, you will need to obtain permission directly from the copyright holder. To view a copy of this license, visit http://creativecommons.org/licenses/by/4.0/.

 DownLoad: