


-
Lithium-ion batteries (LIB) have attracted considerable attention as a new energy technology and have been widely used in energy storage systems, dominating the portable electronic products and electric vehicles markets1–3. However, in most applications, external factors such as pressure, vibration, temperature, overcharging, and discharging significantly impact the internal electrochemical behaviour of LIBs and may cause potentially hazardous phenomena such as thermal runaway (TR), which can lead to serious safety risks, including fire, explosion, or the release of toxic gases4,5. To reduce safety risks and economic losses, implementing early screening and warning strategies is essential for abnormal faults in LIBs.
Current LIB safety detection strategies entail monitoring parameters such as strain, temperature, gas concentration, and electrical characteristics6–9, playing crucial roles in detecting abnormal faults at different stages of the LIB lifetime. However, thermocouples and voltage or current measurements can only detect obvious battery failures when at least one cell is in a TR state. Moreover, detecting a gas venting event that occurs prior to the TR state using thermocouples and voltage measurements is challenging, because the working voltage remains stable, and the location of the temperature increase is usually unknown9. On the other hand, gas sensors can detect battery failures approximately 7–8 min prior to TR by monitoring gas emission, enabling earlier detection of battery failure compared to temperature, voltage, and current measurements10,11.
Trace amounts of electrolyte vapour leakage can be considered an early symptom of LIB damage9. The electrolyte mixture used in LIBs typically contains volatile carbonate-based organic solvents that can be detected using volatile organic compound (VOC) sensing technology, helping achieve rapid and early warning of LIB failure at room temperature5,12. VOC detection by gas chromatography-mass spectrometry has high sensitivity and selectivity in the parts per trillion range; however, its application is constrained by complex calibration operations and the need for off-site testing13. To overcome these limitations, alternative VOC sensing technologies have been proposed, such as quartz crystal microbalances14, and electrochemical gas sensors15, thermal conductivity gas sensors16, and metal oxide semiconductor gas sensors17. However, quartz-crystal microbalances are not suitable for rapid detection despite their high sensitivity, electrochemical gas sensors are limited by zero drift and aging, thermal conductivity gas sensors exhibit good operational stability but suffer from low sensitivity and poor detection accuracy, and metal oxide semiconductor gas sensors are easily influenced by environmental factors, such as high temperature and humidity. Overall, the aforementioned techniques are limited by electromagnetic interference, extreme working environments, and low sensitivity, rendering them unsuitable for in situ trace detection of VOCs from LIBs.
In recent years, optical fibre sensors have emerged as promising candidates in the field of VOC sensing due to minimal disturbance by environmental factors, and their compact size, high sensitivity, and short response time. As a result, these advancements have garnered significant attention and led to remarkable progress in the field18–21. Among these, external interferometers, such as the Mach-Zehnder interferometer (MZI), possess long interference arms that provide high sensitivity; however, they require complex demodulation methods and devices, making them large and expensive22. Moreover, the Fabry-Pérot interferometer is insensitive to the refractive index (RI) of reflecting surfaces and is unstable due to changes in cavity length caused by various disturbances23. Various specialty optical fibres sense changes in RI induced by the interaction of light with matter. However, the vast majority do not generate a sufficiently strong evanescent field24,25, which limits sensitivity. Notably, MNF have a waist region diameter on the micro/nano scale, making them compact and facilitating both the coupling of external disturbances into the ultra-high evanescent field and the decoupling of disturbances through wavelength or intensity demodulation methods. Compared with other optical sensors, MNFs can detect the RI of the external environment with ultrahigh sensitivity owing to their high evanescent field22,26–28. In summary, considering the need for simple demodulation methods, high sensitivity, and low disturbance requirements for VOC sensing, MNFs are the most appropriate choice.
Despite their advantages, detecting trace amounts of VOCs poses a challenge for MNFs due to the weak modulation of the RI of air near the surface of the VOC sensor at ppm concentrations. Hence, VOC adsorbent materials are necessary as gas-sensitive layers to increase the VOC concentration on the sensor surface by several orders of magnitude. Typically, MNFs are functionalized to enhance their ability to detect specific substances. However, functionalized materials rely on weak van der Waals forces to interact with MNFs, which renders the materials on the fibre unstable owing to their small surface area and thickness. This instability leads to an uncontrollable and unpredictable final optical spectrum, making them unsuitable for stable measurements of LIBs29,30. Improving functionalization methods is necessary to enhance gas detection sensitivity. To date, a range of VOC sensitive materials have been reported, such as organic polymers31, carbon nanotubes32, zeolites33, metal oxides34, and metal–organic frameworks (MOFs)35. Among these materials, zeolitic imidazolate framework-8 (ZIF-8) exhibits exceptional adsorptivity for VOC gas molecules due to its porous properties. Furthermore, ZIF-8 can functionalize MNFs via in situ self-assembly through the formation of strong chemical bonds. Thus, ZIF-8 is a promising candidate for VOC adsorption and offers a potential solution for increasing the effective RI of the sensitive surface layer of MNFs36.
In this study, a high-sensitivity LIB sensor has been proposed and demonstrated to warn LIB faults at an early stage of electrolyte leakage through VOC sensing. The sensor utilizes MNFs as the substrate, onto which a controlled, in situ self-assembled ZIF-8 membrane was deployed as the sensitive layer; the proposed sensor is referred to as MNFs*ZIF. The performance of MNFs *ZIF under various concentrations of LIB electrolyte components was measured and calibrated with high sensitivity and fast response time through wavelength demodulation. In addition, MNFs*ZIF was employed for online leakage monitoring of LIBs under working conditions for the first time, providing early warning prior to the load ceasing. The proposed LIB sensor can provide high sensitivity and stable detection of VOCs, as well as a fast response to LIB electrolyte leakage, illustrating its potential application in the early warning of faulty LIBs in various commercial products, such as electric cars.
-
The schematic diagram of the LIB leakage and ZIF-8 adsorption processes is shown in Fig. 1a. The MNFs*ZIF was suspended on a bracket at the top of the chamber, together with the LIB cell located at the bottom. Input and output optical signals were transmitted through single-mode optical fibre (SMF) patch cords and flanges on the chamber. When the LIB fails, traces of electrolyte leak and quickly evaporate into VOCs. A typical electrolyte vapor is dimethyl carbonate (DMC) vapor, which migrates towards the top of the chamber and is adsorbed within the ZIF-8 pores. The MNFs, functioning as mode interference MZIs, are coated with an in situ self-assembled ZIF-8 membrane. Given its large specific surface area and high porosity, DMC can be adsorbed by the ZIF-8 membrane, modulating the RI of the evanescent field in the MZI. DMC adsorption increases the external RI of the MNFs, resulting in a red-shift in the transmission spectrum. Conversely, desorption of VOCs induces a blue-shift, allowing for the determination of RI variation through wavelength demodulation.
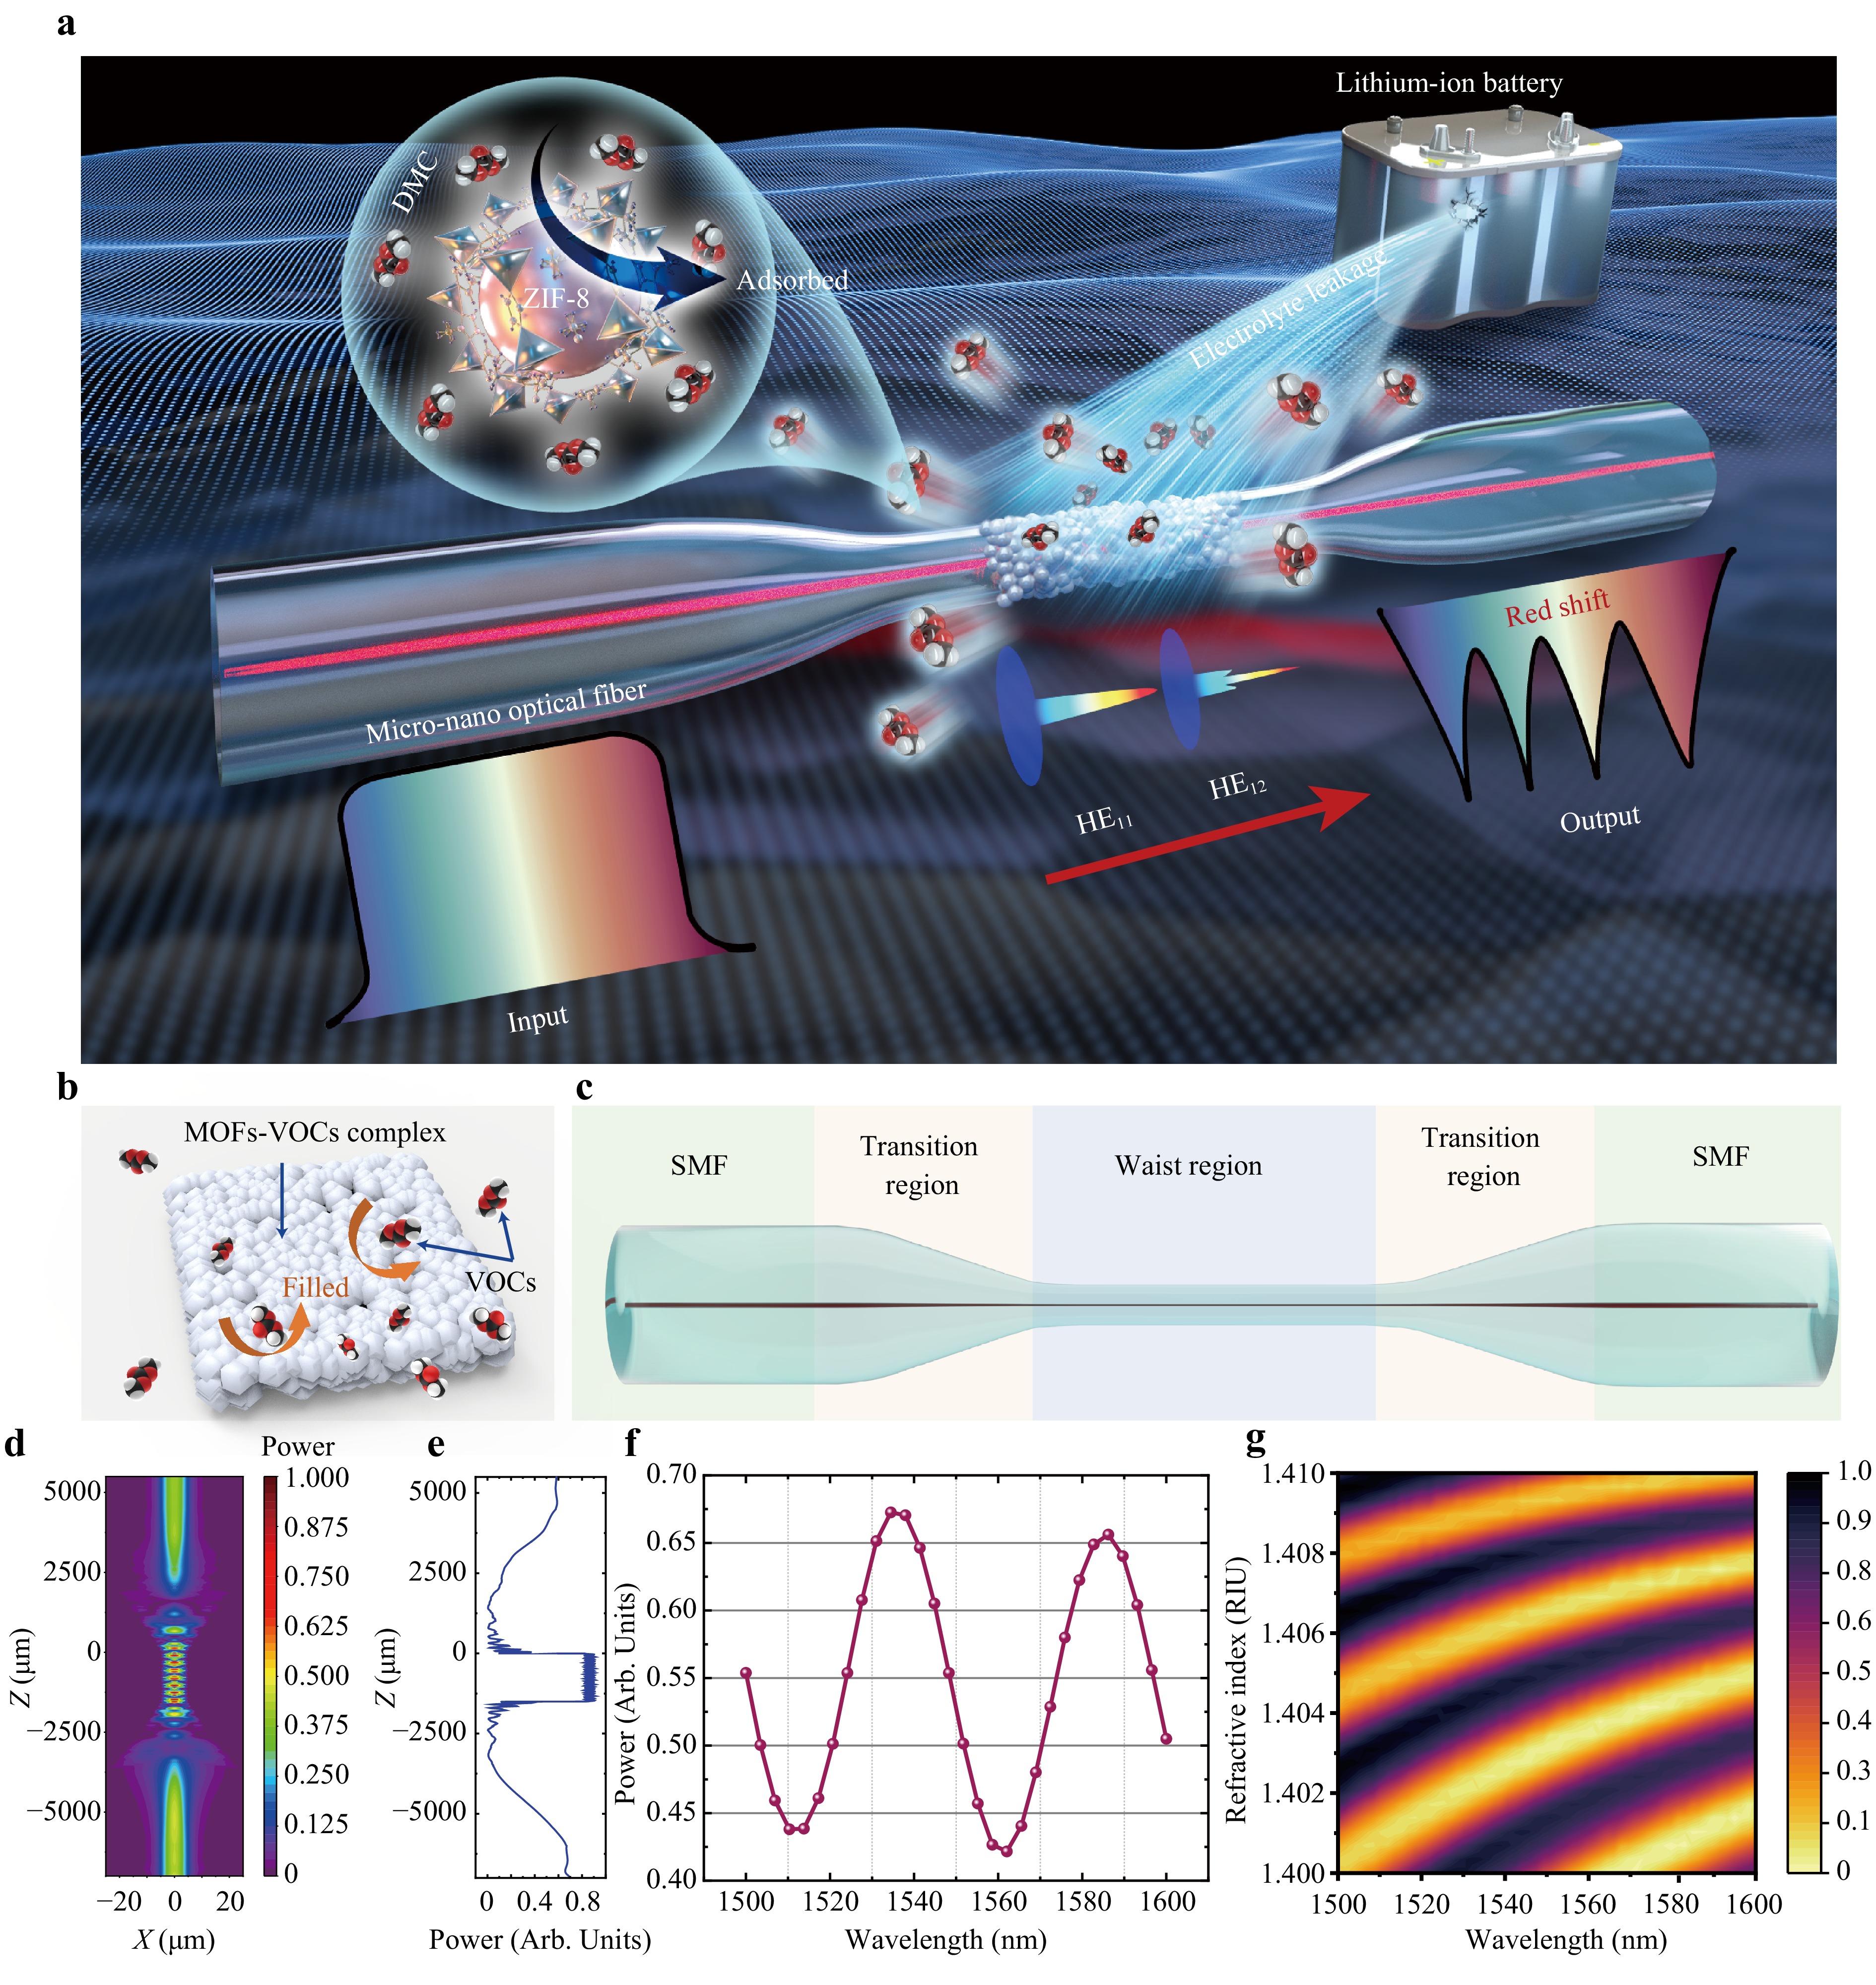
Fig. 1 Experimental concept and design principle. LIB electrolyte vapour detection by MNFs*ZIF. a Concept of electrolyte detection in LIBs using ZIF-8 membrane-coated MNFs; small quantities of electrolyte leaked from LIBs evaporates, generating gaseous DMC molecules, which causes a red-shift in the transmission spectrum of DMC observed by MNFs*ZIF. b Schematic of microporous MOFs filled with VOCs to modulate the RI of the MOF-VOC complex. c Typical structural diagram of MNFs, including G.652 SMF, with the transition region featuring a steep taper assigned to the exciting HE12 mode, and the waist region, several micrometers in diameter, where interference between HE12 and HE11 occurs. d Intensity contour map of light propagation along MNFs*ZIF, simulated using Rsoft, where the fundamental mode is set as the launch light field, the monitored path represents the fibre core, and the output observing target corresponds to the fibre base mode power in MNFs*ZIF, with the MNF modelled as an exponentially shaped transition region. Light is confined to the fibre core in the SMF region, resulting in leakage of light power into the cladding of the transition region. The modes of interference generate high-frequency power oscillations in the waist region. e Normalized power curve of the HE11 mode along the light propagation axis of MNFs*ZIF under the fundamental mode light field input. f Simulated transmission spectrum of MNFs*ZIF from 1500 to 1600 nm with a wavelength sampling point of 30. g Intensity contour map of the MNFs*ZIF transmission spectrum from 1400 to 1600 nm with a wavelength sampling point of 60, and the cladding RI ranging from 1.40–1.41 with a RI sampling point of 30.
For optical VOC sensors, determining how the volume fraction of the target analyte in the MOF film alters the effective RI of the MOF-VOC complex is crucial, as shown in Fig. 1b. This relationship can be described by the following general equation for the RI of microporous substrates filled with a fluid analyte37:
$$ n = \sqrt {({V_{{\text{s}}ub}}n_{sub}^2 + {V_a}n_a^2 + (1 - {V_{sub}} - {V_a})n_{vac}^2)} $$ (1) where Vsub and Va represent the volume fractions of the microporous substrate and fluid analyte, respectively, and nsub, na, nvac, and n represent the RI indices of the microporous substrates, fluid analyte, vacuum, and substrate-analyte complex, respectively. Given that the effective RI of the ZIF-8 membrane without the analyte (nzif) and filled with DMC vapour (ndmc-zif) is known, the volume fraction of DMC vapour in the ZIF-8 substrates (VDMC) can be expressed by a simplified equation:
$$ {V_{DMC}} = {{(n_{dmc - zif}^2 - n_{zif}^2)} \mathord{\left/ {\vphantom {{(n_{dmc - zif}^2 - n_{zif}^2)} {(n_{dmc}^2 - n_{vac}^2)}}} \right. } {(n_{dmc}^2 - n_{vac}^2)}} $$ (2) According to this relationship, the volume fraction of DMC vapour in the ZIF-8 substrate increases as DMC vapour is adsorbed by the ZIF-8 membrane, which macroscopically manifests as an increase in the effective RI of the ZIF-8 membrane37. A schematic of the MNF structure as sensing carriers for LIB monitoring is depicted in Fig. 1c. When the HE11 fundamental mode in a SMF is transmitted to tapered MNFs, the higher-mode HE12 is excited in the transition region and leaks into the cladding. Subsequently, mode coupling occurs between HE11 and HE12, allowing them to propagate together along the waist region until the energy is recoupled back into the SMF core through another symmetrical transition region, forming a mode interference MZI38. Due to the dual-mode interference in MNFs, the wavelength demodulation method is utilised instead of intensity demodulation, effectively improving sensing accuracy and detection range while avoiding interference caused by light source fluctuations.
As the RI of the ZIF-8 membrane surrounding the MNFs changes, distinct changes in the effective RIs of the two modes occur, resulting in a shift in the transmission spectrum that can be demodulated using the wavelength demodulation method. The RI sensitivity of MNFs can be characterised by the following relationship:
$$ S = {{d{\lambda _N}} / {dn}} = \left({\lambda _N}\frac{{\partial (\Delta {n_{ef f}})}}{{\partial {n_{S RI}}}}\right)\Bigg/ {\left(\Delta {n_{eff}} - {\lambda _N}\frac{{\partial (\Delta {n_{eff}})}}{{\partial {\lambda _N}}}\right)} $$ (3) where $ G = \Delta {n_{ef f}} - {\lambda _N}\left( {{{\partial (\Delta {n_{ef f}})} / {\partial {\lambda _N}}}} \right) $ is the group effective RI difference between the HE11 and HE12 modes, representing the dispersion characteristics of the MNFs. Since the input wavelength is approximately 1550 nm, the impact of variation in λ can be neglected. Therefore, the RI sensitivity of MNFs is primarily determined by G, $ {\mathrm{\lambda }}_{\mathrm{N}} $, and $ {{\partial (\Delta {n_{ef f}})}/ {\partial {\lambda _N}}} $39.
To study the optical properties of the proposed MNFs*ZIF sensor, a simulation based on Rsoft was conducted. A MNF with waist diameter of 7 μm was selected to balance sensitivity and robustness. The thickness of the ZIF-8 membrane was set to 500 nm to optimize sensitivity while minimizing extinction in the transmission spectrum. The RI of ZIF-8 was estimated to be 1.4, according to previous reports39.
The simulation results are displayed in Fig. 1d–g. The intensity of light propagation through the MNF is shown in Fig. 1d, while Fig. 1e illustrates the optical power of the HE11 mode monitored along the MNFs, revealing the power oscillation phenomenon caused by mode coupling in the waist region. To obtain the theoretical transmission spectrum, the input wavelength was scanned from 1500 to 1600 nm, as shown in Fig. 1f. Assuming that the cladding material of the MNFs is ZIF-8 and that the RI variation of the cladding ZIF-8 is +0.1 RIU due to the adsorption of DMC vapor, the results indicate a red-shift of several thousand nanometres, as depicted in Fig. 1g. This observation confirms that the MNFs*ZIF sensor has an RI sensitivity of 24166.3 nm/RIU when the MNF cladding material is a ZIF-8 membrane with a RI of 1.4. Therefore, the simulation results indicate that the MNFs*ZIF sensor possesses ultrahigh theoretical RI sensitivity, capable of meeting the requirements for detecting trace VOC concentrations.
-
MNFs were fabricated by rapidly drawing melted SMF using a hydrogen-oxygen flame. A schematic of the MNF fabrication system is depicted in Fig. 2a. An MNF with a uniform waist region diameter of 7 μm and a smooth surface was obtained using a hydrogen flow of 85 mL·min–1 and a distance of 4.5 mm between both the motorized stages, with a drawing speed of 0.15 mm·s–1.
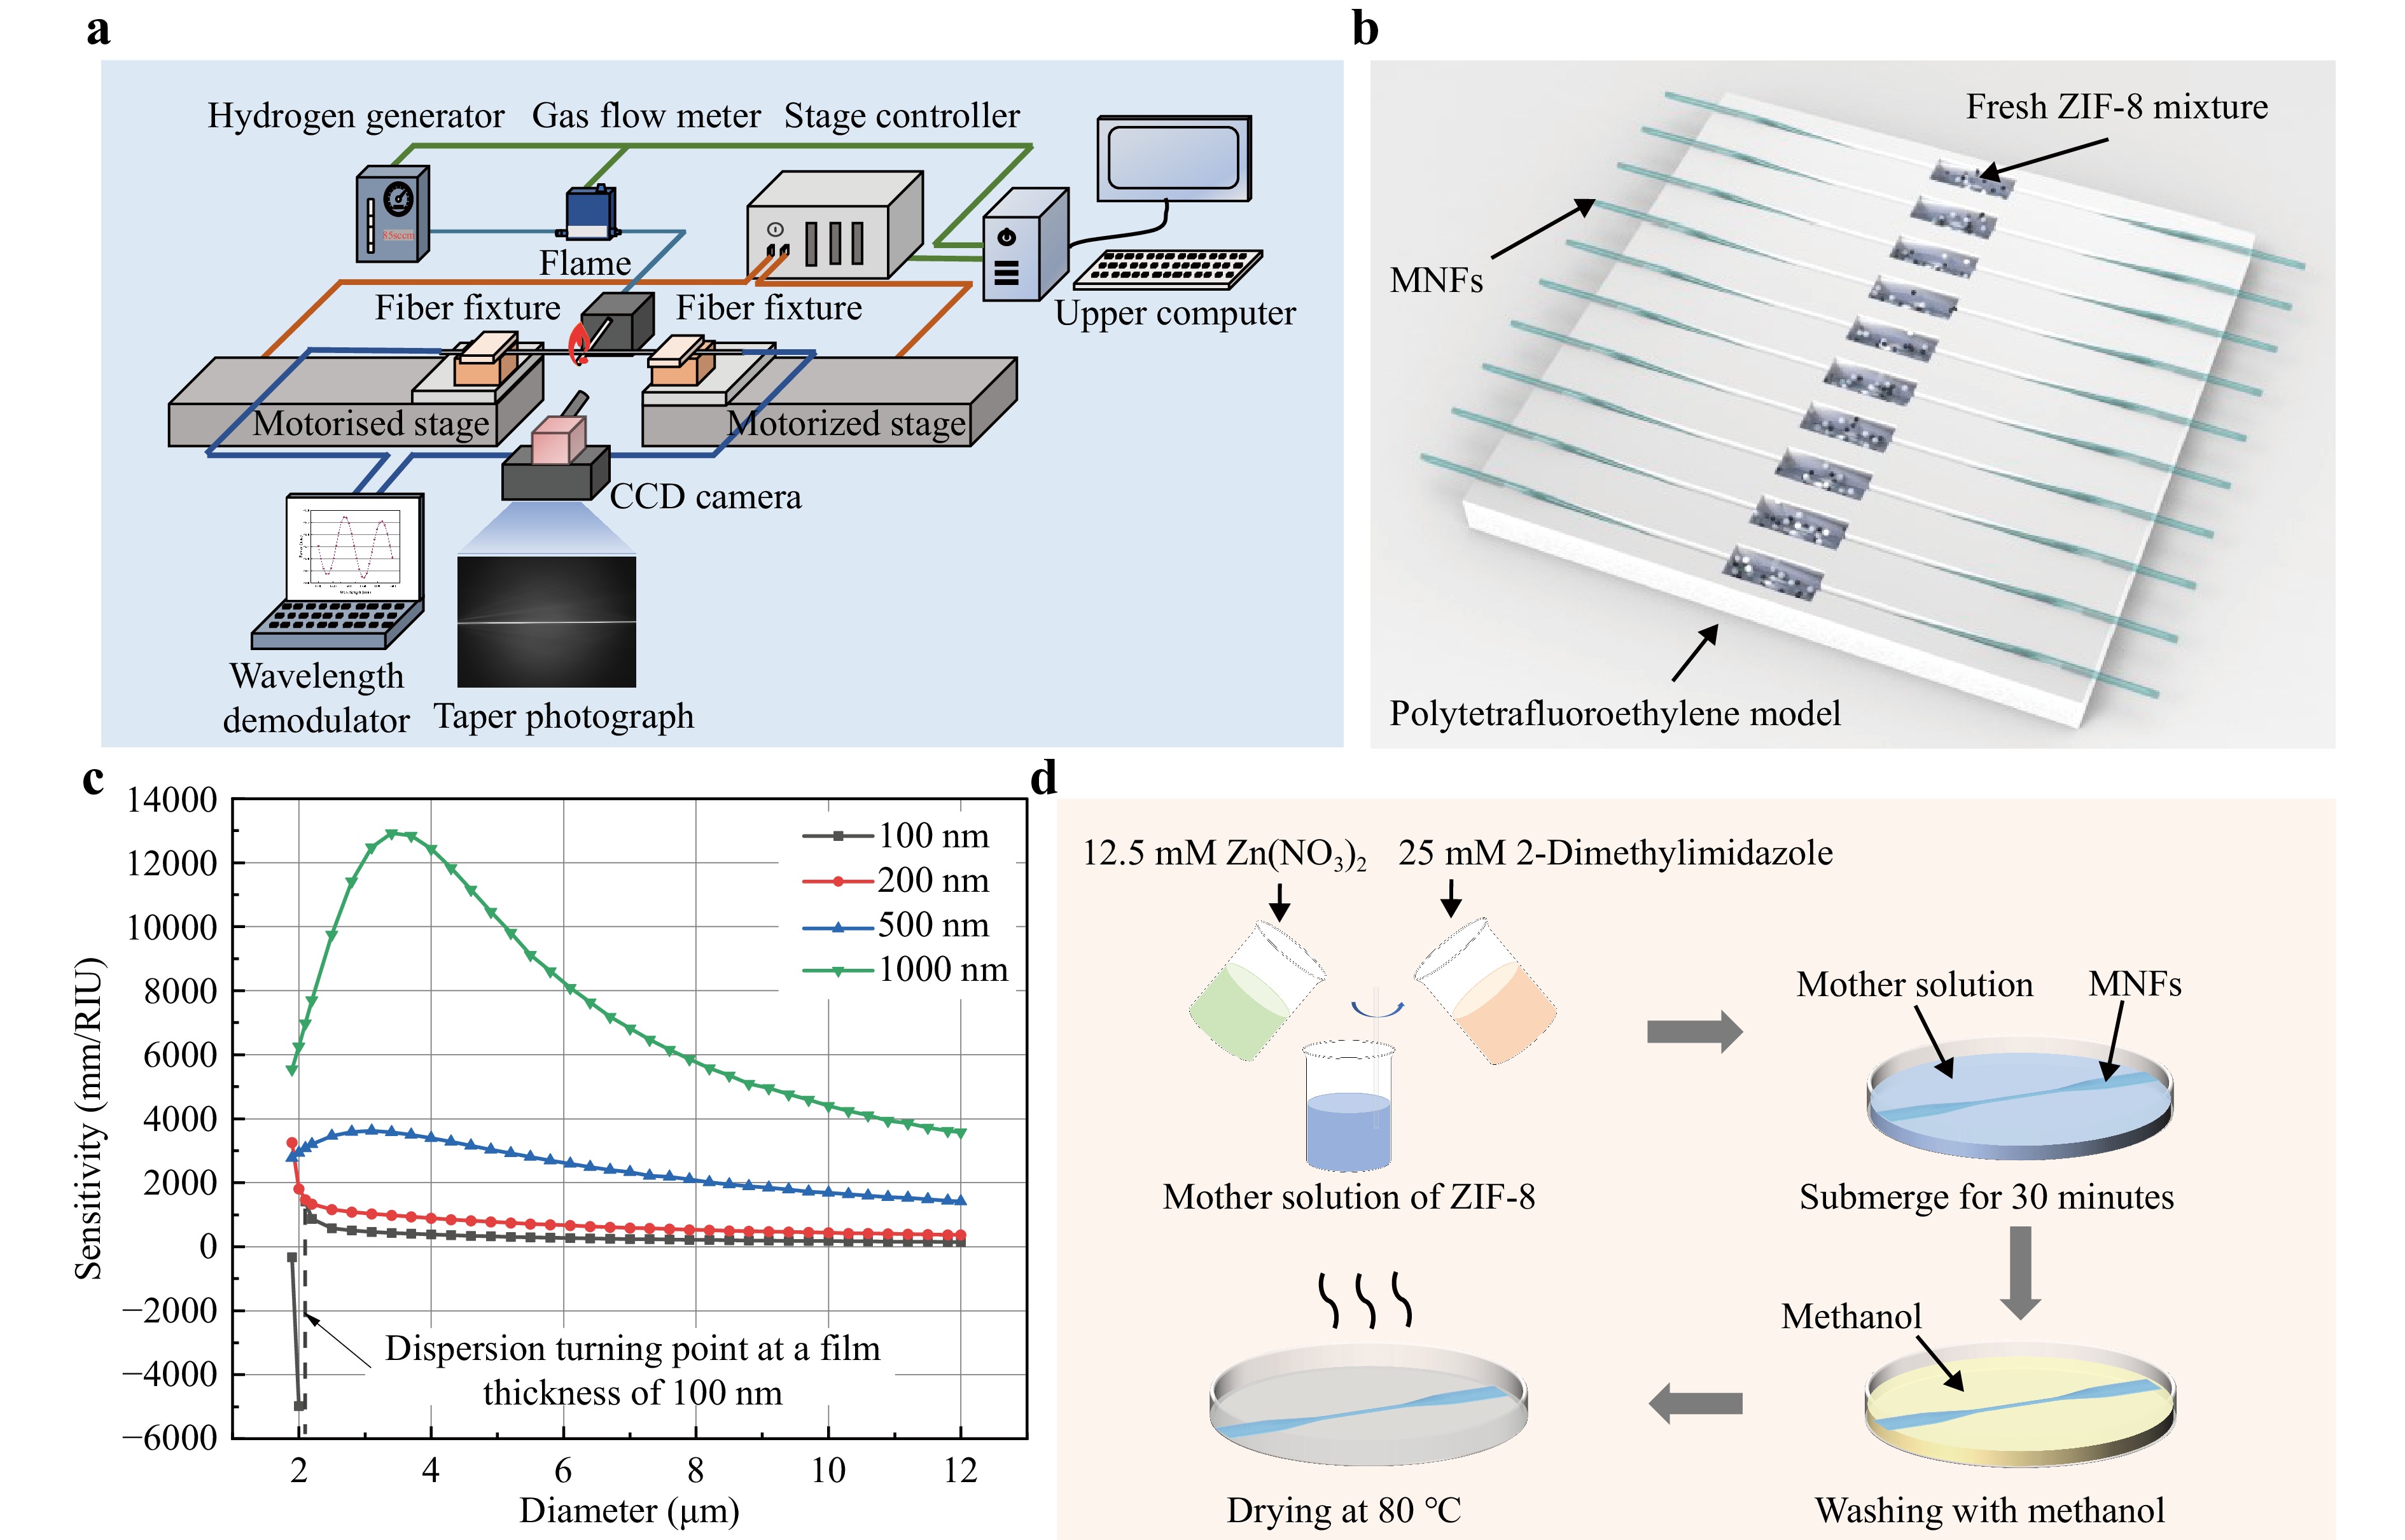
Fig. 2 Methods for fabrication and ZIF-8 functionalization of the MNFs*ZIF sensor. a Schematic of the MNF fabrication system. This system employs a wavelength demodulator to select the required transmission spectrum, while a CCD camera ensures that the fiber remains aligned along the same axis during the stretching process, facilitating real-time observation of the tapering process. b Schematic of ZIF-8 in-situ self-assembly on the MNFs within a polytetrafluoroethylene model. This model supports the fabrication of up to 10 MNFs*ZIF from the same batch, with each solution container having a volume of 1.5 mL. The waist region of the MNFs is suspended and clamped in the model, where in-situ ZIF-8 self-assembly, cleaning with a methanol solution, and vacuum drying are performed to ensure the stability of the adhered ZIF-8 on the MNF. c Relationship between sensitivity, film thickness, and diameter; the selected parameters for the MNFs*ZIF include a 7 μm diameter MNF modified with a 500 nm thick ZIF-8 film, based on a comprehensive analysis of sensitivity enhancement and sensor robustness. d Depiction of one in situ ZIF-8 self-assembly cycle on the MNF substrate at room temperature; each step is conducted within the model without transferring the MNFs, and the mother solution is mixed in a 1:1 volume ratio, with equal amounts injected into each model container.
To enhance the sensitivity of the MNFs to DMC vapor, an in situ self-assembled ZIF-8 membrane was coated onto the MNFs. ZIF-8 offers several advantages, including high stability, hydrophobicity, a highly regular pore structure, adjustable pore and cage sizes, and variable flexibility. The specific parameters deployed included a pore size of 3.4 nm, cage diameter of 11.6 nm, specific surface area of 1730 m2·g−1, and pore volume of 0.63 m3·g−1. The materials used in this process included zinc nitrate hexahydrate, 2-methylimidazole, methanol, and dimethyl carbonate, all of which were of analytical purity and used without further purification. Given that the waist diameter and evanescent field depth of the dual-mode interference MNFs were in the micrometer range, the thickness of the ZIF-8 film was preferably set to the micrometer range or below. This ensured efficient coupling between the change in RI of the ZIF-8 film and the evanescent field of the MNFs, while also supporting stable growth of the film on the MNFs substrate. The in situ self-assembly environment is illustrated in Fig. 2b, where the MNFs were fixed in the groove of a polytetrafluoroethylene model, keeping them straight and suspended to ensure that the waist region of the MNFs could be fully immersed in the central compartments for in situ self-assembly.
To analyse the optimised quantity and thickness of ZIF-8, a simulation was conducted using Comsol, setting the RI of ZIF-8 at 1.4. The MNF RI sensitivity was modified using ZIF-8 films with thicknesses of 100 nm, 200 nm, 500 nm, and 1 μm. As illustrated in Fig. 2c, although reducing the diameter of the MNFs can improve sensitivity, the diameter should not be too small to ensure the robustness of the sensor and fabrication success rate. In addition, a thicker ZIF-8 film resulted in increased responsiveness of the sensor but led to greater loss of the HE12 mode, decreasing the extinction ratio of the transmission spectrum. Therefore, after considering factors such as robustness, sensitivity, accuracy, and fabrication success rate, the optimal configuration was determined to be a 500 nm-thick ZIF-8 film modified onto 7 μm diameter MNFs, achieving a sufficiently high RI sensitivity of 2326 nm/RIU.
ZIF-8 films were grown in situ on the surface of MNFs through intermolecular hydrogen bonding interactions, affording stable gas-sensing materials. By optimising the crystallisation process, dense and highly crystalline ZIF-8 thin films were successfully generated on the MNFs. The in situ ZIF-8 self-assembly process is illustrated in Fig. 2d and can be described through the following steps: First, a 20 mL methanol solution containing 12.5 mM zinc nitrate hexahydrate was mixed with another 20 mL methanol solution containing 25 mM 2-methylimidazole and stirred at room temperature. The freshly prepared mixture was then transferred to containers, and the MNFs were submerged in the solution. After 30 min, the MNFs were thoroughly washed thrice with methanol and dried. This sequence of steps constitutes one in situ self-assembly cycle. Following four cycles of this process, the modified MNFs were dried in a vacuum oven at 80 °C overnight to yield the LIB sensor40. Due to the columnar molecular structure of ZIF-8, the material exhibits a greater capacity for adsorption compared to similar chain molecules41, indicating that the van der Waals forces between the VOCs from batteries and ZIF-8, along with the hydrogen bond acceptors capable of generating strong hydrogen bonds with ZIF-8, are relatively strong. However, cyclic gas molecules such as toluene face challenges in entering the ZIF-8 pores because of their larger molecular cross-sectional area. Smaller molecules, such as hydrogen, present a minor difference in RI compared to air, resulting in a low response in wavelength shift. In addition, non-polar molecules in the atmosphere, such as nitrogen and oxygen, lack entities capable of hydrogen bonding, leading to only weak interactions with ZIF-8. Consequently, sensors designed with this material demonstrate excellent selectivity and are largely immune to interference from other volatile compounds, including hydrogen, toluene, and nitrogen.
-
To further analyse the in situ self-assembled ZIF-8 membrane on the MNFs and verify the effective crystallisation in the waist region of the MNFs, the evolution of the transmission spectrum during the first three crystallisation cycles was monitored, as illustrated in Fig. 3. The results indicate that the extinction ratio of the transmission spectrum of MNFs decreases with an increasing number of crystallisation cycles, as shown in Fig. 3a–c. This decrease is attributed to the increase in optical loss of the HE12 mode, which occurs with the increasing thickness of the ZIF-8 membrane, leading to a greater power difference between the HE11 and HE12 modes. Additionally, the data reveal that the first crystallization cycle induced only a minor red-shift of 7.42 nm in the transmission spectrum. In contrast, the second and third growth cycles resulted in significant red-shifts of 47.34 nm and 40.18 nm, respectively, as depicted in Fig. 3d–e. These observations suggest that ZIF-8 underwent nucleation during the first crystallization cycle, forming a seed layer characterized by a slow growth rate. In subsequent cycles, particularly during the second and third cycles, the growth process accelerated, especially within the first 5 min. This monitoring of the transmission spectrum provides valuable information regarding crystal growth, thereby facilitating the controlled manufacturing of MNFs*ZIF sensors.
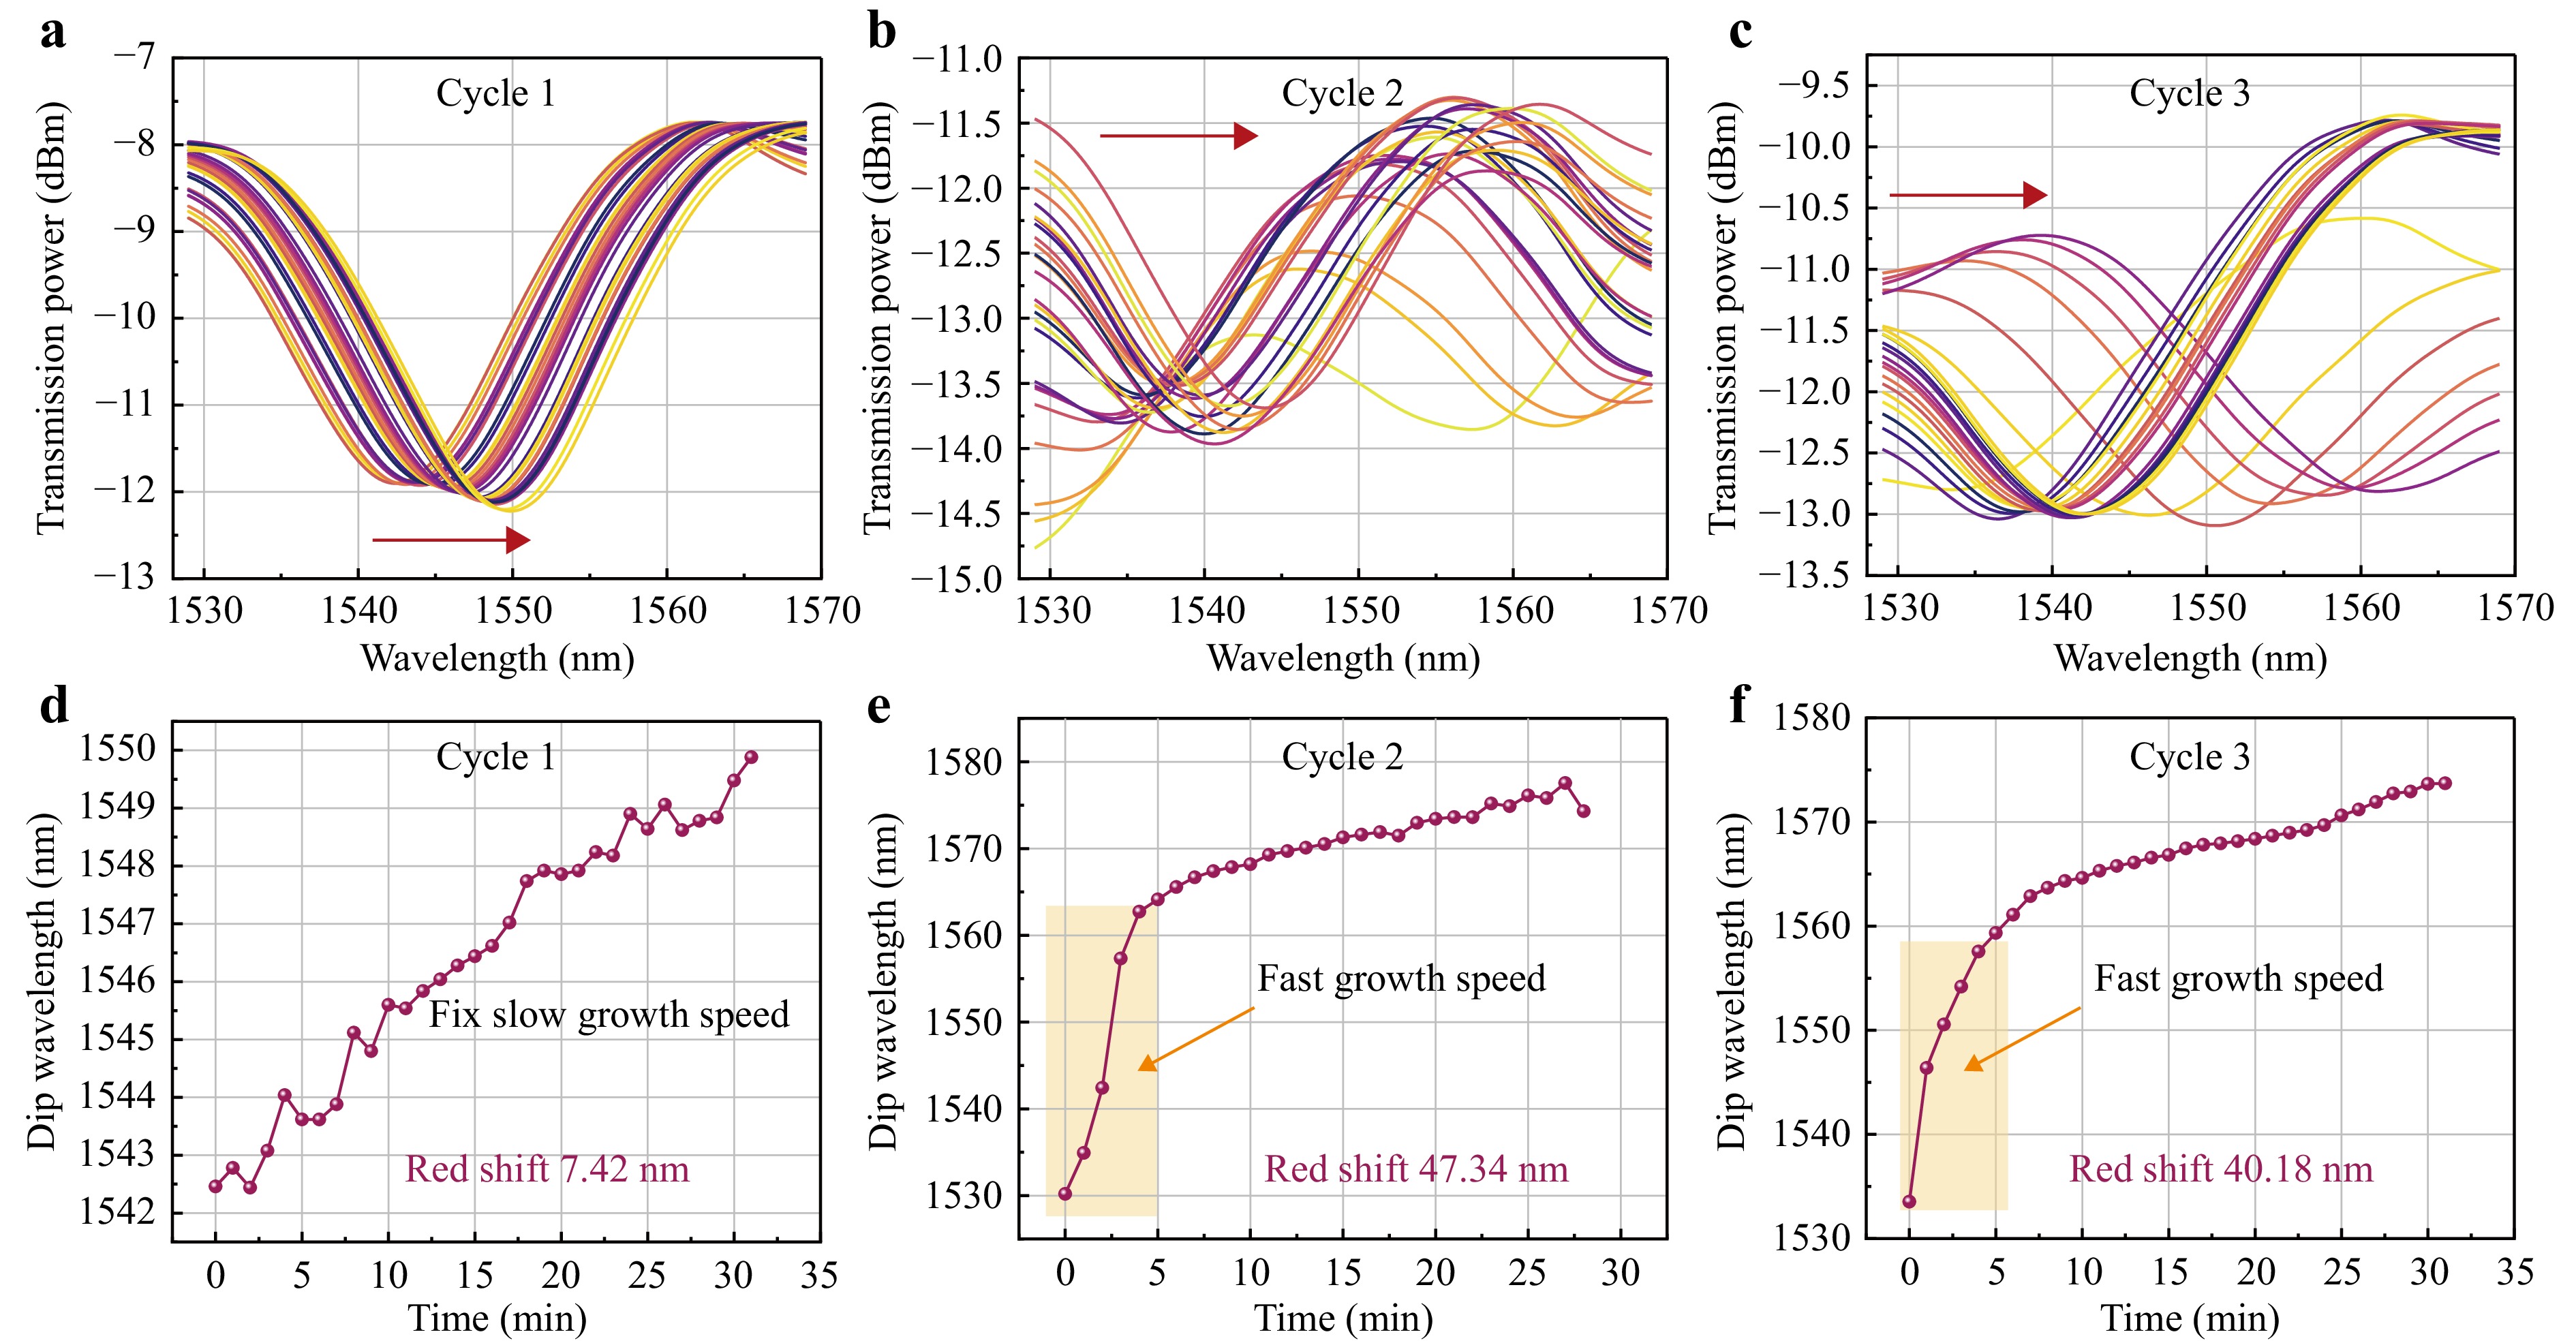
Fig. 3 In situ self-assembly process for ZIF-8 monitored by the transmission spectra of the MNFs during the first three growth cycles. The ZIF-8 was self-assembled in situ on the surface of bare MNFs layer by layer, with the transmission spectrum of the MNFs at a frequency of 1 min over approximately 30 min. a Evolution of the red-shift in the transmission spectrum recorded during the first growth cycle, with measurements taken after 32 min. b Evolution of the red-shift in the transmission spectrum recorded during the second growth cycle, with measurements taken after 29 min. c Evolution of the red-shift in the transmission spectrum recorded during the third growth cycle, with measurements taken after 32 min. d Curve of dip wavelength position during the first cycle of ZIF-8 growth, tracking the dip observed at approximately 1542 nm. e Curve of peak wavelength position during the second cycle of ZIF-8 growth, tracking the dip at approximately 1530 nm. f Curve of peak wavelength position during the third cycle of ZIF-8 growth, tracking the dip at approximately 1532 nm.
-
To analyse the crystallisation conditions for ZIF-8 on the surface of the MNFs, the ZIF-8 membranes were morphologically characterised before and after 1–4 cycles of in situ self-assembly, as depicted in Fig. 4. The waist region diameter of the bare MNFs was approximately 7 μm, exhibiting a smooth and uniform surface, as shown in the inset of Fig. 4a. Moreover, the size of the ZIF-8 crystals increased with the number of self-assembly cycles, resulting in a denser and more uniform ZIF-8 memberane. After four cycles of in situ self-assembly on bare MNFs, a ZIF-8 membrane with a thickness of 506 nm was achieved, as illustrated in Fig. S2, which aligns with the simulated value of ZIF-8 membrane thickness. Collectively, the SEM images show that ZIF-8 crystals were grown with regular particle morphologies, resulting in tight and thick membranes.
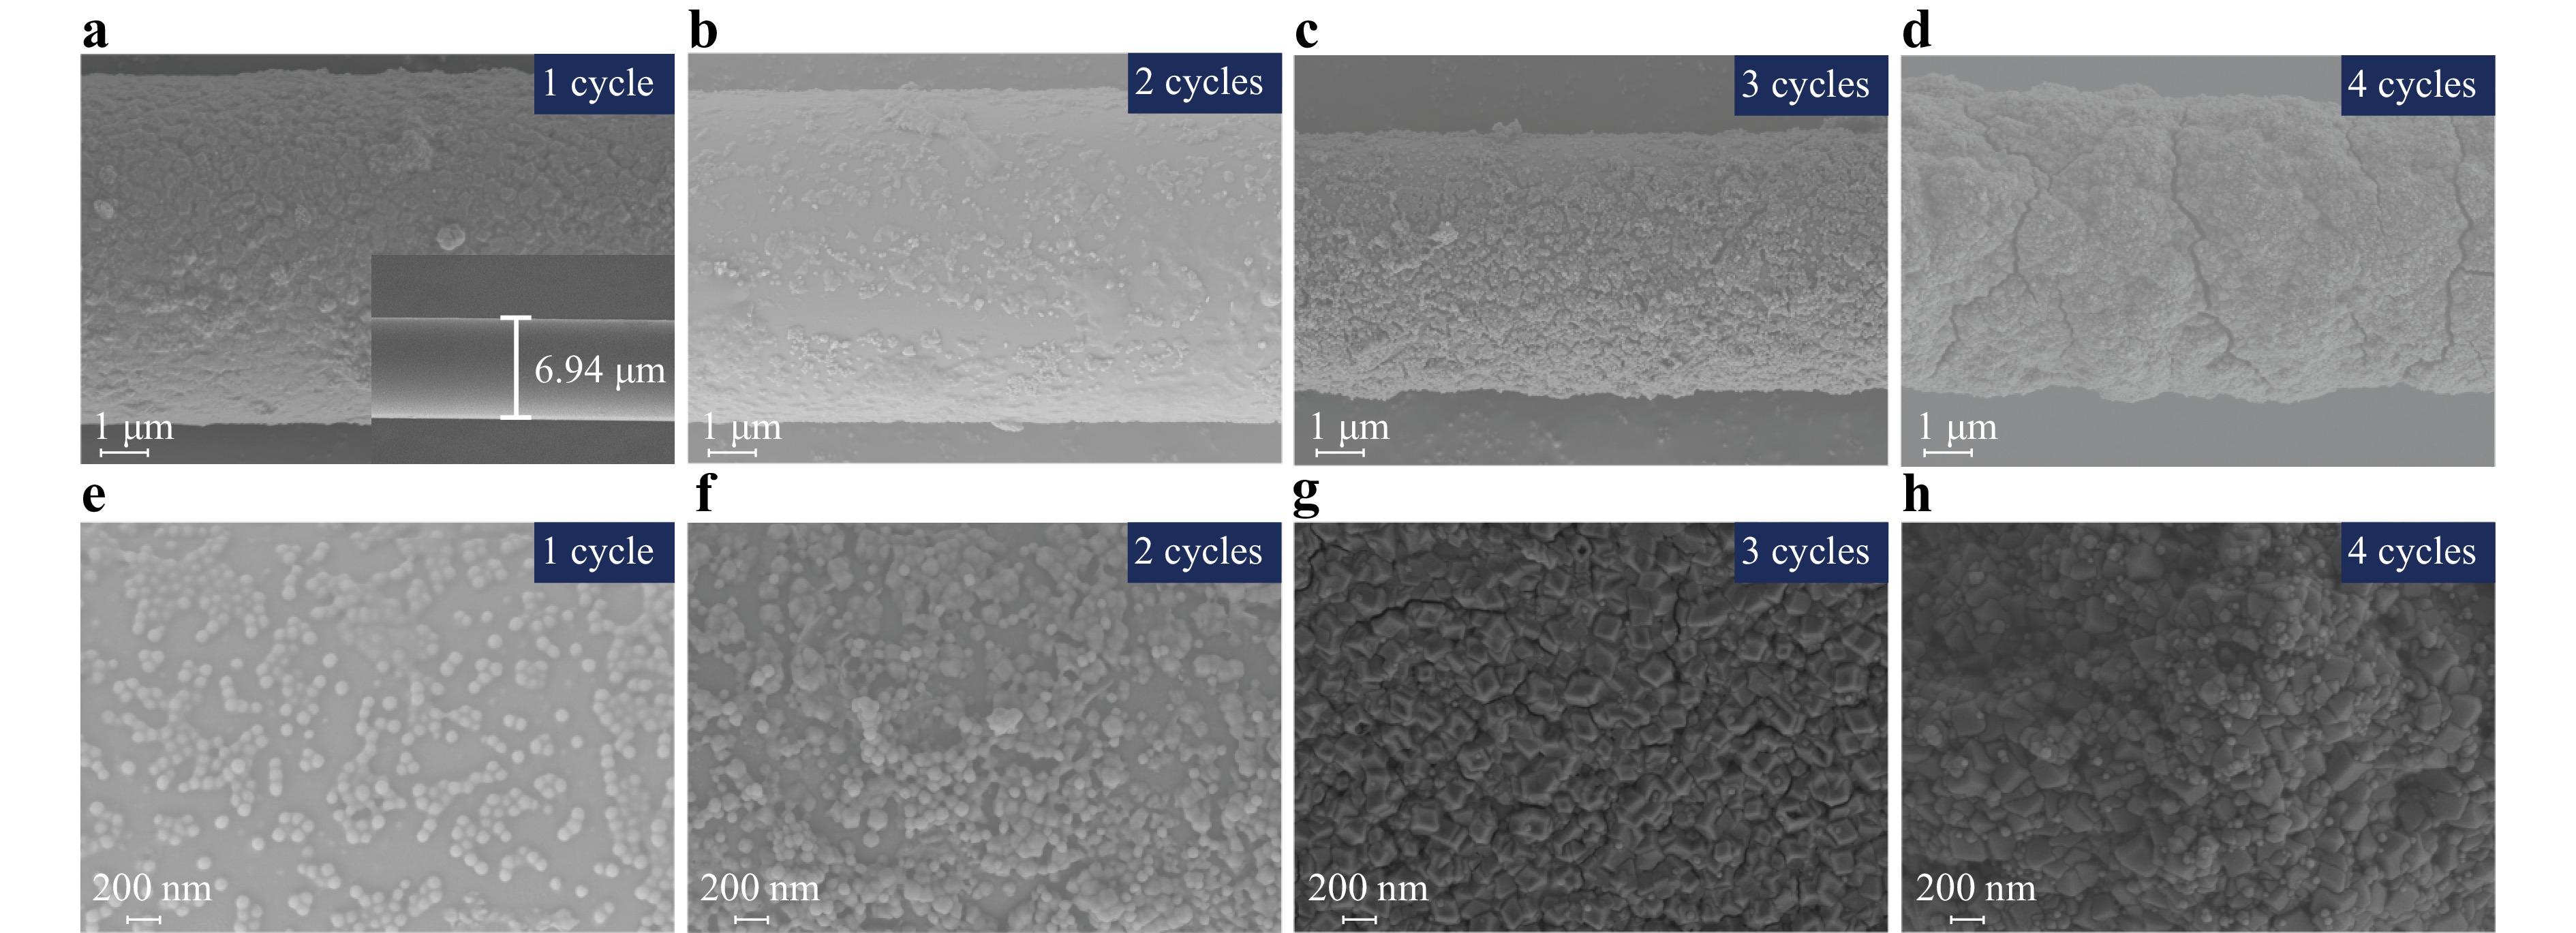
Fig. 4 SEM images of ZIF-8 membranes on MNFs following 1–4 self-assembly growth cycles. The SEM images were obtained at 3 kV extra high tension. a SEM image after 1 cycle of in situ ZIF-8 membrane self-assembly on MNFs with a magnification of 9 k; the inset shows the SEM image of bare MNF with a diameter of 6.94 μm. b–d SEM images of MNFs after 1 to 4 cycles of in situ ZIF-8 membrane self-assembly, all with a magnification of 9 k. e–h Higher magnification SEM images of in situ ZIF-8 membranes self-assembled on MNFs: e 1 cycle at 30,000×, f 2 cycles at 20,000×, g 3 cycles at 30,000×, and h 4 cycles at 30,000×.
-
A schematic diagram of the wavelength demodulation sensing system for LIB electrolyte vapour detection is shown in Fig. 5a. The system primarily consisted of a gas chamber, wavelength demodulator, and fibre optic link. The fabricated MNFs*ZIF sensor was placed within a sealed metal gas chamber with a 3 L volume (100 mm × 100 mm × 300 mm), equipped with a spherical valve at the top for liquid introduction. The sensor was linked to a wavelength demodulator via two SMF patch cords to acquire and monitor the transmission spectrum. The wavelength demodulator recorded the transmission spectrum at intervals of 1 s or 1 min, over an acquisition range of 1530–1570 nm in the C-band. A 10 μL pipette gun was used to inject DMC solvent into the chamber, allowing the vaporized gas molecules to diffuse into the ZIF-8 membrane. The shift in the dip of specific interference patterns within the transmission spectrum was tracked to quantify the concentration of evaporated DMC.
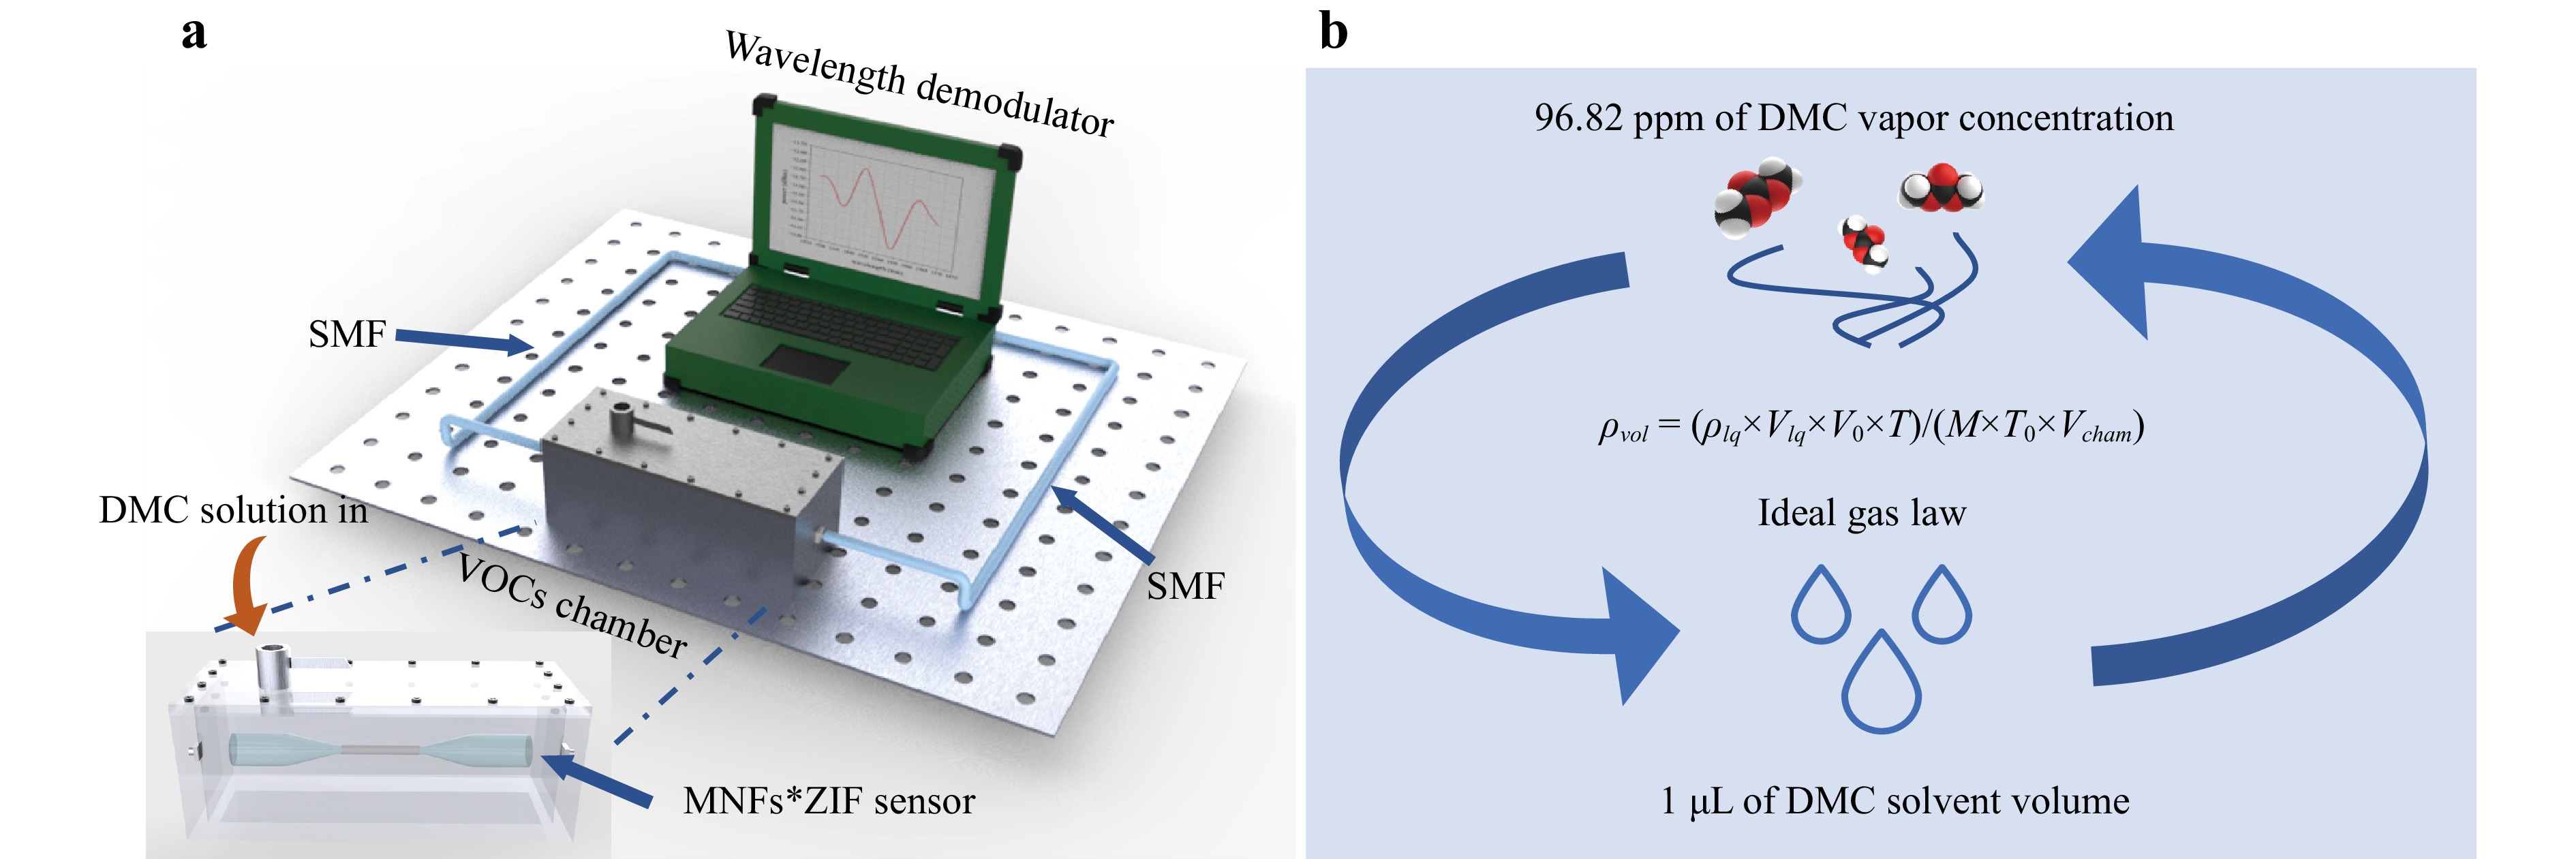
Fig. 5 Experimental setup for detecting LIB electrolyte vapor concentration. a Schematic diagram of the MNFs*ZIF wavelength demodulation system, including the MNFs*ZIF sensor, VOC detection chamber, wavelength demodulator, and SMF patch cables. The wavelength demodulator featured an integrated light source, Bragg grating, photo detector, acquisition card, upper computer, and signal processing algorithms. The MNFs*ZIF sensor was positioned at the top of the gas chamber to ensure complete adsorption of evaporated solvent molecules. Silicone-sealed holes maintained the chamber’s airtightness, and a ball valve at the top allowed for rapid electrolyte injection. b Schematic illustrating the conversion between volume of the LIB electrolyte solvent and the resulting vapor concentration.
Since the target analyte was injected as a liquid, the gas concentrations after evaporation required conversion. According to the ideal gas law, under the conditions of 25 °C and standard atmospheric pressure, the conversion between the volume of DMC solvent (Vlq) and volume concentration of vapor (ρvol) in the gas chamber can be expressed as:
$$ {\rho _{vol}} = {{( {{\rho _{lq}} \times {V_{lq}} \times {V_0} \times T} )} /{( {M \times {T_0} \times V{}_{cham}} )}} $$ (4) Here $ {\rho _{lq}} = 1.07\;{\rm g} \cdot{\rm{ cm}}^ {-3} $ represents the DMC solvent density, $ {V_0} = 22.4\;{\rm L} \cdot{\rm{ mol}}^{-1} $ is the standard molar volume of gas, $ {T_0} = 273{\text{ }}K{\text{ }}\left( {T = 298{\text{ }}K} \right) $ is the temperature, $ M = 90.078{\text{ }}{\rm g} \cdot {\rm{mol}}^{-1} $ represents the molar mass of DMC, and $ {V_{cham}} = 3{\text{ }}L $ is the volume of the chamber. Using this relationship, the volume fraction of DMC vapor after the complete evaporation of 1 μL of the DMC solvent in the gas chamber was calculated to be 96.82 ppm, as shown in Fig. 5b.
-
To measure and calibrate the performance of the MNFs*ZIF sensor in detecting LIB electrolyte vapor, DMC, the most common electrolyte solvent in batteries, was chosen as the test analyte. Sequential injections of DMC solution (ranging from 0.2 to 4.5 μL) were administered into the gas chamber using a pipette gun. These volumes corresponded to vapor concentrations between 19.4 and 435.7 ppm after full evaporation. The detection process was segmented into three phases: evaporation, stabilization, and exhaust, during which the transmission spectrum of the sensor was recorded at regular intervals. The detection outcomes are presented in Fig. 6.
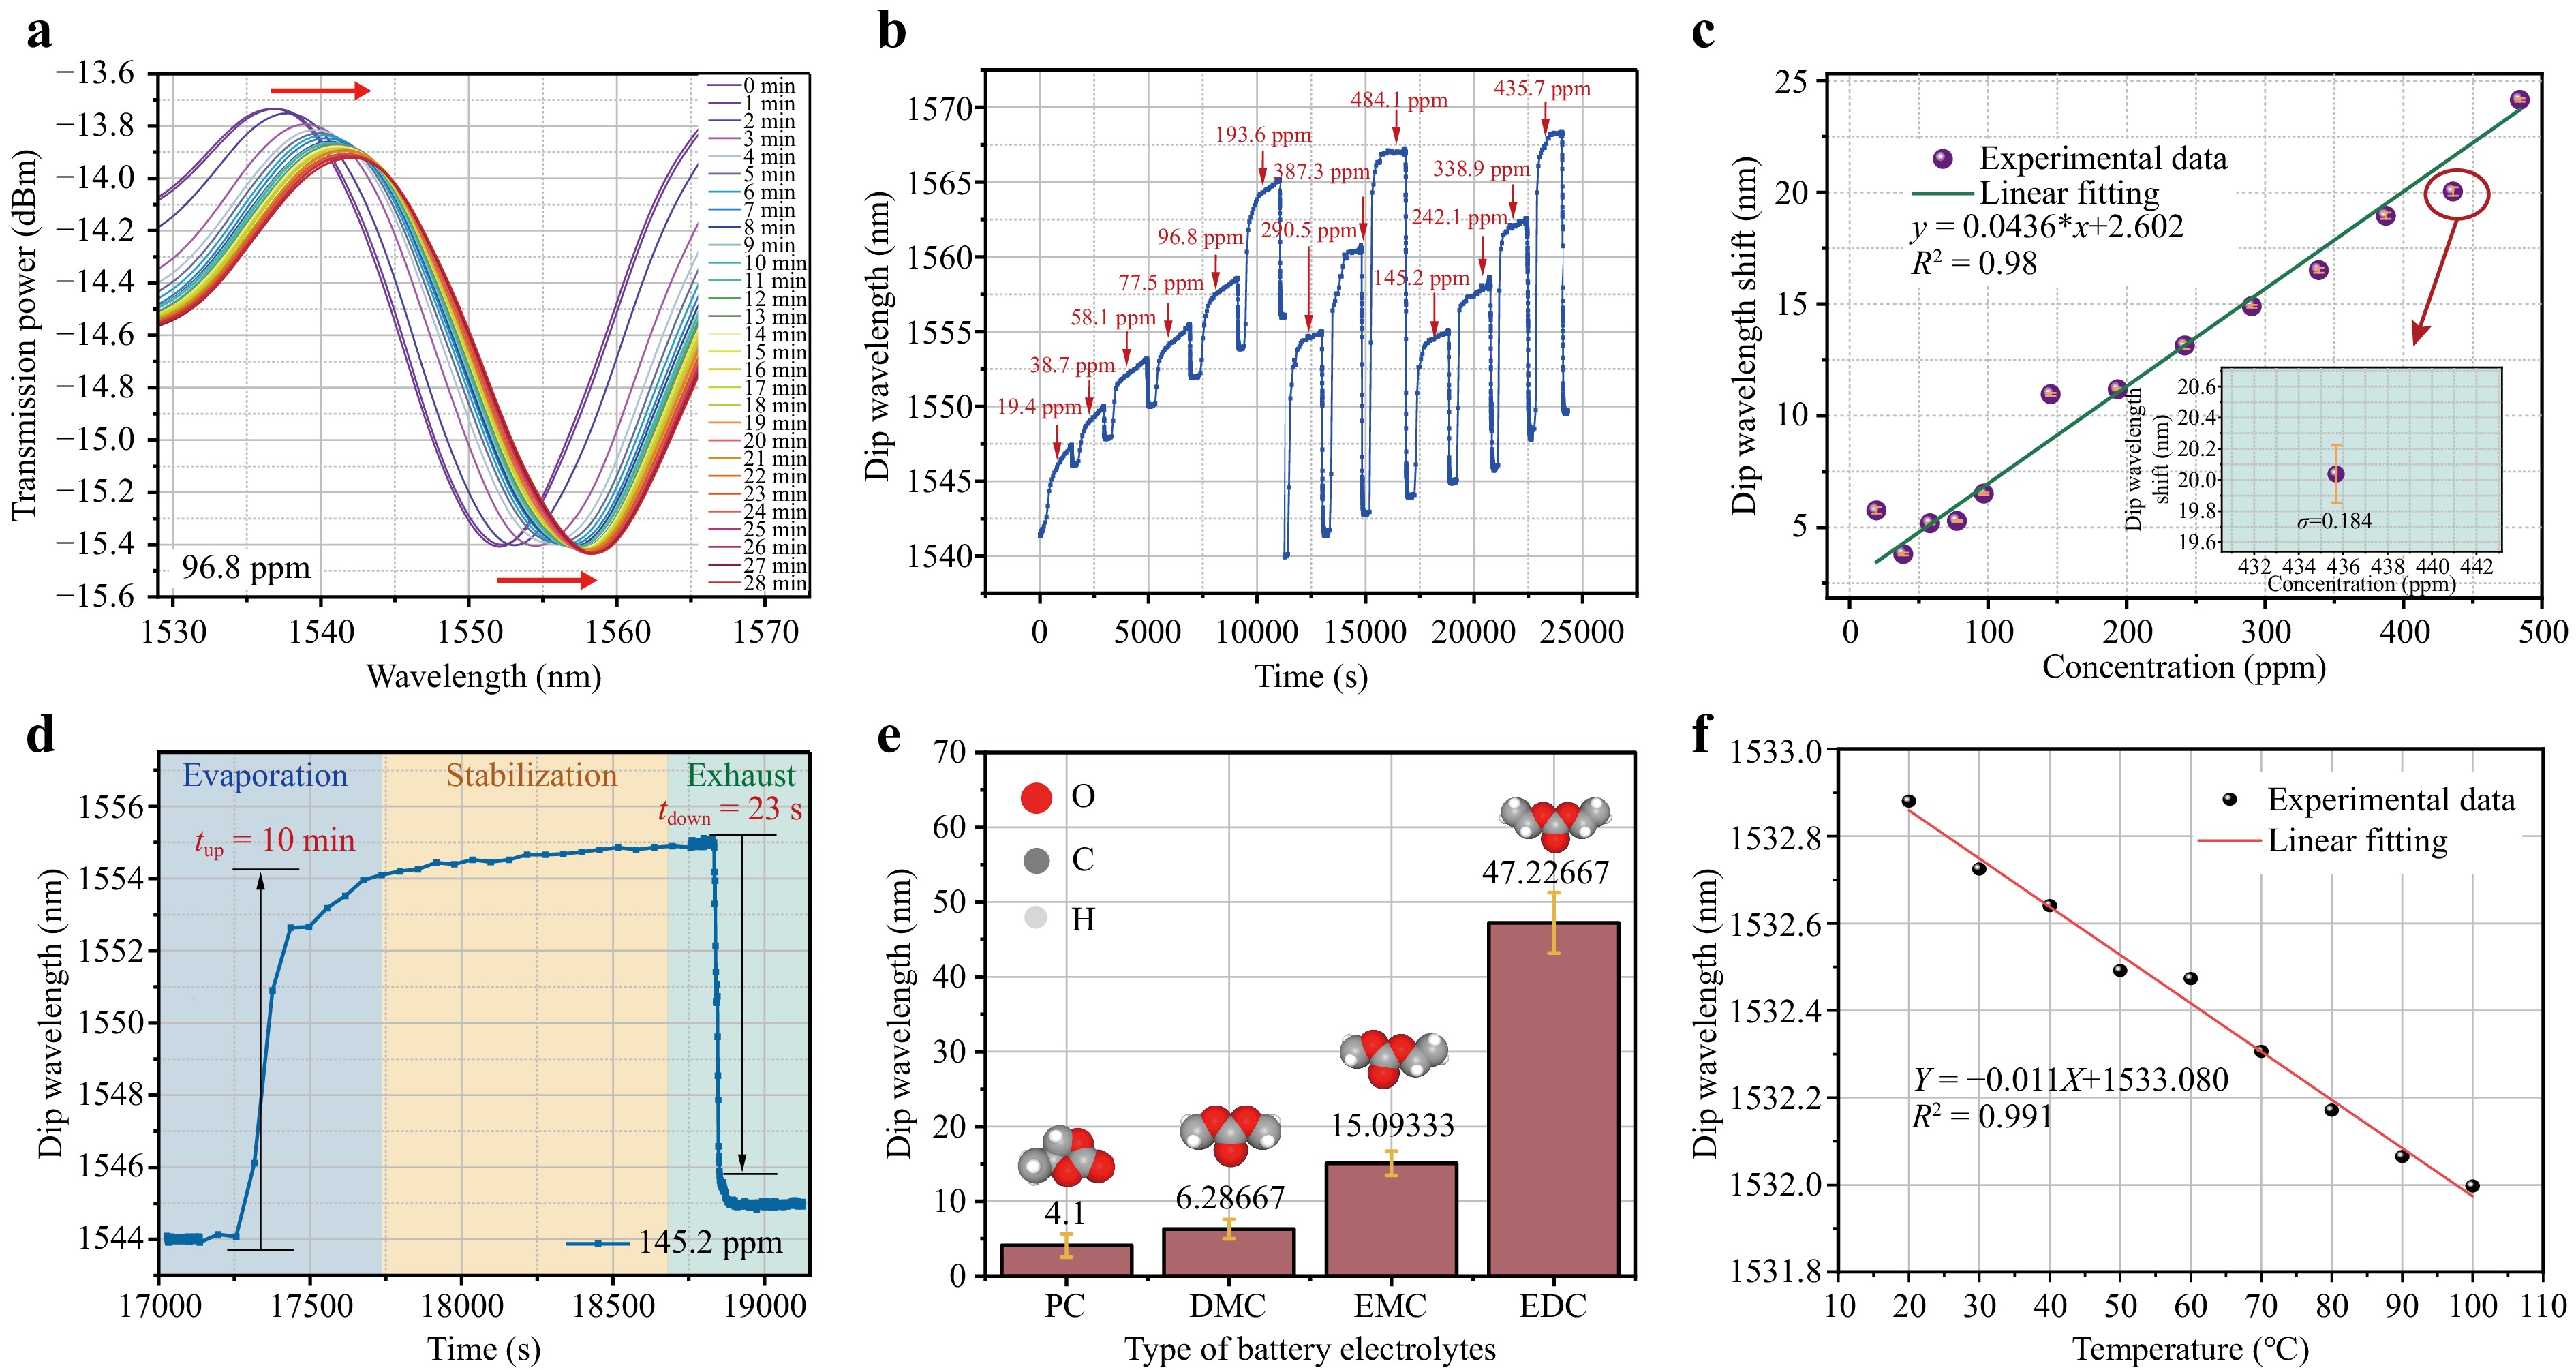
Fig. 6 Performance of MNFs*ZIF in detecting LIB electrolyte vapor. a Evolution of the red-shift in the transmission spectrum of MNFs*ZIF over 28 min for a DMC vapor concentration of 96.8. b Changes in the dip wavelength position in the transmission spectrum across time for DMC concentrations ranging from 19.4 to 435.7 ppm, showing 13 distinct concentrations. The sensor’s response phases include evaporation, stabilization, and exhaust. c Linear fit of MNFs*ZIF sensor response to DMC concentrations between 19.4 to 435.7 ppm, with error bars representing the standard deviation between pre- and post-adsorption stabilization phases. d Example of response and recovery time for the MNFs*ZIF sensor to DMC vapor at 145.2 ppm concentration. e Resonant wavelength responses of MNFs*ZIF under 1 μL volumes of various electrolyte compositions, including PC, DMC, EMC, and DEC, along with their chemical structures. f Temperature sensitivity of MNFs*ZIF measured over a range of 20–100 ℃ in 10 ℃/3–5 minincrements, controlled by a thermoelectric cooler.
The transmission spectrum varied with DMC evaporation time, showing a typical red-shift as the evaporated DMC concentration increased from 19.4 to 193.6 ppm (Fig. 6a). In Fig. 6b, the interference dip wavelength consistently shifted to longer wavelengths, indicating good reversibility of the MNFs*ZIF sensor. After the sensor returned to its initial state, DMC concentration was incrementally raised from 290.46 to 484.1 ppm, maintaining consistent sensor reversibility. Repeated measurements at four concentrations (145.2 to 435.7 ppm) demonstrated repeatable sensor behavior. Notably, a slight red-shift during the stable period followed each test cycle due to minor instability in the wavelength demodulator's light source, which could be mitigated using signal processing techniques like wavelet denoising. The sensor's functionality was restored after each cycle by air exchange to remove residual gas molecules on the ZIF-8 surface. Linear fitting yielded a sensitivity S of 43.6 pm/ppm for the 19.4–435.7 ppm range, with R2 = 0.98 (Fig. 6c), with accuracy influenced by pipette volume precision.
Key performance metrics for VOC detection include response time (tup) and recovery time (tdown), defined as the time to reach 90% of the maximum wavelength shift during evaporation and exhaust phases, respectively. tup depended on complete evaporation and diffusion of DMC into ZIF-8, while tdown depended on desorption rate, yielding tup = 10 min and tdown = 23 s at 145.2 ppm (Fig. 6d). Notably, the response time of the MNFs*ZIF sensor was influenced by the relatively slow processes of electrolyte evaporation and penetration into the membrane pores. Recovery, however, was rapid due to the passive venting process, where DMC vapor exchanged directly with the atmosphere. Active venting, such as nitrogen injection, was not used. The significant concentration gradient facilitated swift DMC-air exchange, reducing the RI and causing a spectral blue-shift. The standard deviation of noise during a 120 s stable state without the target material was denoted as σ, with a typical value of 0.0385 nm. Moreover, the limit of detection (LOD) for the MNFs*ZIF sensor was defined as 3σ/S, leading to a theoretical LOD of 2.65 ppm at a DMC concentration of 145.2 ppm. With the wavelength demodulator resolution R set at 0.02 nm, the sensor's theoretical resolution R/S was calculated to be 0.46 ppm, demonstrating the high sensitivity and low detection threshold of the MNFs*ZIF sensor for DMC vapor.
To confirm the adsorption capabilities of MNFs*ZIF for LIB electrolytes, sensor responses to four types of common electrolyte compositions was evaluated and compared, as shown in Fig. 6e. Results indicated that the sensor was significantly more sensitive to diethyl carbonate (DEC) and ethyl methyl carbonate (EMC) than to DMC and propylene carbonate (PC). The reduced response to PC was attributed to its lower volatility relative to the other VOCs. Non-interference from other volatiles, such as hydrogen, toluene, and oxygen, was confirmed based on the molecular adsorption characteristics, including force, size, and polarity, analyzed during sensor fabrication. This selective detection underscores the sensor’s effectiveness, with the highest response observed for DEC. The sensor's higher sensitivity to composite LIB electrolytes compared to single electrolytes like DMC highlights its suitability for safety monitoring in battery leakage scenarios. Fig. 6f illustrates the sensor's temperature sensitivity, showing a minimal shift of –0.011 nm·°C–1 over the 20–100 °C range, which is negligible for gas detection applications.
In summary, the MNFs*ZIF sensor demonstrated exceptional sensitivity and resolution, with a low detection limit and rapid response and recovery times for DMC vapor at ppm levels. Performance comparisons with other VOCs sensor (Table S1) further emphasized its potential in LIB leakage detection applications.
-
To verify the capability of MNFs*ZIF for providing real-time early warnings of LIB leakage, an experimental setup was created to simulate leakage from pouch lithium cells under working conditions. The detection performance of MNFs*ZIF was compared to that of a light emitting diode (LED) load to assess its effectiveness in identifying faults in defective batteries. The sensor and battery were enclosed in an air-sealed chamber to prevent interference from other gases.
A pouch LIB cell containing DMC : DEC : EMC = 1:1:1 (v/v) electrolyte was placed in the chamber, alongside the MNFs*ZIF sensor, with the LIB voltage monitored using a multimeter (Fig. 7a). First, the battery was tested under load to ensure it was functioning properly, powering the LEDs with an initial voltage of 3.292 V. After 1 h, the battery voltage had dropped to 2.861 V, marking the start of the monitoring phase. The voltage then continued to decrease at a consistent rate as the LED consumed power from the LIB, as shown in Fig. 7b. To simulate a leakage event, a puncture approximately 2 mm in diameter was made in the battery after 0.72 hours of monitoring (Fig. 7a). Notably, this damage did not alter the rate at which the voltage decreased (Fig. 7b).
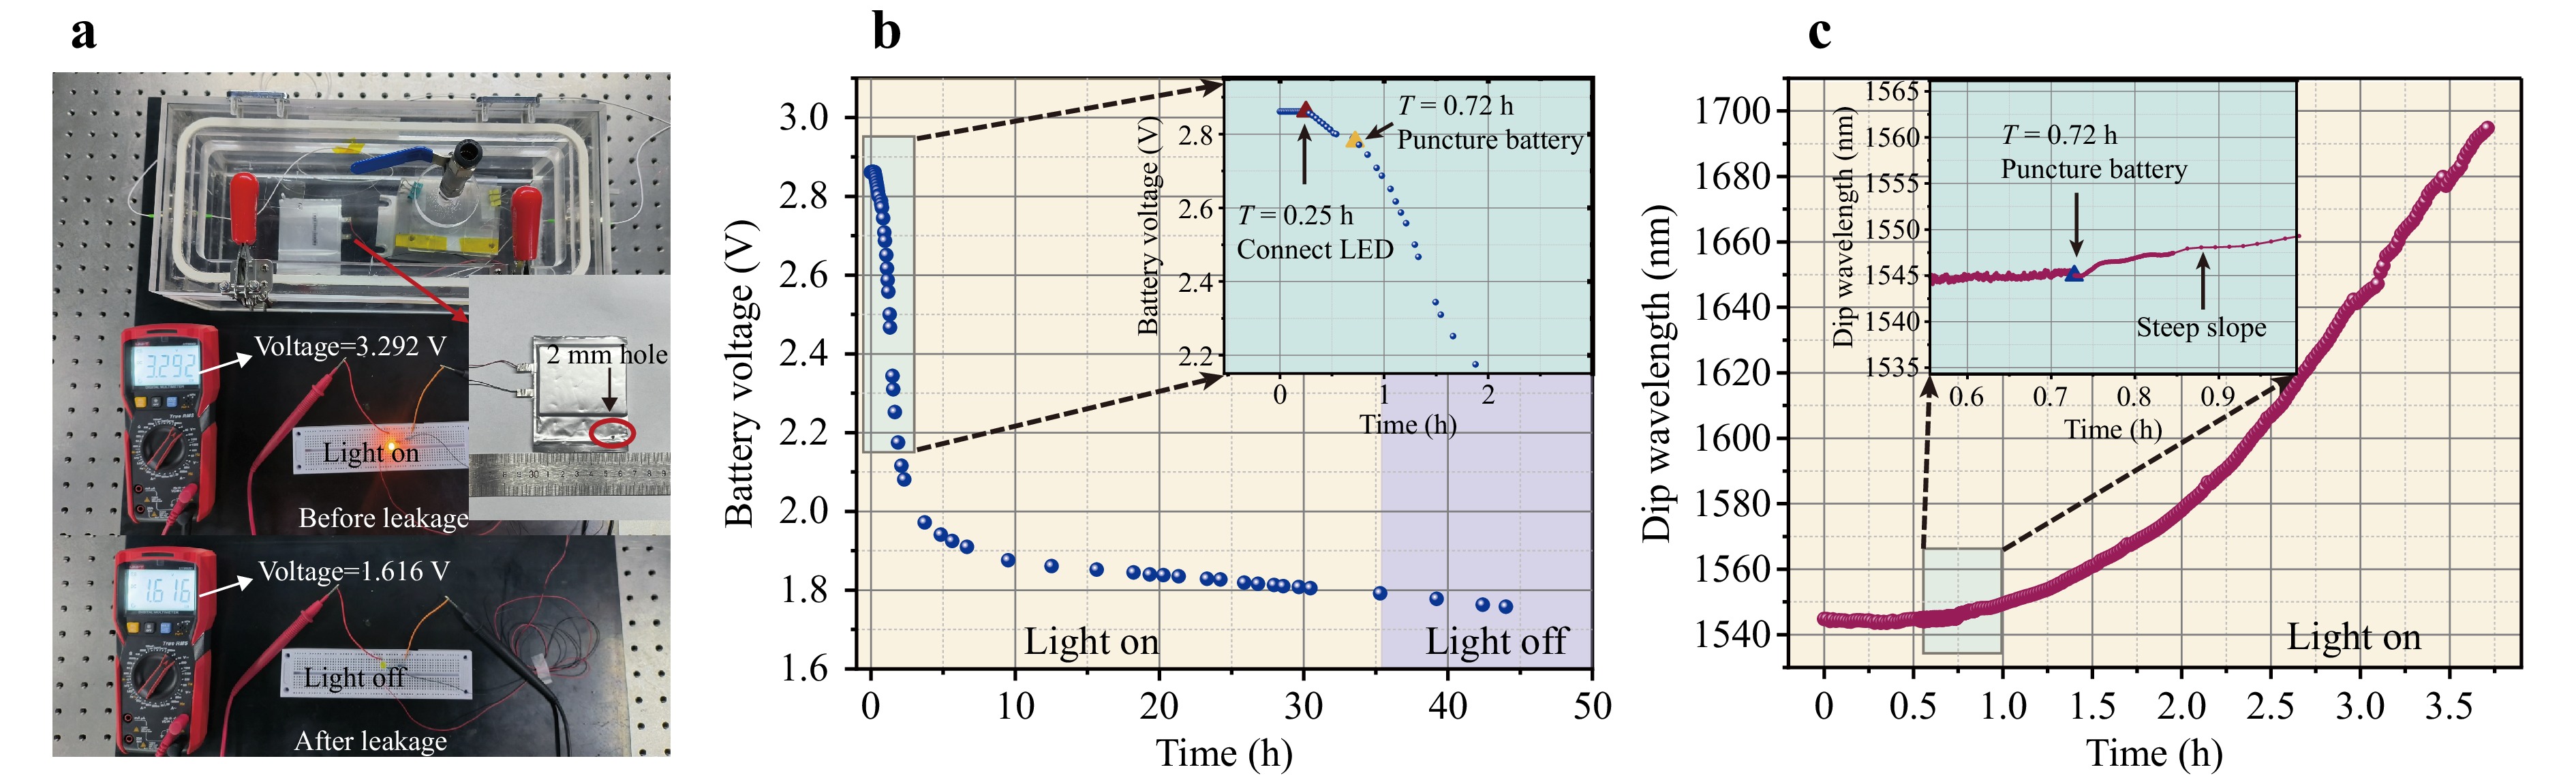
Fig. 7 Online leakage detection using the MNFs*ZIF sensor. a Diagram of the LIB electrolyte leakage test system, where the MNFs*ZIF sensor was positioned at a high horizontal location in the chamber, and the LIB was placed at the chamber's base. A pouch lithium cell with a nominal voltage of 3.65 V was punctured with a hole approximately 2 mm in diameter to simulate leakage. An LED circuit, including a 100 Ω resistor in series, completed the setup. The LIB’s external voltage was continuously measured using a multimeter to compare the voltage and LED status before (LED on, voltage = 3.939 V) and after (LED off, voltage = 1.616 V) the leakage event. b Time-based variation of the LIB external voltage: at T < 0.25 h, the LIB remained open; at T = 0.25 h, the LED was connected; at T = 0.72 h, the LIB was punctured, starting the leakage; at T = 35 h, the LED was turned off. c Changes in the MNFs*ZIF transmission spectrum’s dip wavelength over the first 3.5 h, recorded at 1-min intervals by the wavelength modulator, until saturation.
In contrast, the dip wavelength in the transmission spectrum of MNFs*ZIF showed an immediate response to the leakage, characterized by a sudden steep slope (Fig. 7c), demonstrating the sensor’s capability to detect battery leakage with rapid response time. The dip wavelength underwent a consistent red-shift of several hundred nanometers until saturation was achieved after 3.5 h, effectively monitoring LIB leakage. Notably, even when the LIB voltage decreased to 2 V after this period, the LED remained illuminated. The LIB voltage continued to decrease, reaching 1.616 V until the leakage event occurred after 35 hours, at which point the LED load appeared to be off, as illustrated in Fig. 7a. Overall, these results indicate that the MNFs*ZIF sensor is effective for online monitoring of trace amounts of LIB electrolyte leakage and can provide early warnings of fault events due to its high sensitivity, stability, rapid response time, immunity to other gases, and robustness against temperature fluctuations.
-
In summary, a highly sensitive VOC sensor featuring in situ self-assembled ZIF-8 membrane-coated MNFs has been fabricated for the early warning of online electrolyte leakage in LIB cells for the first time. In our work, the detection principles of RI sensitivity in MNFs and the relationship between the RI of the ZIF-8 membrane and VOC concentration was theoretically analysed. Moreover, the MNFs*ZIF sensor was fabricated with a dense 500 nm thick in situ self-assembled ZIF-8 membrane, which was grown in a controlled manner. To verify the performance of the proposed MNFs*ZIF, gas concentration sensing experiments of DMC were carried out to calibrate sensitivity, response time, and detection limit; the sensor achieved a sensitivity of 43.6 pm/ppm in the ppm range for DMC vapour, as well as rapid response and recovery times averaging at 10 minutes and 23 seconds, respectively. The sensor also exhibited outstanding adsorption properties for common electrolyte compositions over of other gases such as hydrogen and toluene. Furthermore, a working-state LIB was monitored online by MNFs*ZIF, providing a red-shift of hundreds of nanometres in the transmission spectrum and 35 h of early warning prior to the LED load lights being switched off, demonstrating the excellent early warning capability of the MNFs*ZIF. This study provides a highly sensitive, reversible, and fast response strategy for promising energy and health diagnostics, with potential applications in electric cars, using in-situ self-assembled ZIF-8 membrane-coated MNF sensors.
-
We are grateful for financial support from the National Natural Science Foundation of China (U22A20206, 62305124, 61922033), China Postdoctoral Science Foundation (2023M731188), and the Postdoctoral Fellowship Program of CPSF (GZB20230237).
Early detection of lithium battery leakage using a highly sensitive in situ ZIF-8 membrane-coated micro-nano optical fibre
- Light: Advanced Manufacturing , Article number: (2025)
- Received: 17 May 2024
- Revised: 31 December 2024
- Accepted: 05 January 2025 Published online: 12 March 2025
doi: https://doi.org/10.37188/lam.2025.014
Abstract: Detecting electrolyte leakage is an effective early warning approach for abnormal faults in lithium-ion batteries (LIBs) and can help mitigate safety risks such as fires and explosions. However, detecting electrolyte leakage in the early stages of LIB faults presents a significant challenge, as leaks in LIBs produce volatile organic compounds (VOCs) at parts per million levels that are difficult to detect using conventional VOC sensors. Here, an effective LIB VOC sensor using micro-nano optical fibres (MNFs) has been developed for the first time, coated with an in situ self-assembled zeolitic imidazolate framework-8 (ZIF-8) membrane as an electrolyte-sensitive layer. The abundance of pores in ZIF-8 is excellent for adsorbing a variety of VOCs, including diethyl carbonate, ethyl methyl carbonate, dimethyl carbonate, and propylene carbonate. The MNFs possess high refractive index sensitivity, enhancing the online monitoring of electrolytes. MNFs with a diameter of approximately 7 μm were assembled with four-cycle ZIF-8 of approximately 500 nm thickness, as the fabricated sensor. Through wavelength demodulation, the LIB sensor demonstrated high sensitivity, detecting 43.6 pm/ppm of VOCs and exhibiting rapid response and recovery times of typically within 10 min and 23 s, respectively, as well as a low theoretical detection limit of 2.65 ppm for dimethyl carbonate vapor with excellent reversibility. The first on-site verification of online LIB leakage monitoring demonstrated that the sensor achieved a 35 h early warning prior to full-load leakage, thus exhibiting promising prospects for applications in scenarios such as car batteries.
Rights and permissions
Open Access This article is licensed under a Creative Commons Attribution 4.0 International License, which permits use, sharing, adaptation, distribution and reproduction in any medium or format, as long as you give appropriate credit to the original author(s) and the source, provide a link to the Creative Commons license, and indicate if changes were made. The images or other third party material in this article are included in the article′s Creative Commons license, unless indicated otherwise in a credit line to the material. If material is not included in the article′s Creative Commons license and your intended use is not permitted by statutory regulation or exceeds the permitted use, you will need to obtain permission directly from the copyright holder. To view a copy of this license, visit http://creativecommons.org/licenses/by/4.0/.

 DownLoad: