-
As the only natural satellite of Earth, the Moon has been the focus of human exploration since 1959. Several lunar sampling missions, which are crucial for studying the composition and origin of the Moon, have been planned and executed. In the 1960s, three Luna missions returned 0.3 kg of samples, and six Apollo landings returned 381.7 kg of samples. More recently, the Chang’e-5 mission returned 1.7 kg of samples. The Chang’e-6 mission is the latest development in the Chinese Lunar Exploration Program (CLEP), and was selected to land within the lunar farside of the South Pole–Aitken (SPA) basin in the southern part of the Apollo basin1,2. The Chang’e-6 mission was the first lunar farside sample mission, returning 1.9 kg of samples and representing another significant achievement in lunar research.
Planetary samplers include drilling3–6, grabbing7, excavating/scooping8–11, and projecting12,13. In lunar sample return missions, Apollo collected lunar samples manually by astronauts14, Luna used autonomous rotary-percussive drilling samplers to collect samples5,6, and Chang’e-5 used a rotary-percussive drilling sampler and a mechanical arm carried the scooping sampler to collect subsurface and surface samples10,11. Similar to the Luna and Chang’e-5 missions, the Chang’e-6 mission adopted robotic sampling, which has proven effective for collecting a small number of lunar samples. Chang’e-6 used the same methods as Chang’e-5 to collect lunar samples: soil core drilling and soil and rock fragment scooping. Compared to drilling, scooping allows for a more flexible site selection. The scooping sampler, moved by the mechanical arm, can reach any site within a certain range during the sampling process, as shown in Fig. 1a. Therefore, the choice of the sampling site directly affects the quality of scooping sampling. In the previous Chang’e-5 mission, the sample points were confirmed manually, and the collected data, particularly images, served as the main criterion for the operators. At this stage, each sample point was adequately analyzed and checked to ensure safety and sampling quality, which consumed a significant amount of time. In addition, indirect 2D images pose challenges for detailed terrain analysis, whereas high-quality 3D terrain data have been proven to be important for lunar sampling. The Chang’e-6 probe had a camera configuration similar to that of the Chang’e-5 probe15, which included a binocular camera. To extract 3D information from the image, common approaches use binocular image pairs to estimate depth using stereo matching algorithms16–18. 3D point cloud data can then be reconstructed with the estimated depth. These approaches can effectively capture the approximate shapes of the scenery, but local accuracy is often not guaranteed. However, with significant developments in deep-learning research, it is now feasible to reconstruct precise 3D point clouds from binocular images using neural networks19–23. These new technologies offer more accurate and efficient methods for lunar terrain analysis and sampling site selection, thereby enabling autonomous analysis.
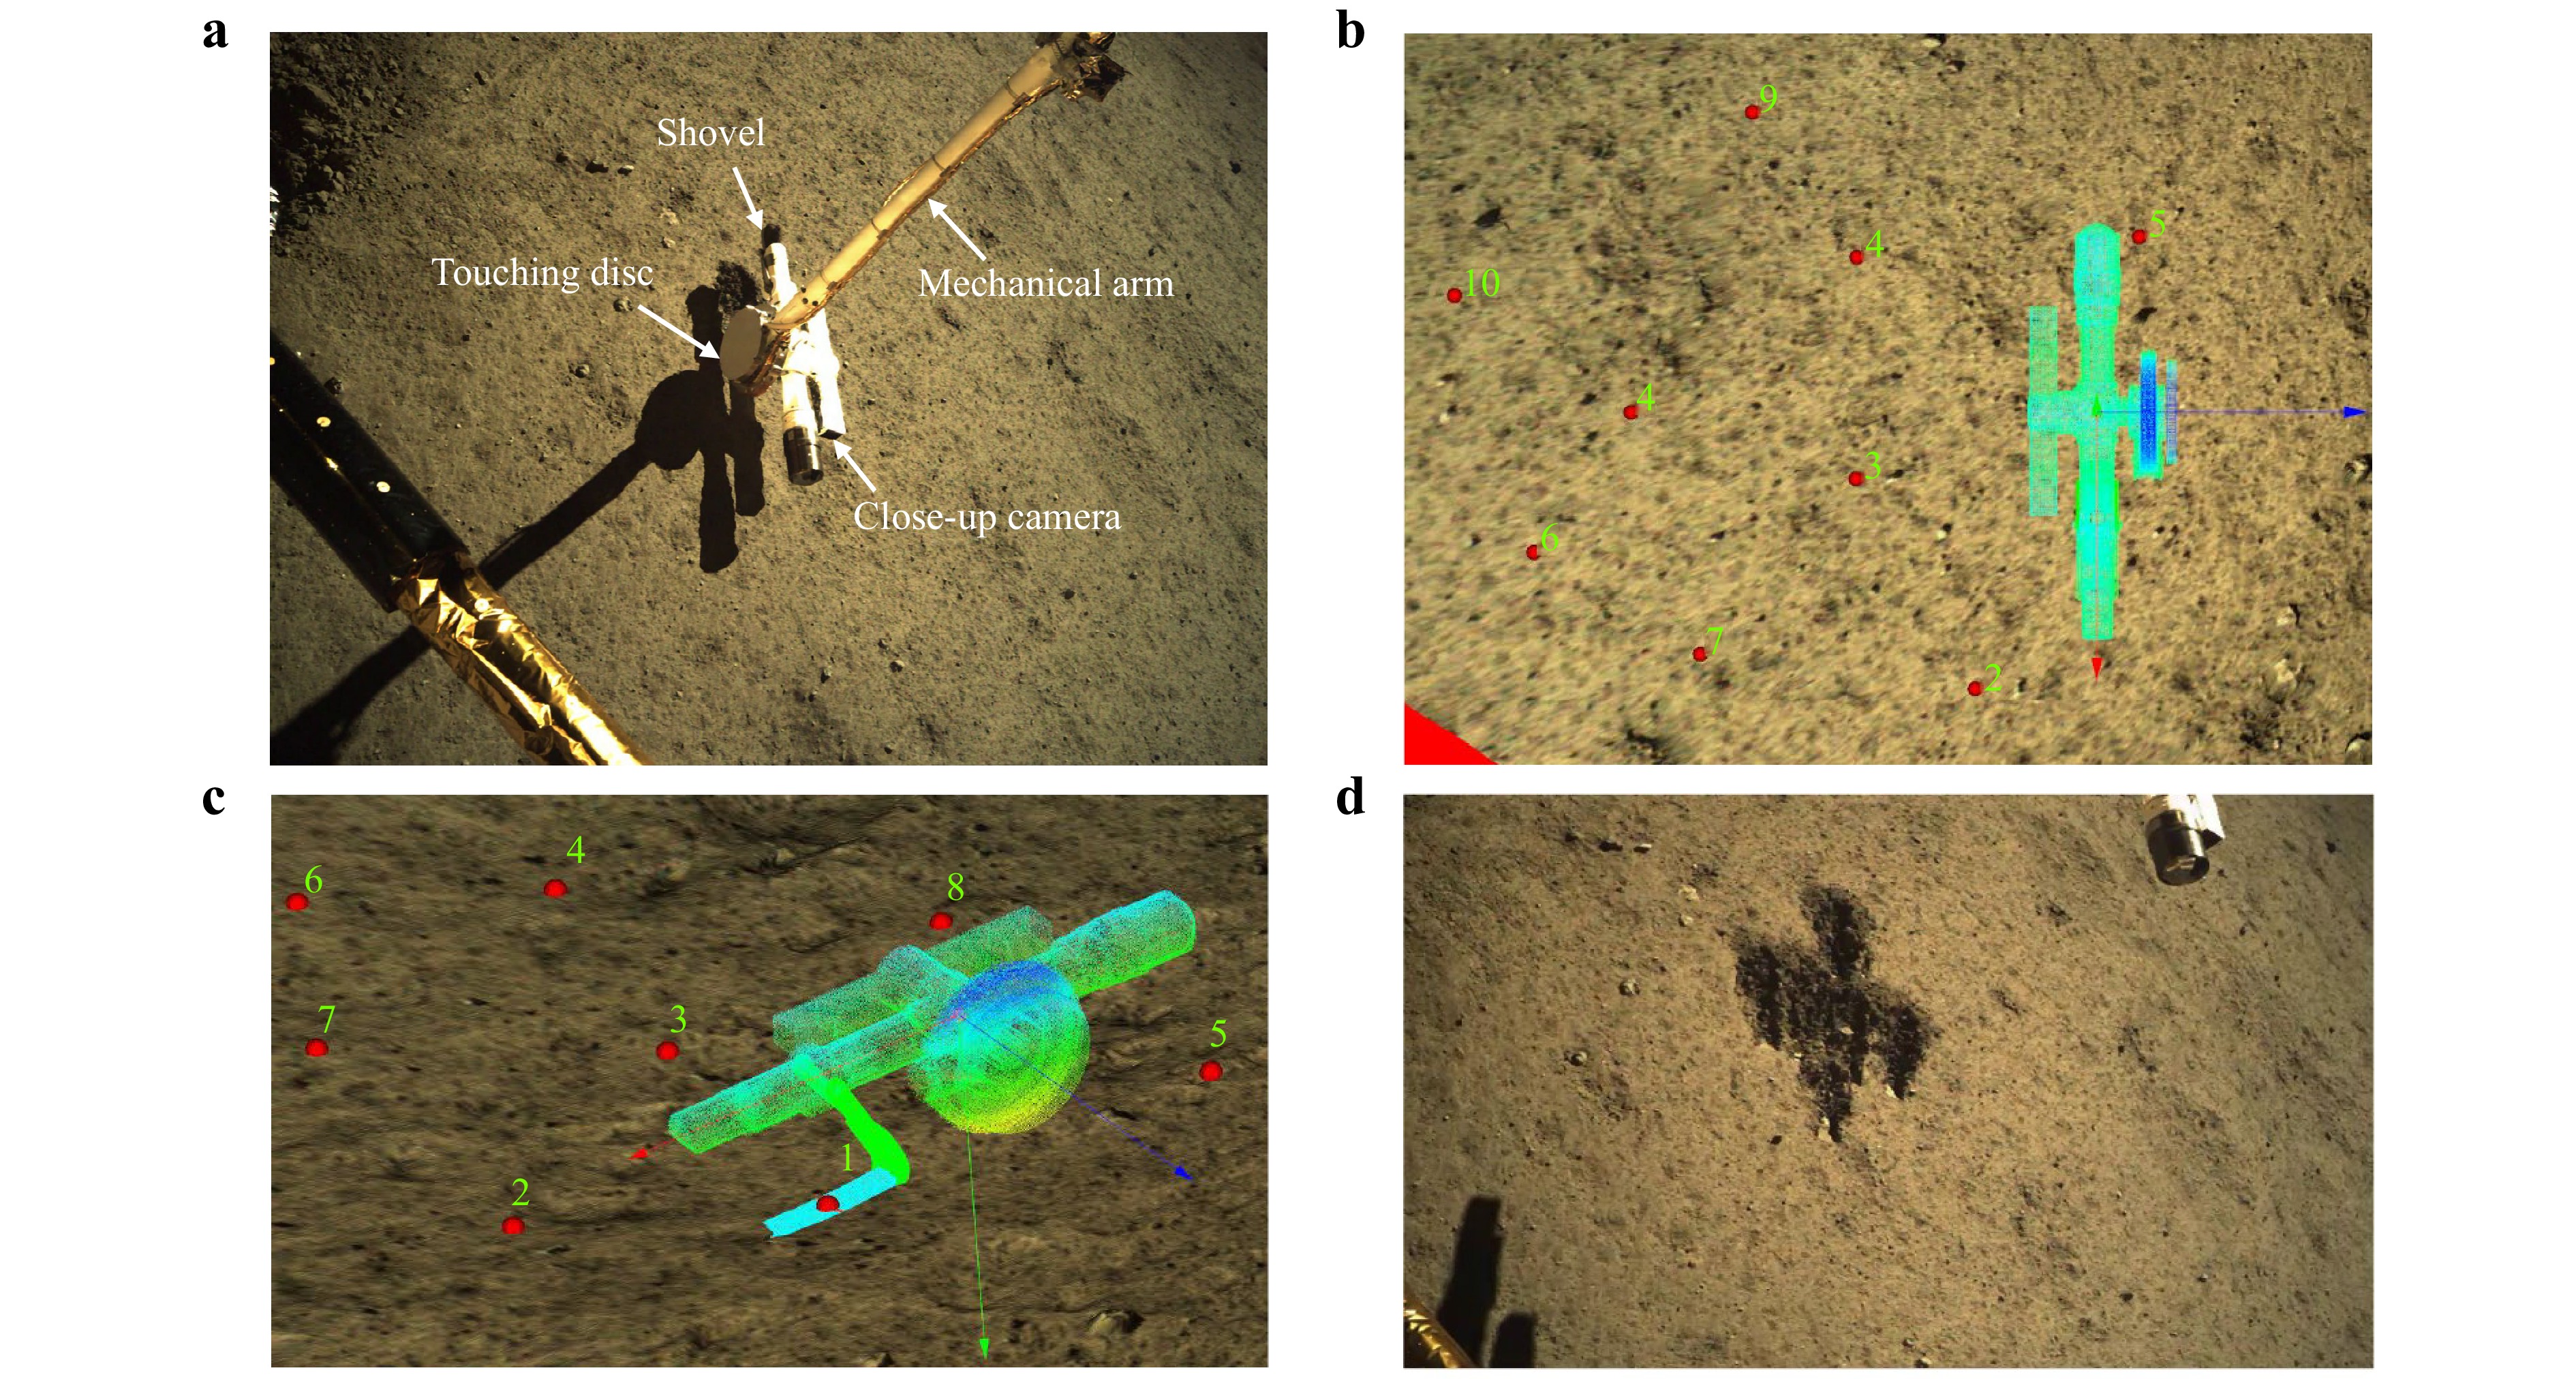
Fig. 1 Scooping sampling in the Chang’e-6 mission (images captured on the Moon, South Pole-Aitken Basin, 154.0°W, 41.6°S). a Image of the sampler during the scooping, the main parts of the sampler are labeled. b Sample point selection using the terrain point cloud data, the selected points are labeled in red, the numbers denote the planned sampling sequence. c Optimal sampler pose analysis for fine-tuning. d Image of the scooping pits after the sampling process.
The sampling process is a crucial component of a sampling mission and must be sufficiently reliable24. Unlike drilling, scooping requires a precise pose for the sampler. If the height of the sampler is too high, the shovel may not contact the lunar surface and may fail to collect the soil. Conversely, if the height is too low, the shovel may fail to scoop up excessive soil and potentially become stuck, which can present a hazard. Owing to the inherent movement errors of the mechanical arm, such as deformation, the sampler cannot accurately reach the target pose in a single movement, and a pose fine-tuning step is required. Due to the long communication delay, manual operation is quite time-consuming25, which poses a great challenge in the fine-tuning design. In the Chang’e-5 mission, fine-tuning was manually implemented by a specialized operator, with a touching moon step added to confirm the height of the lunar terrain. By referring to multiple images, the operator estimated the approximate height of the sampler and determined the required height adjustment. This step requires complex training for the operator and inevitably results in a high time cost, which poses challenges to the more time-critical Chang’e-6 mission. However, by using binocular images, it is possible to measure the pose of the sampler more accurately and replace manual estimation. Binocular cameras are widely used in vision measurement systems26,27, and recent studies on 6D pose estimation methods have shown great potential. Given a specific template, these methods estimate the precise pose of a corresponding item without relying on well-designed corner targets or geometric patterns28–33. This provided robust pose measurement for the scooping sampler in the Chang’e-6 mission, making autonomous fine-tuning feasible.
This study focuses on scooping sampling, introduces the terrain factors that affect the selection of lunar sampling sites, and analyzes the main errors in the sampling process for the Chang’e-6 mission. Based on these analyses, a complete vision-based approach for a sampling implementation system is proposed to achieve autonomous sample point selection and sampler pose fine-tuning. Using the reconstructed point cloud data, the slope of the sampling region and distribution of risky obstacles are analyzed using automatic point cloud processing. A safe sampling region is then determined based on the analysis results. To avoid the impact of terrain factors, the analysis results are used to design a multi-objective evaluation function to automatically determine the optimal sample points, as shown in Fig. 1b. This approach significantly reduces the difficulty and time cost of sampling site selection. During the sampling process, the optimal sampling pose is calculated for each sample point to guide the movement of the sampler, as shown in Fig. 1c. To address the inherent errors in mechanical arms, a robust vision-based pose measurement method is designed following the pipeline for 6D pose estimation. Finally, a multi-type error compensation method is designed using different measurement information to fine-tune the pose of the sampler, eliminating the need for additional manual analysis. The proposed method demonstrates high accuracy and efficiency in practical lunar sampling. By significantly simplifying manual operations and effectively utilizing visual information, the designed methods achieve a significant reduction in time cost while maintaining high sampling quality in the Chang’e-6 mission.
-
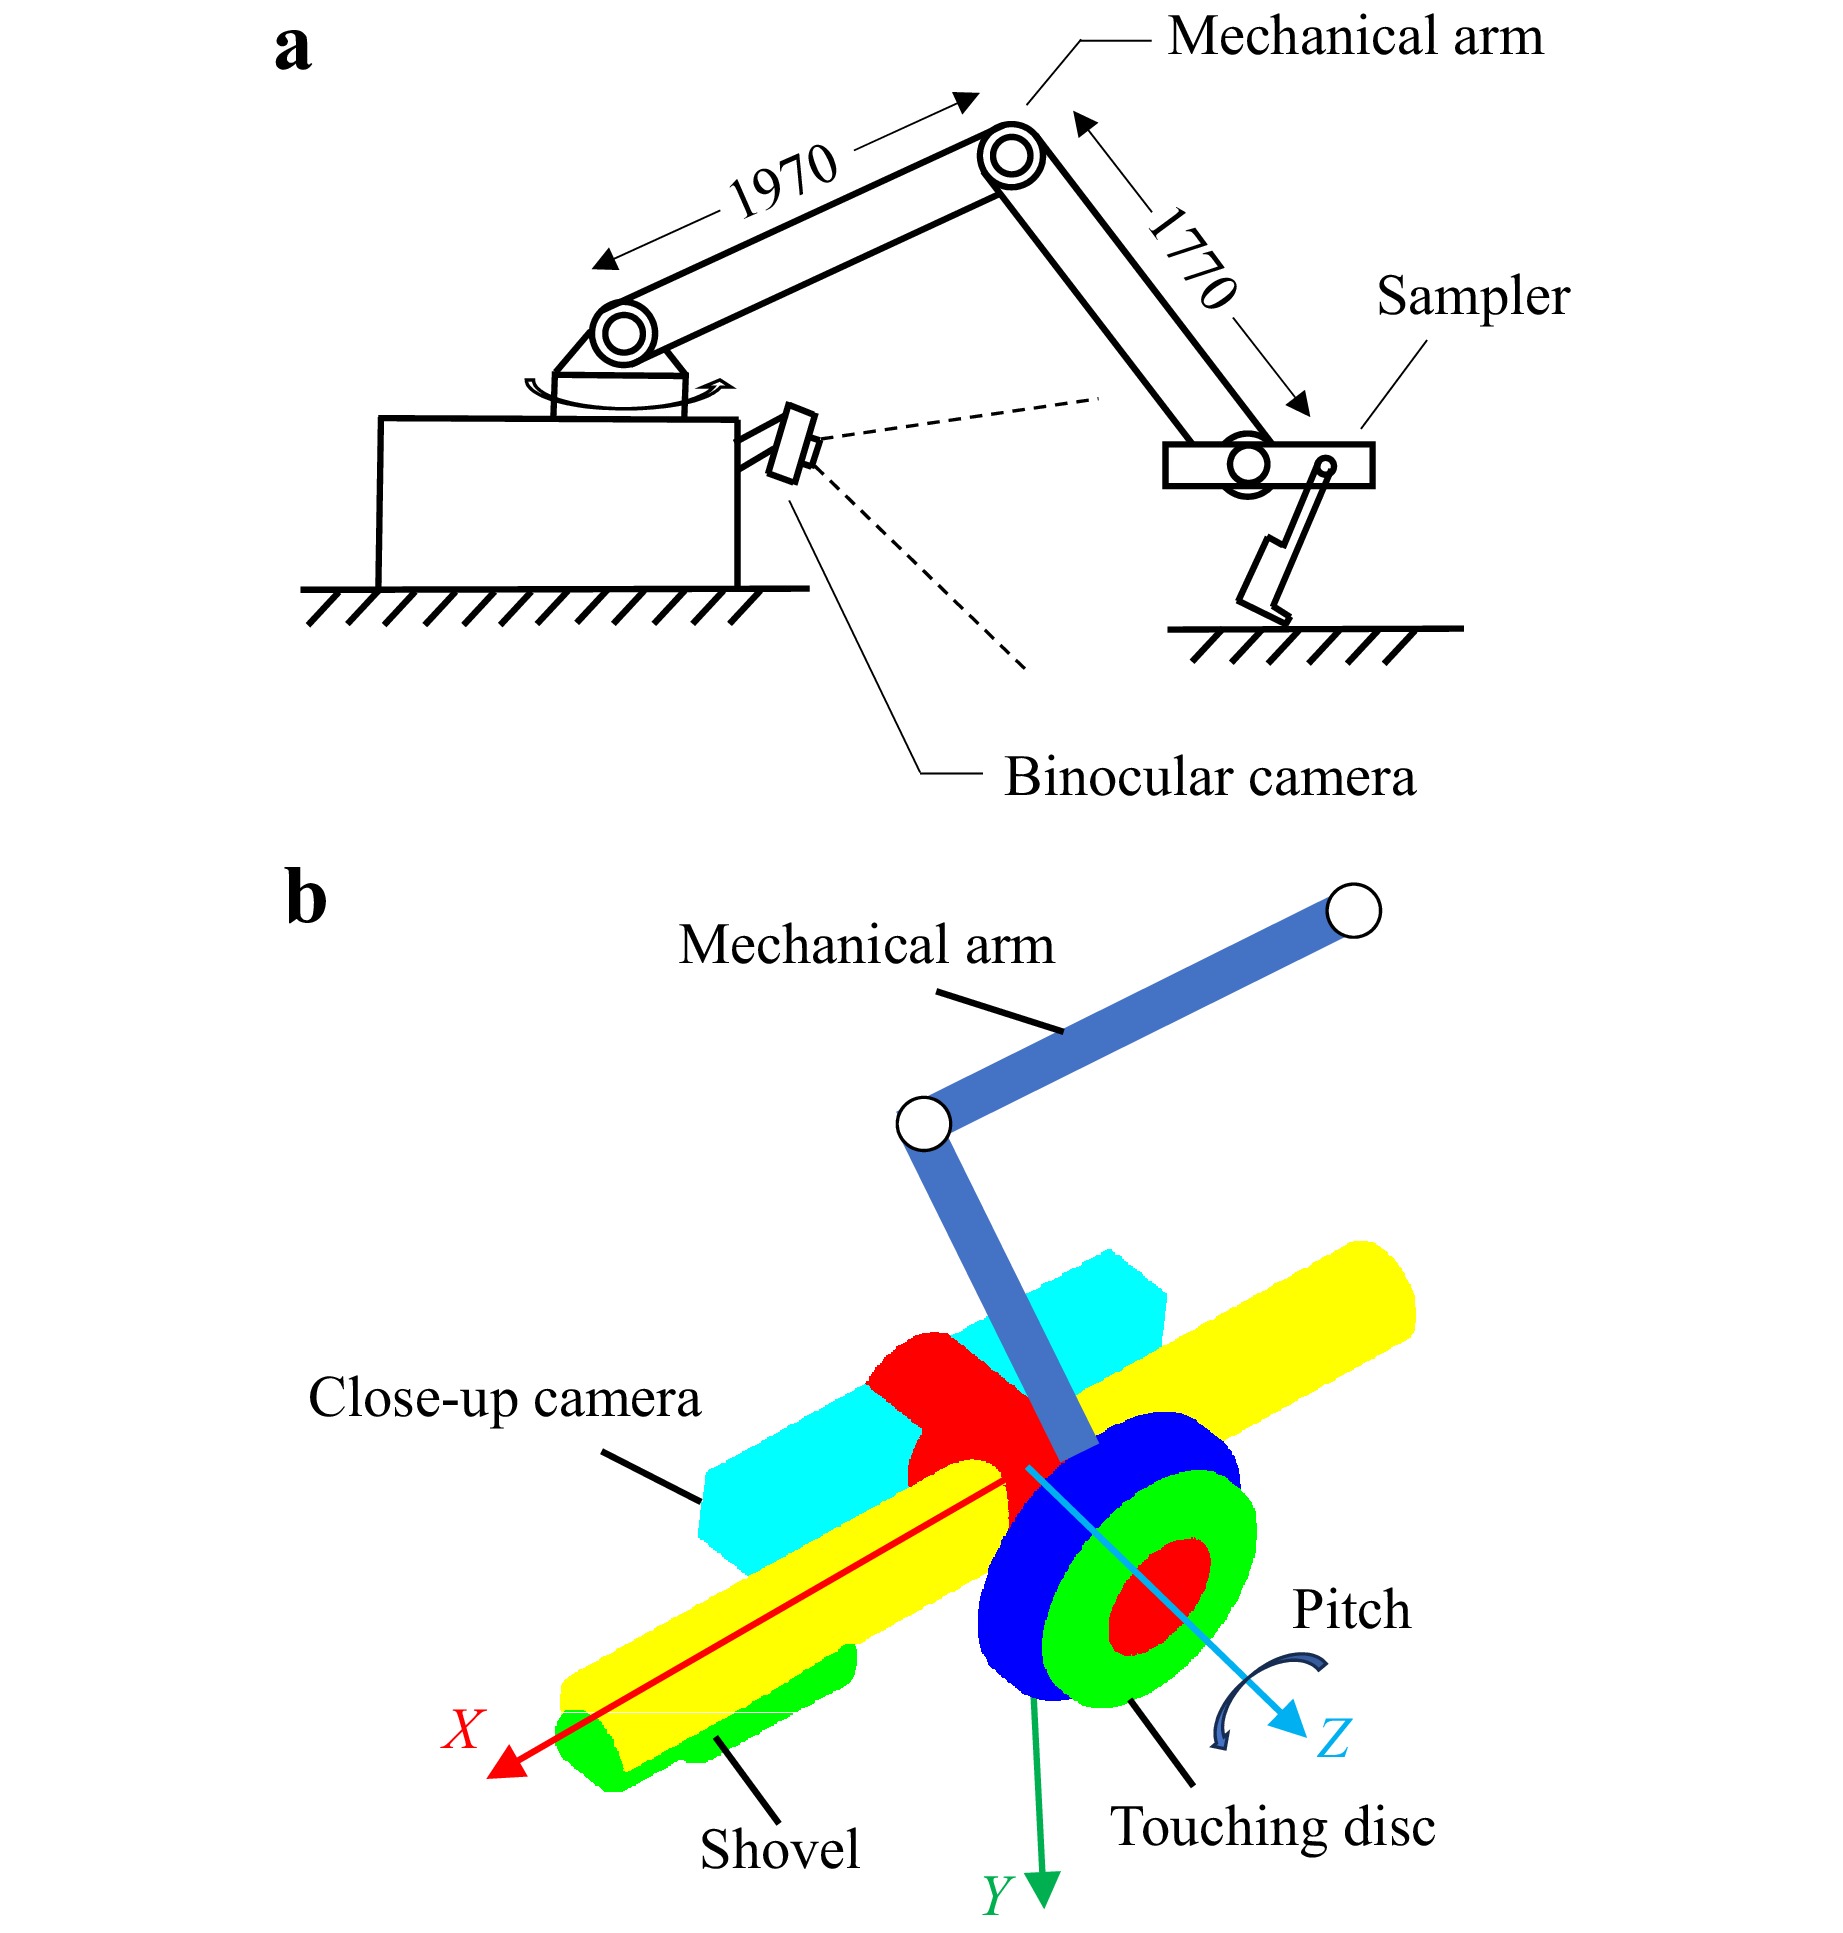
The sampling implementation system of the Chang’e-6 consisted of a mechanical arm with four degrees of freedom, a sampler, and a binocular camera, as shown in Fig. 2a. During sampling, the mechanical arm moved the terminal scooping sampler to the target location, whereas the binocular camera monitored the region and collected images. The mechanical arm had four joints and was connected to the sampler by joint 4. Owing to the motion limitations of the mechanical arm, the valid sampling region was a sector. The specific structure of the sampler is shown in Fig. 2b, which consisted of a touching disc, shovel, and close-up camera. A force sensor was installed at the bottom of the touching disc to indicate whether the sampler has touched the lunar surface. The close-up camera on the sampler has a narrow field of view, and is mainly used to monitor the sampling and check the sampled lunar soil. Using a front-end shovel, the sampler collected and transferred the samples to the container. There are multiple reference coordinate systems in the sampling implementation system. For clarity, the mechanical arm coordinate system was used to describe the 3D poses in the following sections, and the position and pitch angle were used to describe the pose of the sampler.
-
During the sampling process, it was crucial to avoid collisions or terrain interference while the sampler was moving. In addition, the sample points were located in flat areas to make it easier for the sampler to reach the target location and collect an appropriate amount of lunar soil. Therefore, information on the terrain properties and obstacle positions was necessary for safe and high-quality sampling.
In this system, 3D terrain data were collected using the binocular camera. Using the image pairs collected by the binocular camera shown in Fig. 3a, the depth was estimated using a learning-based stereo matching method and the 3D point cloud of the sampling region was reconstructed, as shown in Fig. 3b, c. Using the point cloud, the slope information of the region was analyzed, which characterized the degree of relief of the local terrain. The slope was measured using the angle between the normal vectors of the tangential and horizontal planes of a point. In the point cloud, the neighbors of each point were searched for within an appropriate radius on the XOY plane and the plane of the neighboring areas was fitted to obtain their normal vectors. The slope and slope orientations at each point were calculated using the obtained normal vectors. The slope distribution of the reachable sampling region was then calculated during the Chang’e-6 mission. The terrain point clouds and the corresponding slope maps are shown in Fig. 4a, b, respectively.
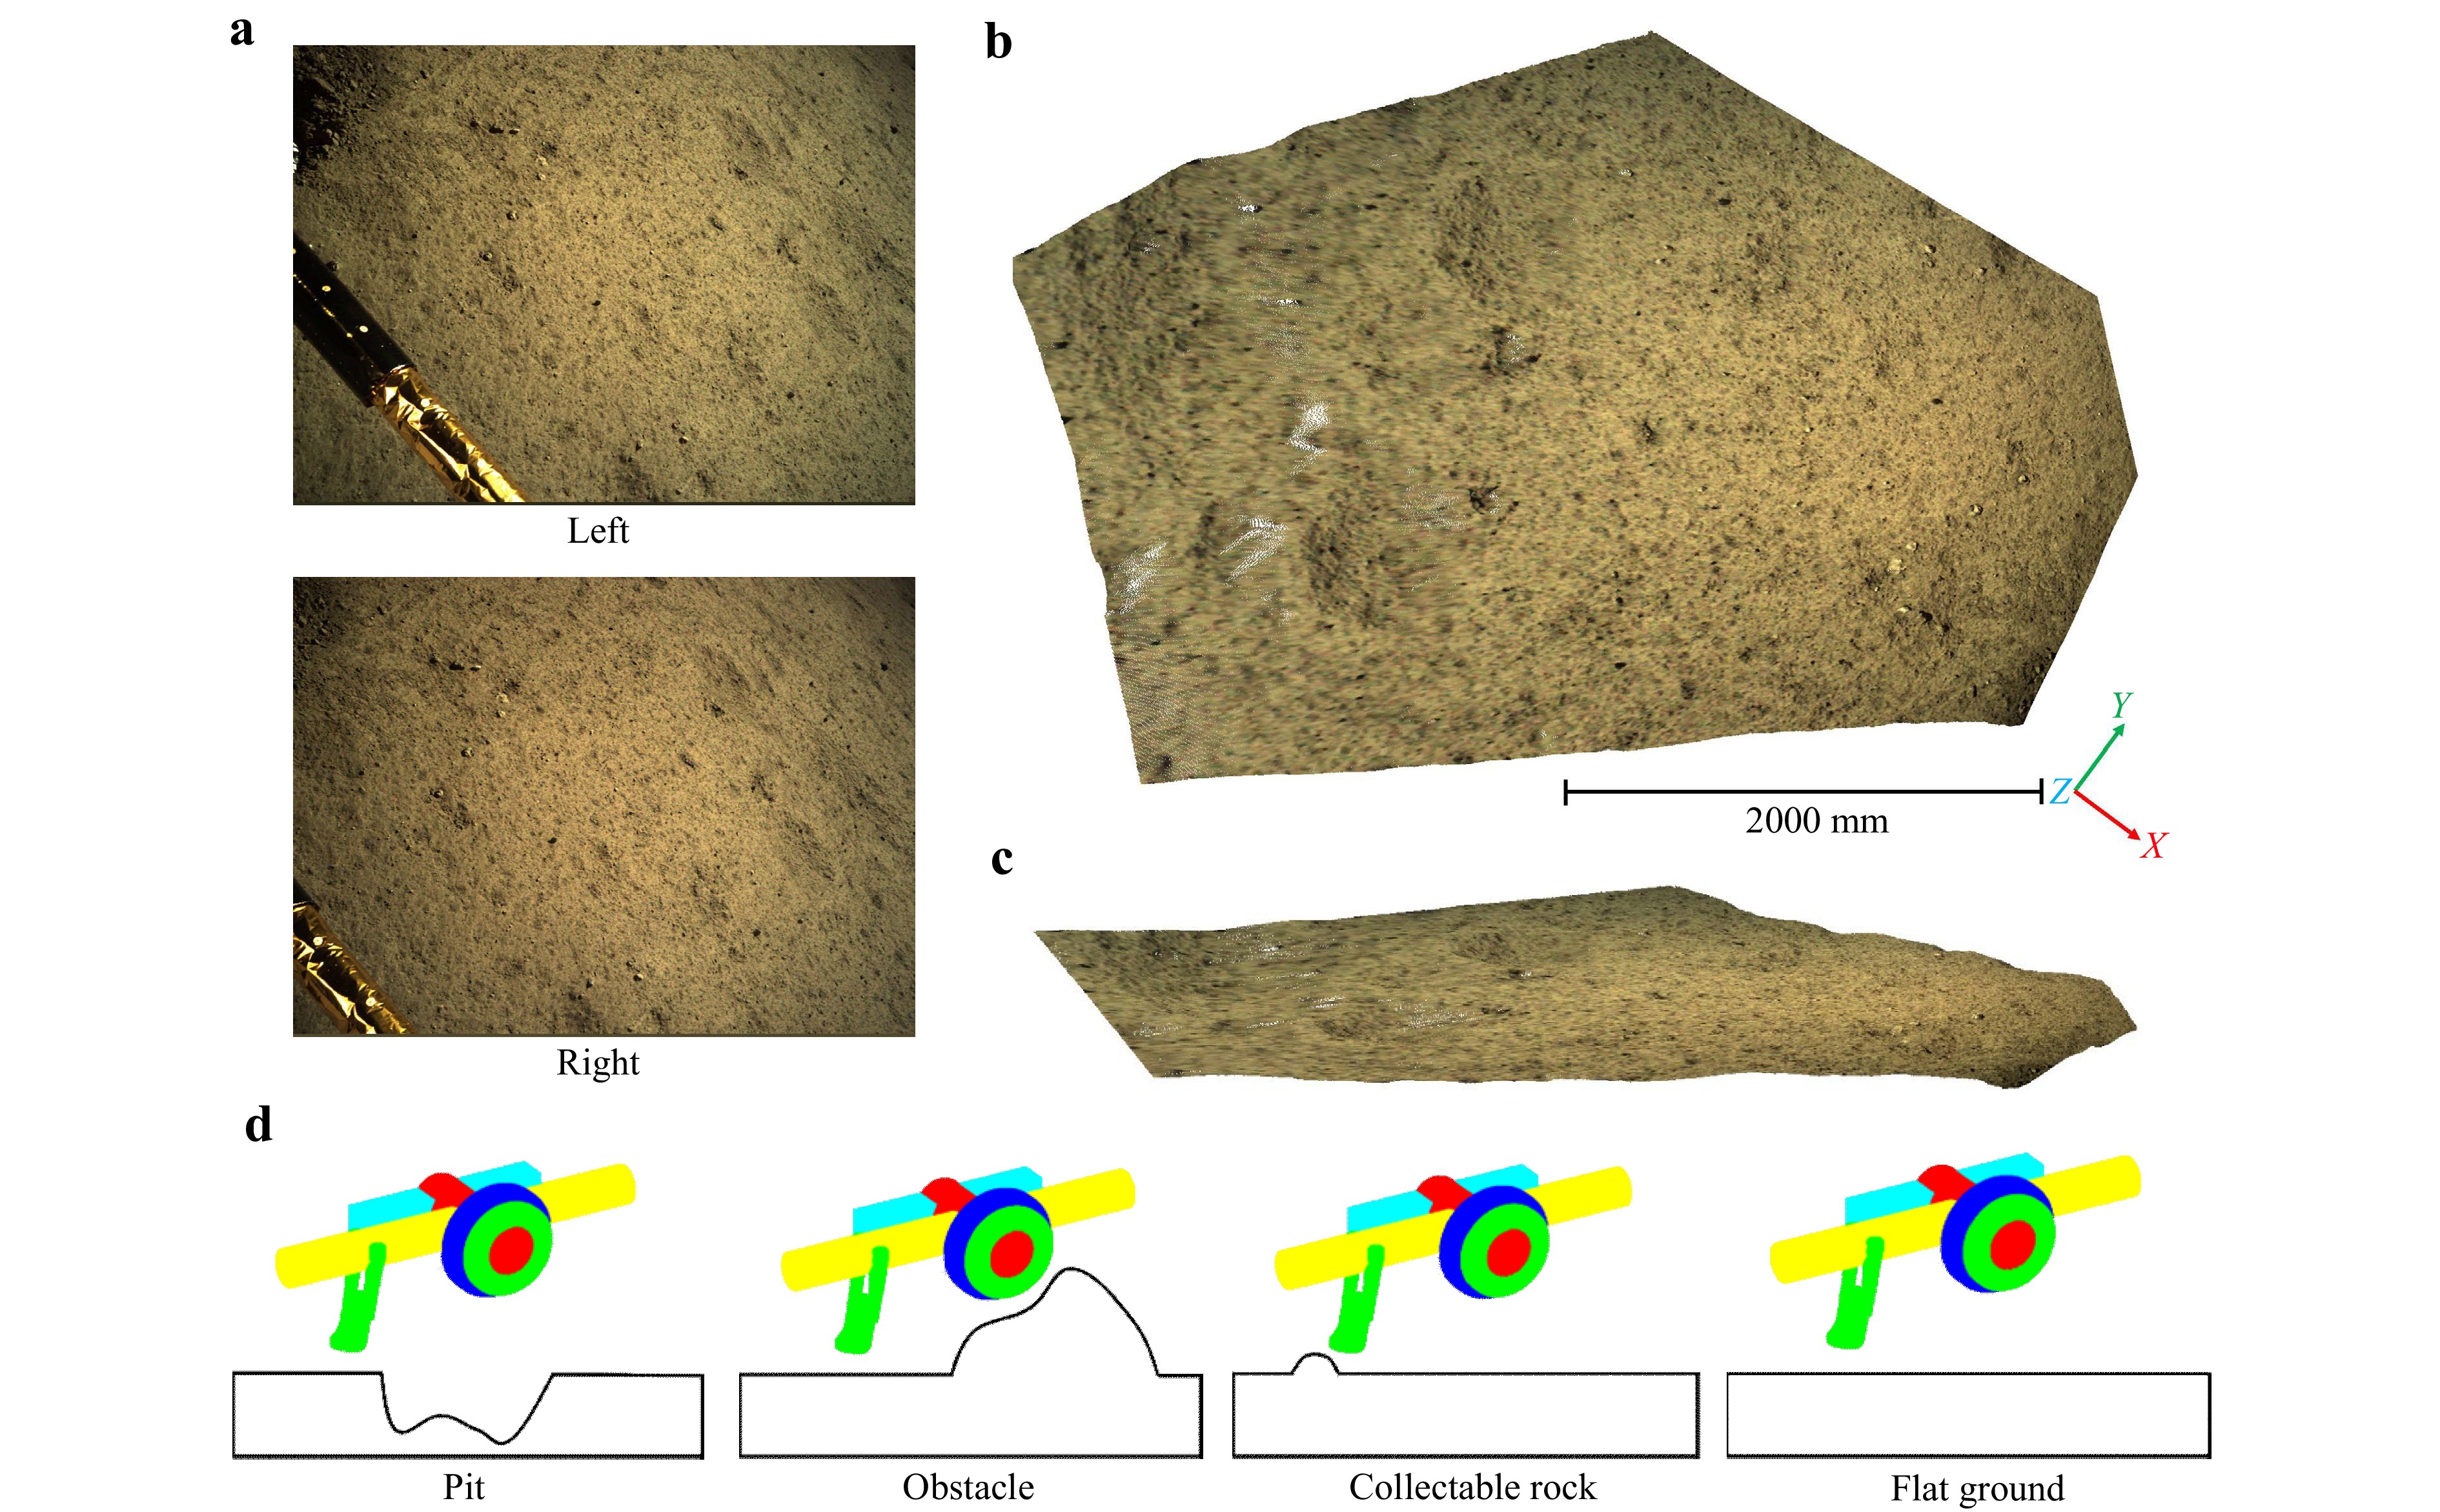
Fig. 3 Reconstructed 3D point cloud data for terrain analysis. a Lunar image pair collected by the binocular camera in the Chang’e-6 mission. b Top view of the reconstructed point cloud of the lunar terrain. c Side view of the reconstructed point cloud. d Four types of local terrain in scooping sampling.
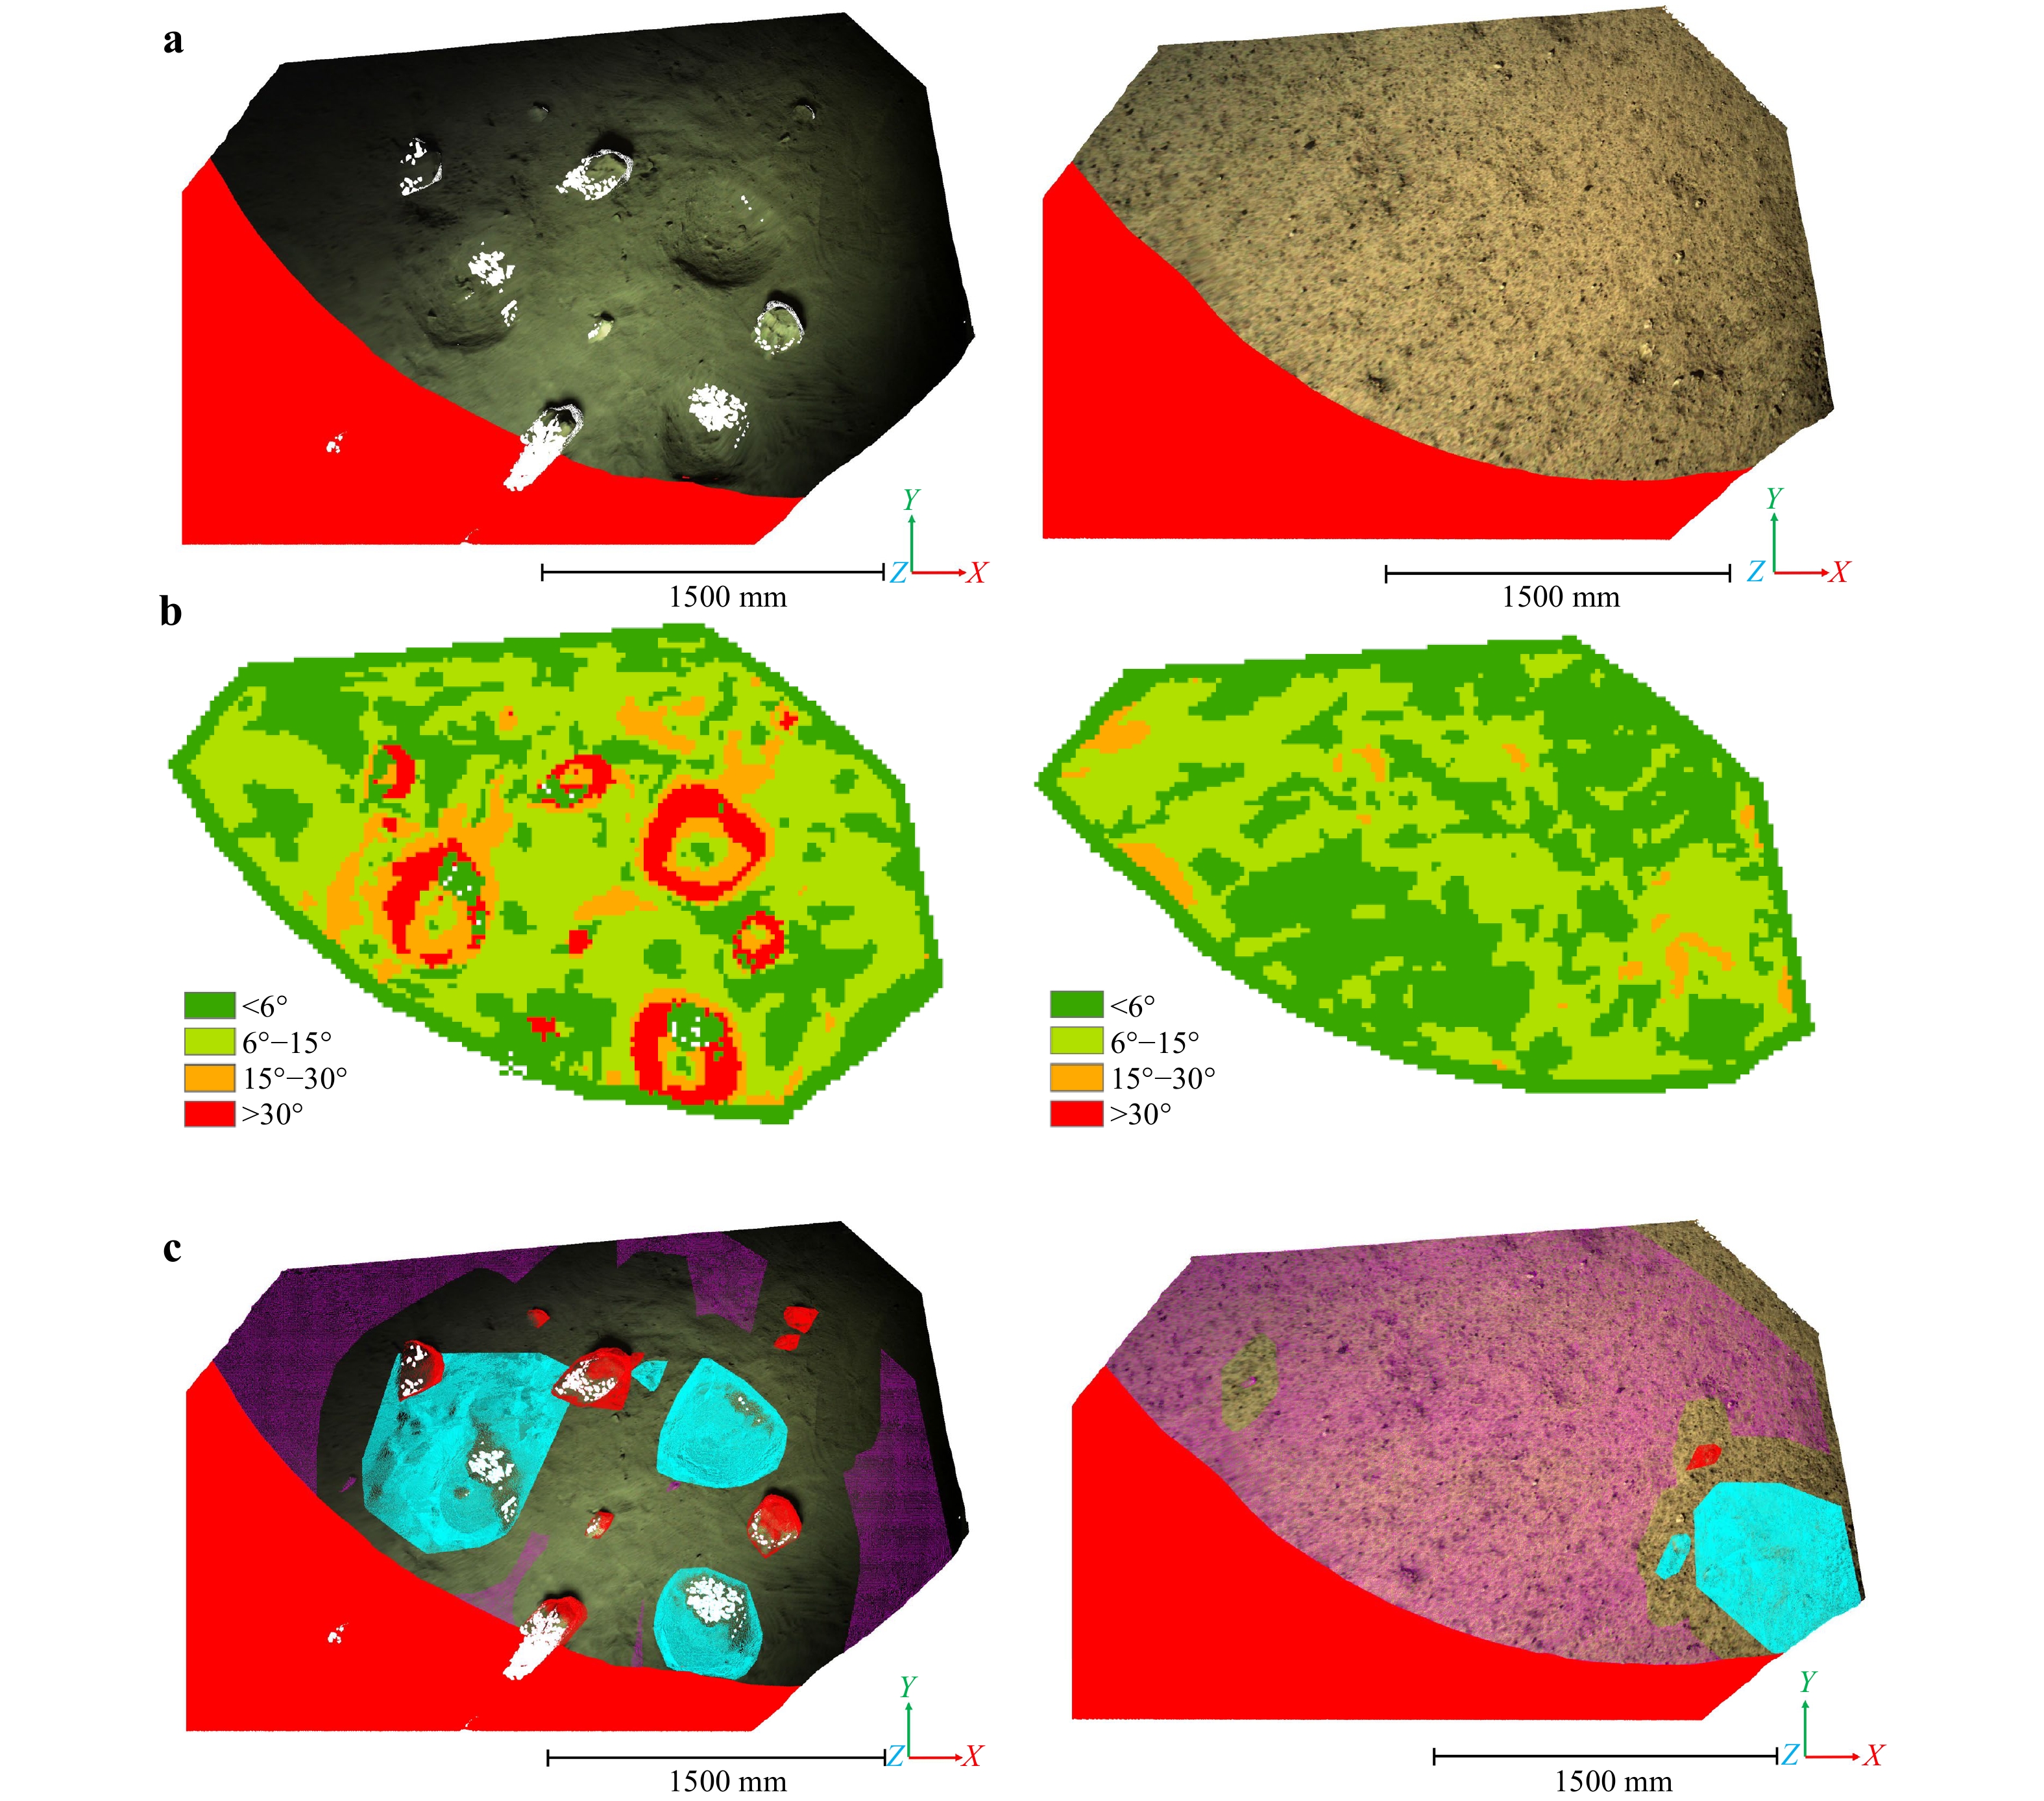
Fig. 4 Terrain analysis results. a Terrain point clouds of testing ground (left) and lunar sampling region (right). White areas are the occluded regions which have almost no valid reconstructed points. b Slope maps of the terrain point clouds. c Obstacles and pits in the terrain. Purple indicates the collectable area, red indicates the obstacles or unreachable area, and cyan indicates the pits.
The local terrain was divided into four categories, as shown in Fig. 3d. A basic principle of the sampling process was to ensure that the sample points were away from obstacles or pits because any terrain interference may have posed a hazard to the sampler. Therefore, it was necessary to determine the positions of the possible obstacles in the sampling region.
Using the terrain point cloud, the progressive morphological filter (PMF) was first applied to identify non-ground points34, which may have been the points of obstacles or pits. An octree was then used for cluster segmentation, dividing the non-ground points into several clusters. A slope check was applied to each cluster to find neighboring points with obvious slope changes, helping to identify the boundary points of each obstacle or pit. Once the boundaries were confirmed, all the obstacles or pit points were extracted from the terrain point cloud. Specifically, points lower than the surrounding terrain were classified as pit points and points higher than the surrounding terrain were classified as obstacle points. Additionally, obstacles smaller than a certain threshold (mainly depending on the size of the sampler shovel) were classified as collectible rocks. The obstacle segmentation results for the Chang’e-6 mission are shown in Fig. 4c.
-
Based on the results of the terrain analysis, a method was designed to automatically identify potential sample points. As mentioned previously, the slope effectively reflects the degree of relief of the local terrain. Regions with large slopes are likely to be rough and, therefore, unsuitable for the sampling process. In addition, obstacles and pits pose hazards to the sampler during the sampling process, as illustrated in Fig. 5a. Using the obstacle segmentation results, the risk regions on the terrain were marked, where no sample points should be placed. Furthermore, because of the absolute error in the end-position movement of the mechanical arm, it was necessary to maintain a safe distance between the sample points and risk regions. Therefore, the loss function for a safe distance was calculated as follows:
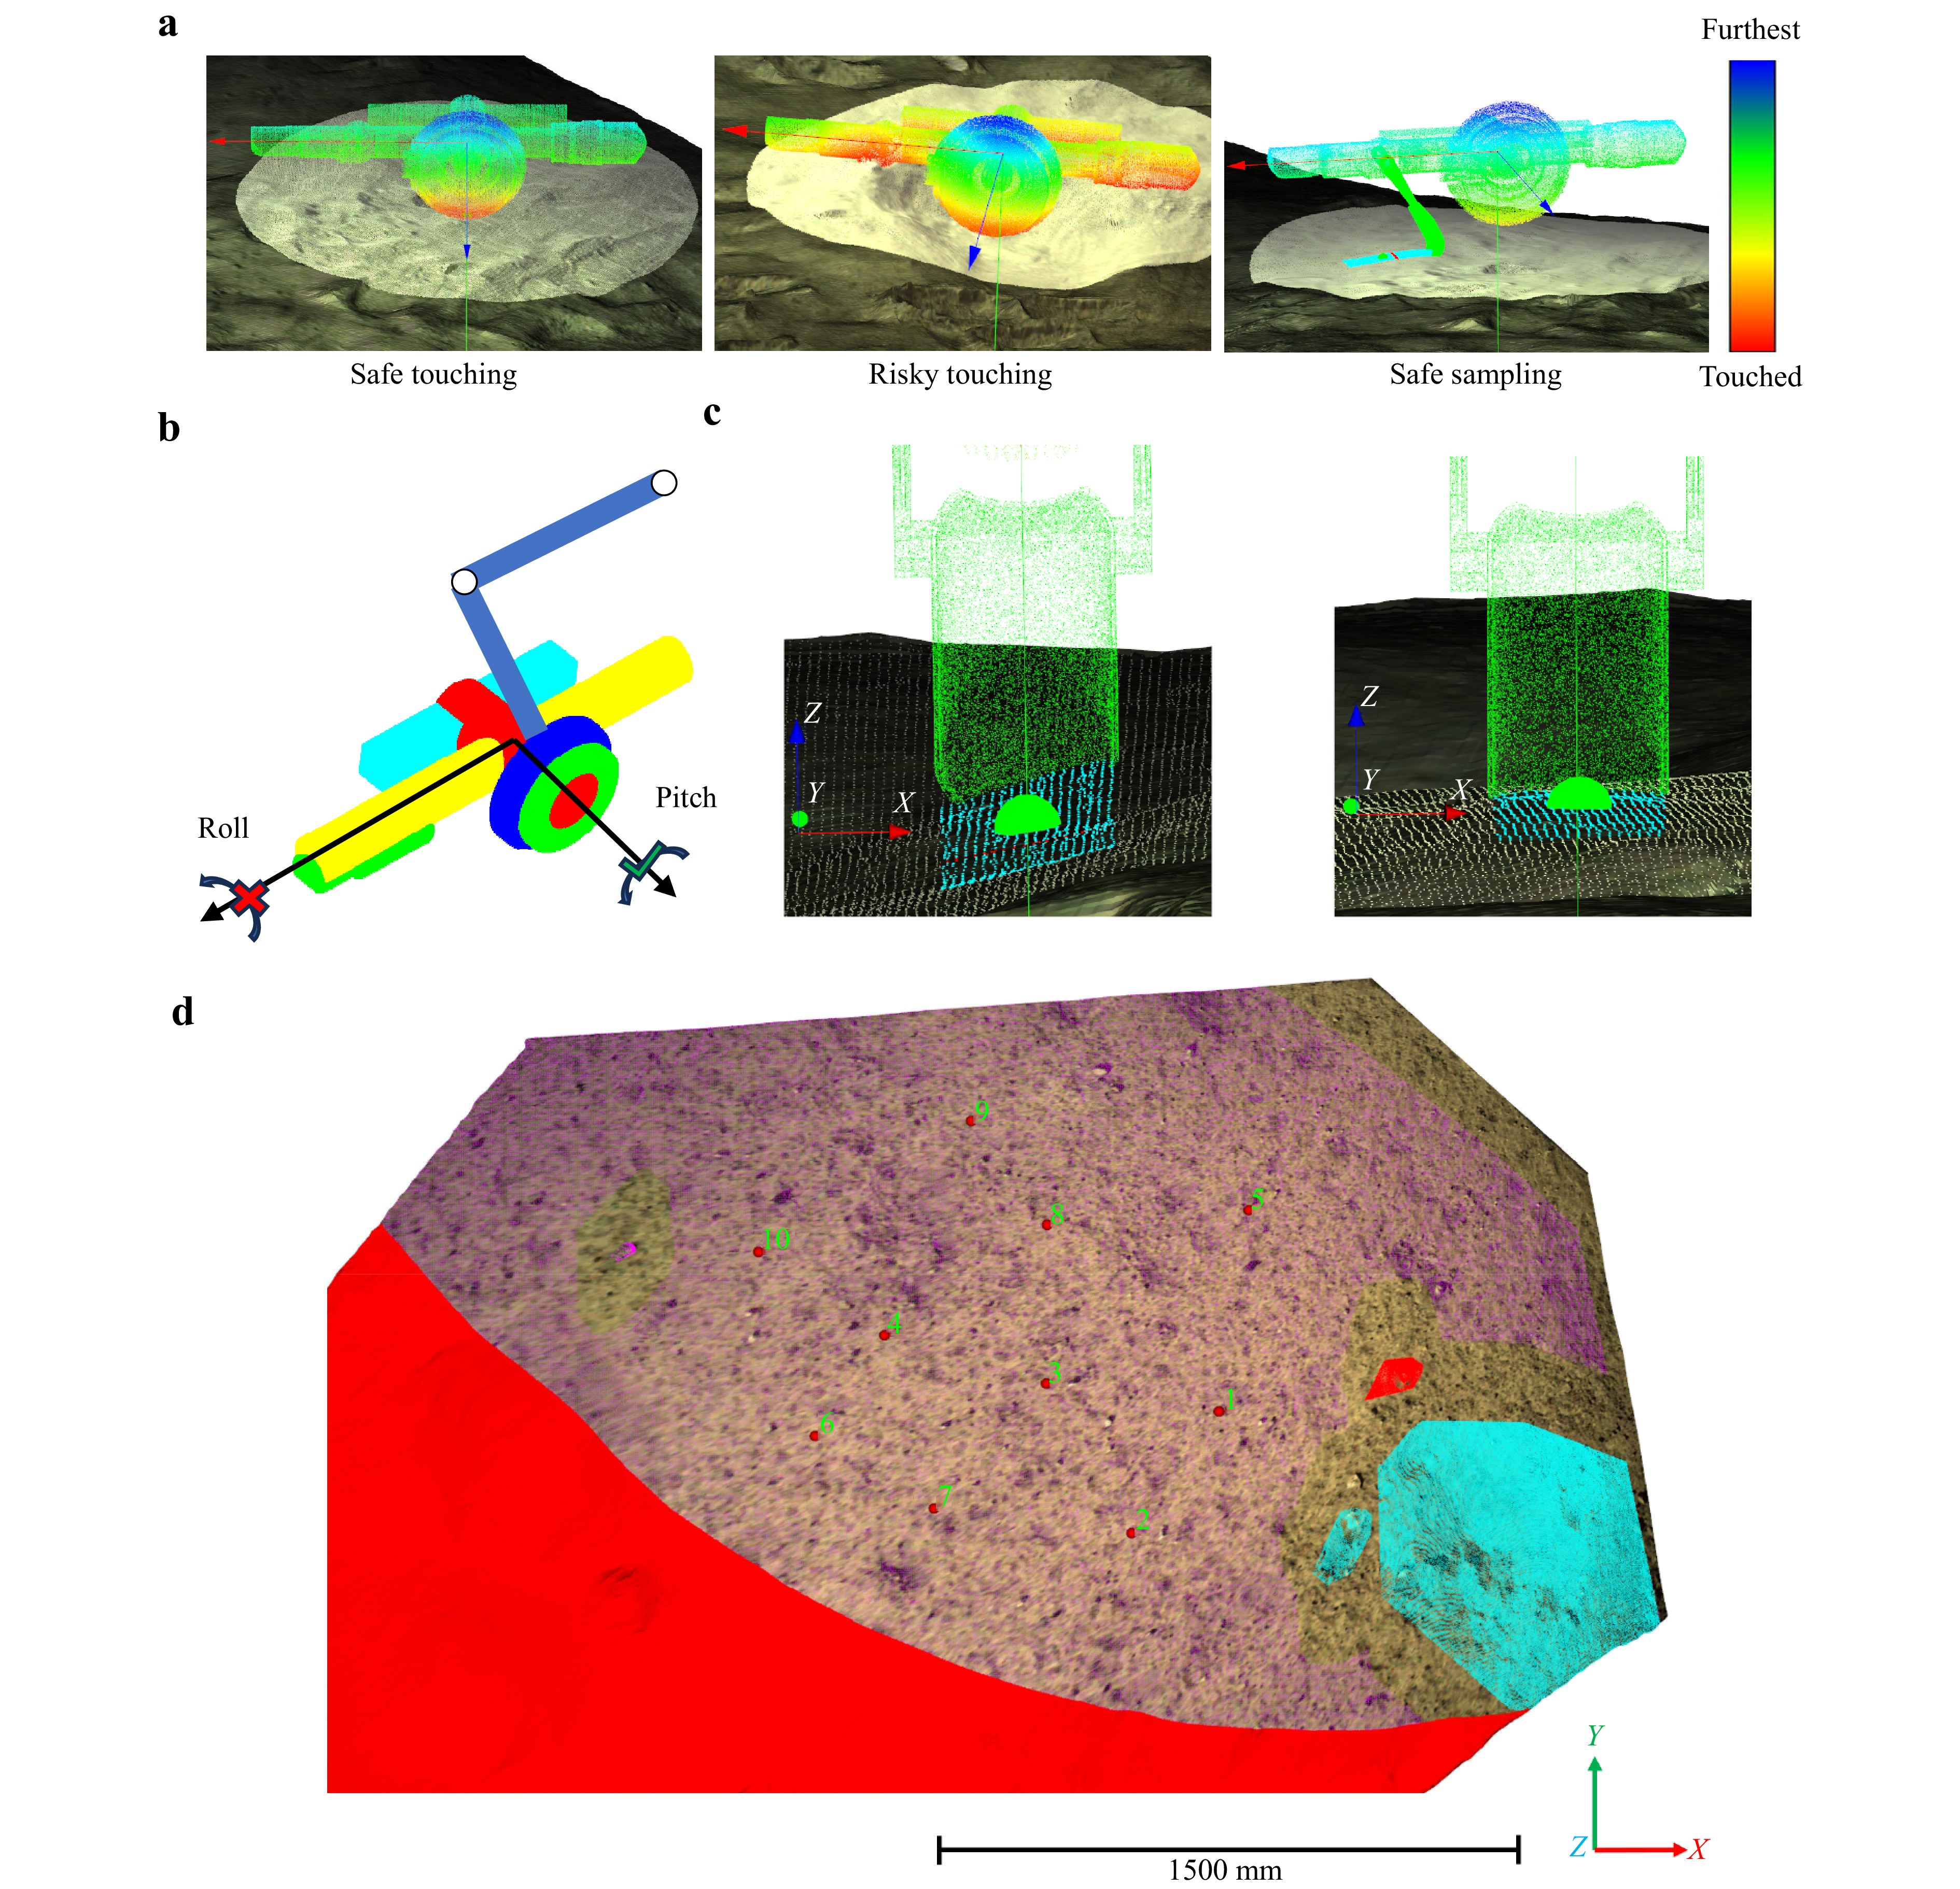
Fig. 5 Sample point selection factors. a Obstacles and pits may pose hazards to the sampler. For example, safe touching (left), risky touching (middle) and safe sampling (right). The color denotes the distance from the terrain, red areas are close or touched, while blue areas are further from the terrain. b Sampler cannot adjust the roll angle. c Slope along the roll direction will hinder the control of the scooping depth (left), sample point should have a low slope along the roll direction (right). d Sample points selection results based on the analysis in Fig. 4c. Ten sample points were provided for operators to rapidly determine the sampling plan and sequence, the numbers denote the planned sampling sequence.
ldis=max(d0−dd0,0) (1) where d0 is a predefined threshold representing the maximum safe distance, and d is the distance between the sample point and nearest risk region.
In addition to the aforementioned factors, the slope component in the roll direction of the sampler was also considered. Due to the four degrees of freedom of the mechanical arm, the sampler could only adjust its pitch angle, as shown in Fig. 5b. The slope in the roll direction hindered the control of the scooping depth, as illustrated in Fig. 5c. Furthermore, the sample points should be away from the boundary of collectable area, which depends on the reachable region of the mechanical arm and the boundary of the reconstructed point cloud. This was achieved with an extra loss lbound, which was calculated similarly to ldis, using the distance between the sample point and constrained boundary. Therefore, the overall loss function was designed as follows:
l=w1τ+w2ldis+w3τroll+w4lbound (2) where τ is the normalized local slope, τroll is the slope component in the roll direction of the sampler, and w1,w2,w3, and w4 are weights for the four factors. The four weights were all set to one in the experiment because these four factors were equally important in the Cheng’e-6 mission. In other cases, the weights were adjusted according to the specific demand. For example, w3 was set to a low value if the slope component in the roll direction had a minor impact on the sampling. Additionally, a minimum point-spacing constraint was imposed to prevent sample points from collecting. Using the simulated annealing algorithm (SA)35, ten sample points with low loss values were selected, as shown in Fig. 5d and Table 1. d0 was set to 400 mm. Each point and its neighboring areas were selected for sampling. In the Chang’e-6 mission, these ten sample points were used to plan the sampling process. During the entire operation, points 1-3 and their neighboring areas were scooped to collect the lunar soil.
1 2 3 4 5 x −276 −500 −715 −1137 −197 y −1947 −2255 −1868 −1743 −1419 z −2080 −2109 −2096 −2102 −2030 slope 6.1° 3.5° 6.1° 3.3° 4.4° loss 0.98 0.88 0.59 0.48 0.77 6 7 8 9 10 x −1317 −1009 −718 −916 −1463 y −2004 −2191 −1457 −1186 −1527 z −2117 −2118 −2049 −2031 −2076 slope 3.3° 3.9° 4.9° 4.7° 5.8° loss 0.93 1.04 0.73 1.28 1.29 Table 1. Coordinates in the mechanical arm coordinate system (mm), local slope and loss values of the ten selected sample points. The average slope of the entire sampling region was 5.1°.
-
After confirming the sample points, the mechanical arm moved the sampler to the target location and initiated sampling. During this process, determination and control of the pose of the sampler were crucial. However, due to the inherent absolute error of the mechanical arm, it was necessary to use additional measurements to determine the accurate pose of the sampler. In the Chang’e-6 mission, images collected using a binocular camera were used to measure the pose of the sampler.
Due to the structure of the sampler, varying light directions, and protective outer wrapping materials, measuring the pose by detecting pre-designed target corners or geometrical shapes is not robust. Therefore, the pipelines of 6D pose estimation were followed and the point cloud data of the sampler were used for pose measurement. As shown in Fig. 6a, using the image pairs collected by the binocular camera, the 3D point cloud of the sampler was reconstructed. The learning-based object detection method You Only Look Once (YOLO) v5 was employed to identify the region of interest (ROI) and reduce the time cost for 3D reconstruction36. The features were then extracted using feature descriptors and correspondences were established between the reconstructed and template sampler point clouds. The global registration method truncated least squares estimation and semidefinite relaxation (TEASER) and the fine registration method iterative closest point (ICP) were used for correspondence-based point cloud registration and to estimate the transformation matrix T between the two point clouds31,37. The position x,y,z and pitch angle α of the sampler were then calculated from the transformation matrix T. Due to occlusion and highlight regions, the valid region of the reconstructed point cloud was much smaller than the template point cloud, which negatively affected correct point cloud registration. Therefore, once correct registration between the reconstructed and template point clouds was confirmed, the template point cloud was replaced by the current reconstructed point cloud for subsequent registrations. The current estimated transformation matrix T was then used to transform the relative pose between the two reconstructed point clouds into the pose in the coordinate system of the mechanical arm.
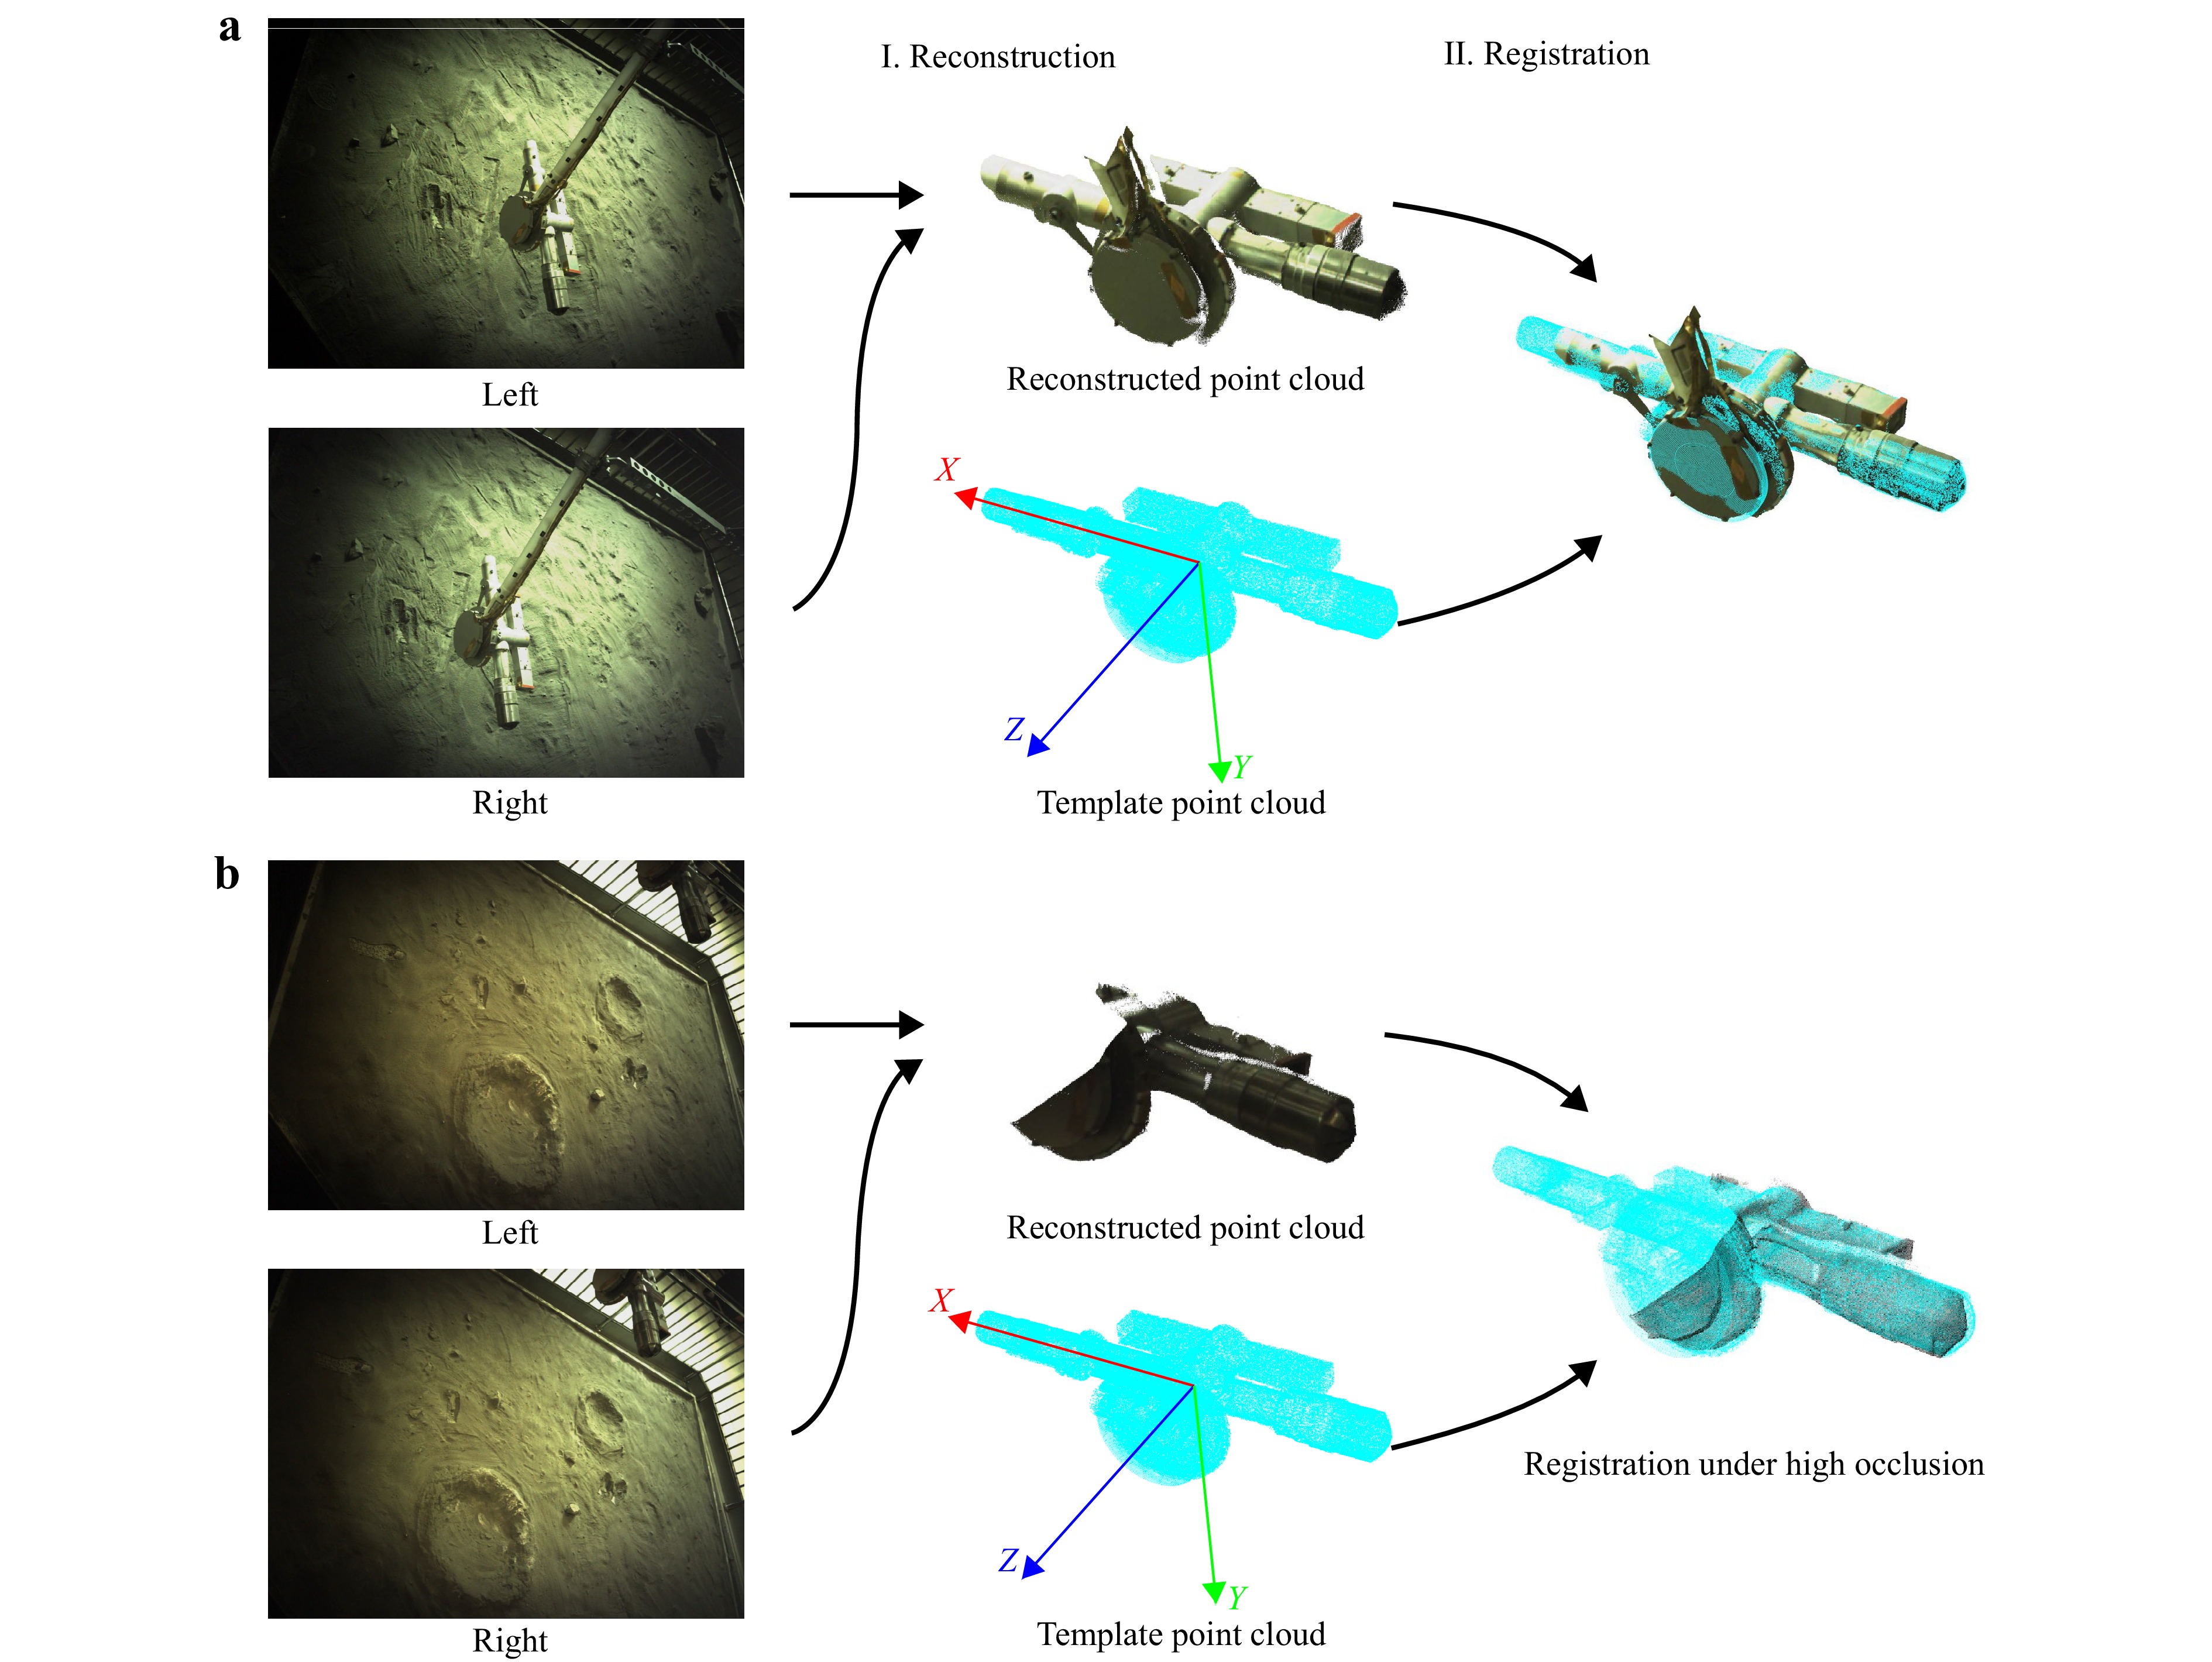
Fig. 6 6D pose estimation pipeline. a Image pairs collected by the binocular camera were used to extract point clouds of the sampler. Point cloud registration was then performed for reconstructed and template sampler point clouds. The pose of the sampler was then determined. b The estimation method can handle cases with high occlusion.
In the experiments, the vision-based sampler pose measurement achieved a precision of 1.1 mm and 0.4°. In the relative distance error test, the method exhibited an average error of 3.4 mm for measuring movements between 300-450 mm, and an average error of 2.0 mm for measuring movements between 100-200 mm (fine-tuned distance). The average time required for pose measurement was 1.6 s. Additionally, this method was used to handle cases with high occlusion. As shown in Fig. 6b, correct registration and pose measurements were achieved with < 30% of the valid region visible. Although the sampler was captured well by the binocular camera in most cases, the method remains applicable in challenging scenarios, ensuring robustness and reliability.
-
As shown in Fig. 7a, during the sampling process at a sample point, the first step was to determine the target pose. The mechanical arm then moved the sampler to an approximate position. Owing to the absolute error of the mechanical arm, the midway movement maintained a large height difference from the sample point to ensure safety, followed by a touching moon step to reach an approximate position. As shown in Fig. 7b, the sampler moved downward until the force sensor on the touching disc detected contact with the lunar surface. In this step, the lunar surface height was approximately determined. The sampler was then raised and moved above the planned sampling position. Finally, a fine-tuning process was applied to adjust the pose of the sampler for accurate sampling. Image pairs were collected using a binocular camera when the sampler was in contact with the lunar surface and positioned above the sample point. The fine-tuning movement was implemented only once during the process.
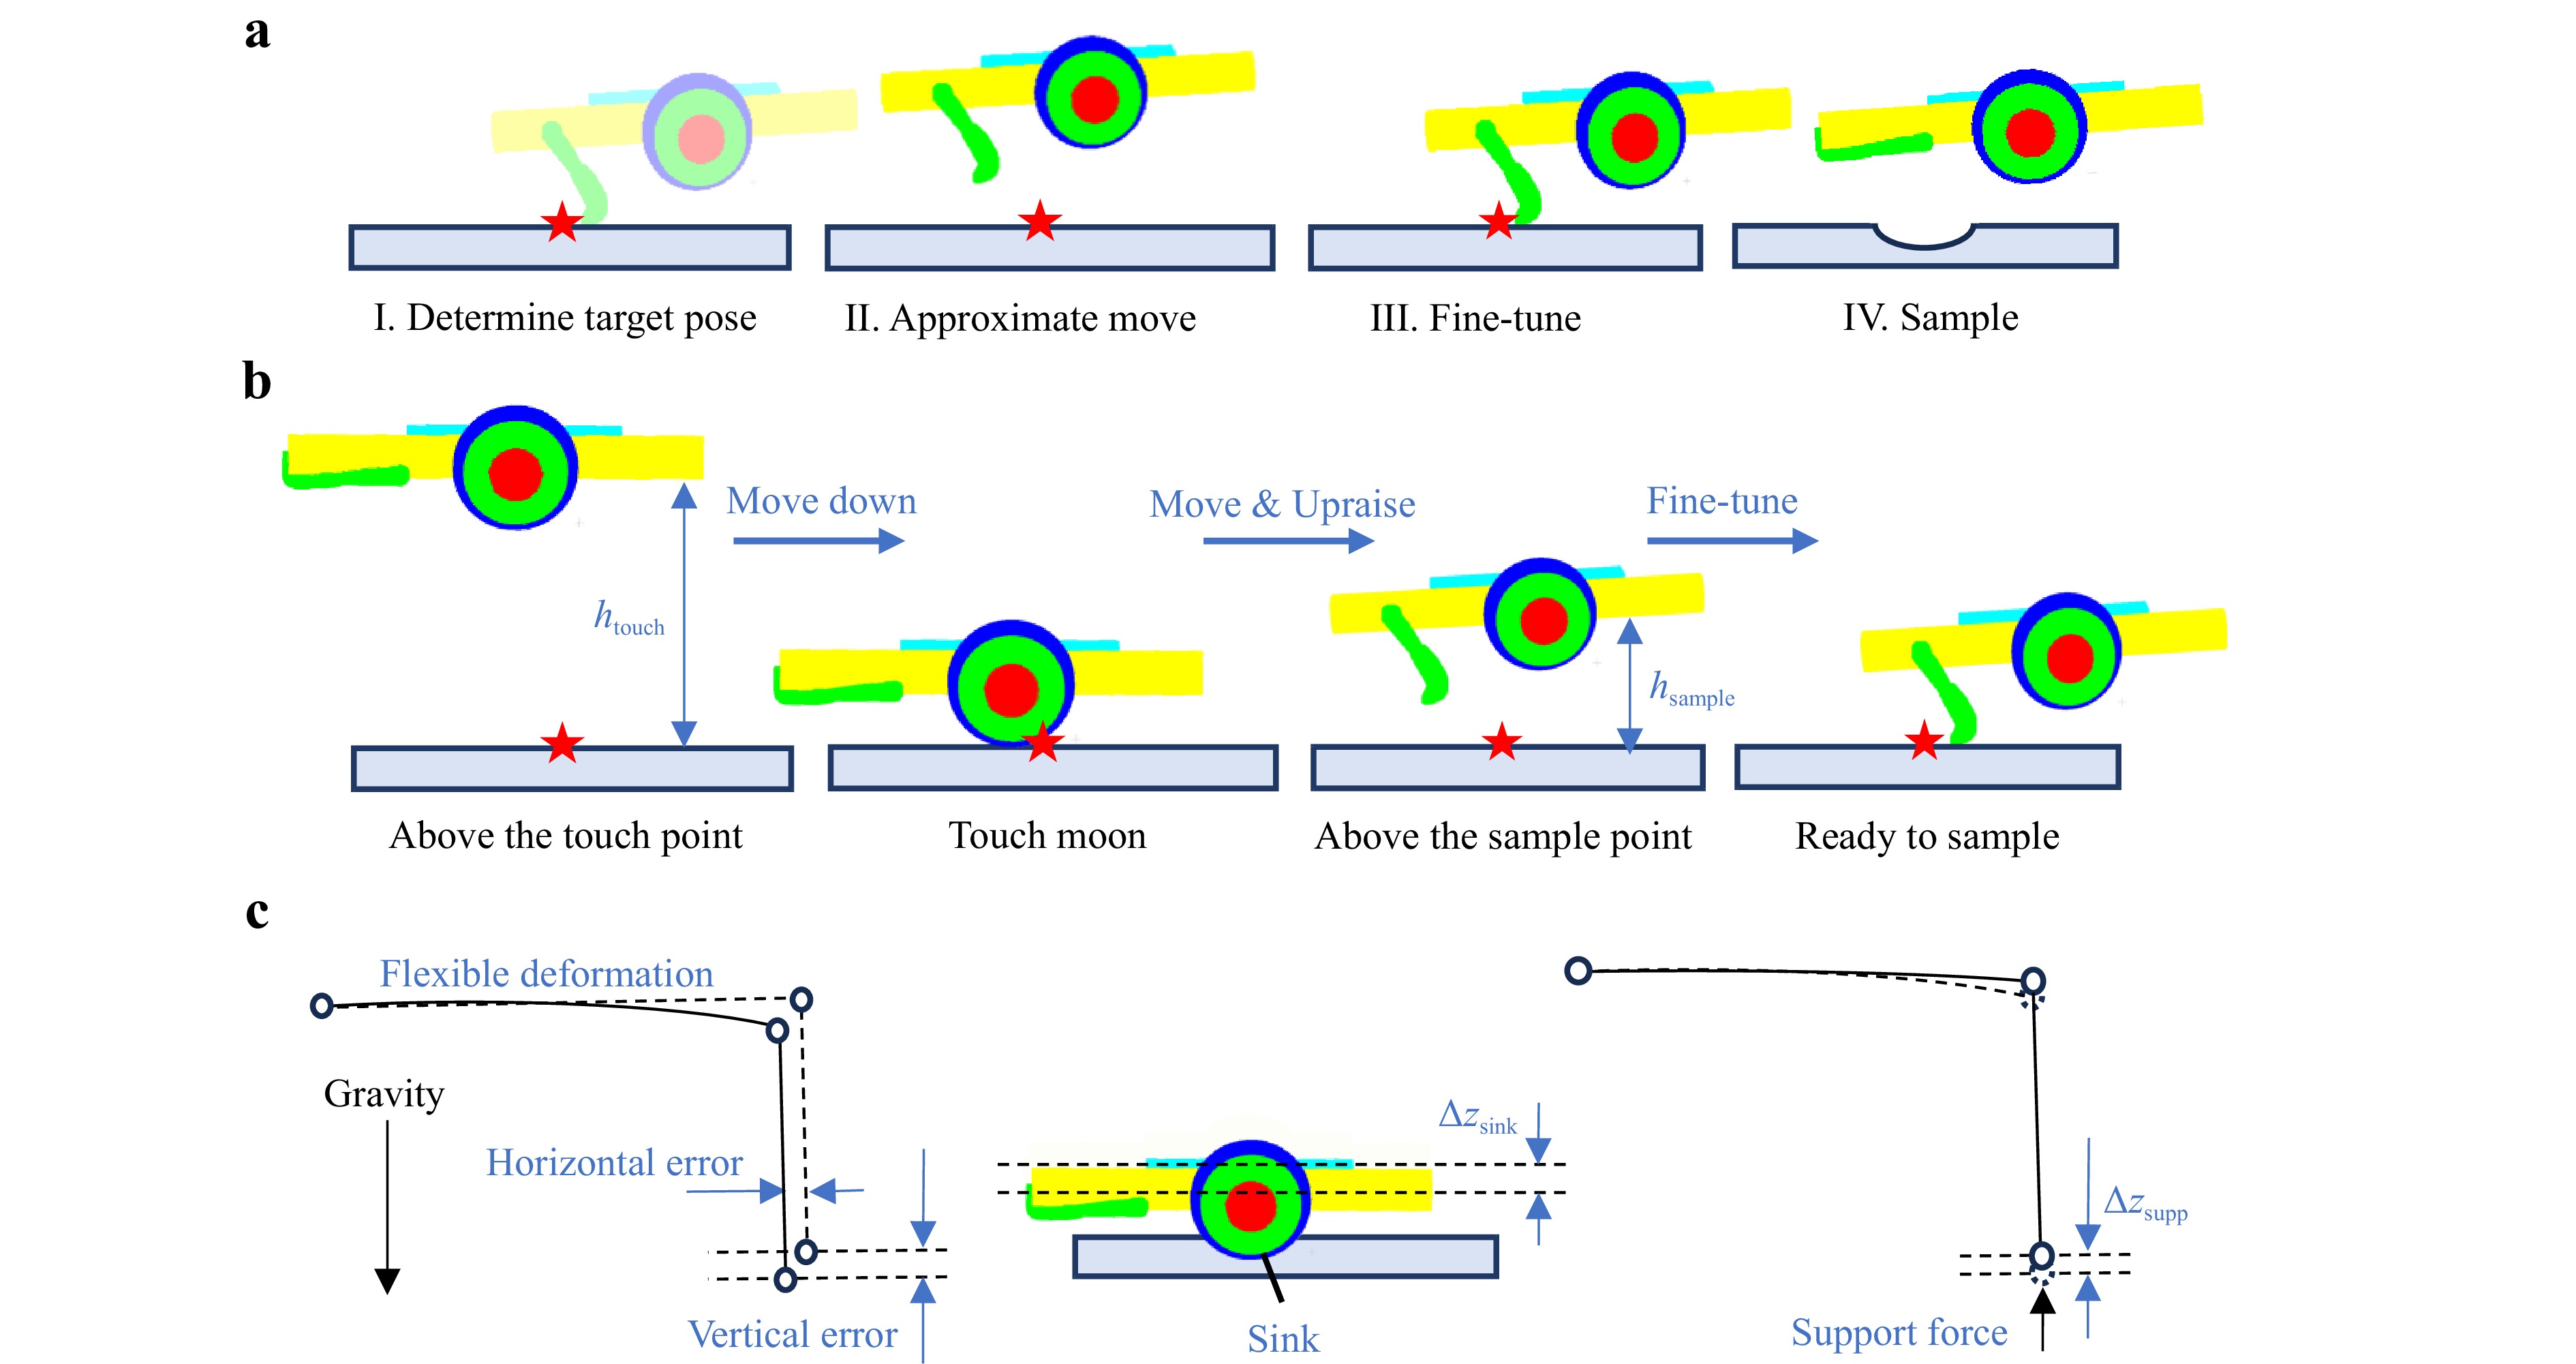
Fig. 7 Fine-tuning in the sampling process. a Four main steps of the sampling process for a sample point. b Detailed movement during approximate move and fine-tune steps. c Main errors in the sampling process, including flexible deformation, sink, and support force errors.
In the whole process, fine-tuning was the most important part to achieve high sampling quality. The purpose of fine-tuning was to ensure that the actual scooping position and depth matched the expected position and depth, thereby achieving accurate sampling with a suitable sample volume. First, the optimal pose for the target sample point was determined. Due to the structure of the mechanical arm and the sampler, the target direction angle ψ was calculated as follows:
ψ=arctan(y0x0)+arcsin(q1+q2+q3√x20+y20) (3) where (x0,y0,z0) are the coordinates of the target sample point, and q1,q2, and q3 are the width offsets of joints 2-4 of the mechanical arm. After confirming the target direction angle, the slope component along the direction of the arm at the position of the target sample point was calculated, which is the target pitch angle α of the sampler:
α=arctan(icosψ+jsinψ√i2+j2tanτ) (4) where τ is the local slope of the target sample point and (i,j,k) is the local plane normal vector of the target sample point, which was determined from the terrain analysis results. After confirming the coordinates of the target sample point, direction angle, pitch angle, and scooping depth, the target sampling pose of the sampler was determined. In addition, the pose of the target touching the moon was determined simultaneously and used in the following fine-tuning steps.
Given the target sampling pose, the mechanical arm moved the sampler to the target coordinates. However, owing to the flexible deformation shown in Fig. 7c and other secondary factors, there can be errors of several cm in end localization. This manifests as about 30 mm and 2° absolute error in experiments on Earth, where a ballon would be used to compensate the gravity difference. These errors are difficult to model and significantly affect the sampling quality and scooping depth. Therefore, vision-based pose measurement was used to compensate for the errors and fine-tune the pose of the sampler.
When the sampler was in contact with the lunar surface and stopped moving, multiple factors caused a difference between the current sampler bottom height and the actual lunar surface height, resulting in an error in the z coordinate of the sampler touching the moon pose. One primary factor was the sinking of lunar soil: when the sampler contacted the lunar surface, a small pit was created by squeezing the touching disc, causing the pose of the sampler to be lower than the pose of the target touching the moon, as shown in Fig. 7c. Using the image pair collected by the binocular camera, the current touching moon pose was measured and the offset owing to soil sinking was calculated as follows:
Δzsink=ztouch−zvistouch (5) where ztouch is the calculated target value and zvistouch is the value measured by vision. The value of Δzsink depends on the density of soil and in the experiments on Earth, Δzsink ranges from 5-20 mm under different soil densities.
Another important factor is the support force acting on the touching disc. As the force sensor had a threshold for activation, a support force acted on the touching disc when the force sensor stopped moving the sampler, thereby altering the deformation of the mechanical arm, as shown in Fig. 7c. This factor resulted in an additional z error in movement, which could not be determined solely by the vision measurement of the touching moon pose. Therefore, using the image pair collected at a position above the sample point, the current pose was measured and the offset due to the support force was calculated as follows:
Δzsupp=(zarmabove−zarmtouch)−(zvisabove−zvistouch) (6) where zarmabove and zarmtouch are the terminal positions calculated from the four joint angles of the mechanical arm and zvisabove is the measured value. Eq. 6 can be regarded as the difference between the displacement measured by the mechanical arm and that measured by the vision system. After determining Δzsink and Δzsupp, the target z of mechanical arm was calculated as follows:
zarmtarget=zarmtouch+h+Δzsink+Δzsupp (7) where h is the lifting height, which was determined by the target scooping depth and geometric structure of the sampler. The error of x, y and α was directly determined from the difference between the values calculated from the four joint angles of the mechanical arm and the values measured by the vision system, thus determining the fine-tuned target pose of the sampler for the mechanical arm to move on. Besides, zarmtarget was also calculated in a more direct manner:
zarmtarget=zarmabove−(zvisabove−ztarget) (8) where ztarget is the target value calculated at the sampling position. Using Eq. 8, the touching moon pose measurement was not required. However, this required image pairs collected at the above positions for each sample point. As the soil density was approximately constant across the flat lunar sampling region, and the deformation change caused by the support force varied slightly in a constant gravitational field, Δzsink and Δzsupp were approximated as constants during the sampling process. Therefore, Eq. 7 was used as an additional method to compensate for the z error without requiring additional images for each sample point, improving the accuracy of the scooping depth, which was more critical than the accuracy of x, y. Benefiting from this, once the touching moon process was completed, fine-tuning could be applied to any sample point, even if they were out of the field of view of the binocular camera. Using the close-up camera set on the sampler or the panorama camera set on the probe, the feasible sampling region was greatly enlarged. In a practical sampling process, Eq. 8 was used to achieve more accurate fine-tuning of the sample points with the available image pairs. For sample points without available collected images or unscheduled points outside the field of view of the binocular camera, Eq. 7 was used for partial fine-tuning.
In the experiments on Earth, fine-tuning achieved an average error of 3.8 mm in the scooping depth; parts of the results are shown in Fig. 8. The accuracies of the offsets used in Eq. 7 were influenced by factors, such as terrain flatness, soil density, and sample point distribution, leading to variability across different experimental environments. When the terrain was rough and the sample points were widely spaced, the difference between the offsets of each point and the mean value typically ranged from 2-5 mm. In contrast, when the terrain was flat and the sample points were closely distributed, the difference was no more than 3 mm, resulting in a minor additional fine-tuning error. Therefore, the offsets effectively handled suitable cases and compensated for most errors in complex environments, ensuring applicability in unplanned cases with no available images.
-
A comprehensive approach was presented for sampling implementation based on vision information. Each step of the approach is autonomous, with the operator only needing to monitor the procedure and make a simple decision, if required. Thus, the proposed approach has the potential to achieve fully autonomous lunar sampling. Additionally, several key factors for site selection in scooping sampling were analyzed using point cloud data to perform terrain analysis and achieve autonomous sample point selection, highlighting the crucial role of 3D point cloud data in lunar sampling missions. To accurately measure the pose of the sampler, a 6D pose estimation pipeline was employed in the proposed approach. The adopted point cloud registration method has unique advantages in terms of robustness compared with pre-designed targets or geometric patterns. The point cloud registration method is less sensitive to occlusion, imaging distance, and varying light direction and can effectively reduce the complexity of the scooping sampler design. These attributes make it suitable for lunar sampling missions. During fine-tuning, the main errors in the Chang’e-6 scooping sampling process were identified and vision information was used to compensate for these errors under different sampling conditions. An alternative touching moon compensation method was designed to overcome unscheduled situations for better reliability and flexibility. By replacing manual fine-tuning, a significant time cost reduction is achieved.
Consequently, the proposed vision-based sampling implementation introduces a new approach for utilizing vision information in lunar sampling missions, demonstrating the advantages and effectiveness of the vision-based sampling process. The proposed method is designed for scooping sampling but is also partly applicable for improving the efficiency of other sampling mechanisms, such as drilling and grabbing. Selecting the sample points within a safe region and moving the sampler to the target position are critical parts of the planetary sampling process, and the proposed method provides reliable and efficient support. For example, for a drilling sampler moved by a mechanical arm, the proposed method can determine safe sample points that are far away from obstacles. As drilling typically requires a vertical orientation, the proposed method can quickly measure the pose of the sampler for the necessary adjustments. For tasks that require the manual identification of interesting sample points, the proposed method can also provide valuable local terrain information through point cloud analysis, which can aid in planning. For future planetary missions, vision systems and vision-based methods are expected to further enhance the automaticity and efficiency of sampling.
-
The data used in this study were collected from the testing ground at the China Academy of Space Technology (CAST) and from practical lunar images captured during the Chang’e-6 mission. Images were captured using a binocular camera with a resolution of 2352 × 1728 pixels. The baseline between the two cameras was 200 mm with a focal of 15.4 mm for the two cameras. The imaging distance was 2-5 m. As the reachable region of the mechanical arm on the terrain was approximately a sector with a radius of 2.8 m and an angle of 120°, and the expected 3D reconstruction error of the Chang’e-6 mission was 5 mm at 2.5 m, this configuration enabled the binocular camera to capture a wide range of sampling regions while achieving an accurate reconstruction. The evaluation was conducted using the data collected from the testing ground.
-
The point cloud library (PCL) was used to implement the point cloud data processing38. For the 3D reconstruction, the CREStereo network was used as the stereo matching method to estimate the depth23. For pose measurement, scale-invariant feature transform (SIFT) and fast point feature histograms (FPFH) were used as feature descriptors to extract the correspondences between the two point clouds39,40. YOLO v5 was used to extract local region of the sampler.
-
For the sampler pose measurement, the precision was evaluated using the standard deviation of repeated measurements. Specifically, the sampler was maintained at a fixed position within the sampling region, multiple image pairs were collected at intervals of > 5 s, and the pose of the sampler was measured. In the experiment, the poses of the sampler were set to those possible in the practical sampling process. The standard deviations of x,y,z and α were used to reflect the precision. In addition, the accuracy was evaluated using the relative distance error of the pose measurement. As the mechanical arm has sufficient accuracy in local movement, the sampler was moved at a certain distance between 100-450 mm through the mechanical arm and the vision-based method was used to measure the displacement. The relative distance error is the difference between the measured distance Δdm and the actual distance moved by the mechanical arm Δdg:
ϵ=|Δdm−Δdg| (9) As the purpose of fine-tuning is to indicate a suitable local movement for the sampler, the relative distance error can be an effective reference. The average value of the relative distance error was reported in this study.
For sampler fine-tuning, the accuracy was evaluated by measuring the difference between the expected and actual scooping depths. In the experiments, sample points located on flat ground were selected for fine-tuning evaluation, where the scooping depth could be precisely measured. Following the practical sampling process, the sampler was first moved to a position 100-200 mm above the optimal sampling position and then the proposed method was used to determine the pose adjustment values for fine-tuning. After fine-tuning, the distance between the center of rotation of the shovel and the ground surface was measured. The actual scooping depth was then determined using the shovel radius R and the distance Δdh:
τ=R−Δdh (10) The average absolute difference between the expected and actual scooping depths were reported in this study. For offset accuracy evaluation, images were collected when touching the moon and above the sample point, and the poses of the sampler were measured. The offset values Δzsink+Δzsupp of each sample point were then calculated using Eqs. 5, 6. The experimental environment (including factors such as terrain flatness and sample point distribution) remained consistent in the same offset evaluation experiment but varied across different experiments.




 DownLoad:


 DownLoad: