


-
Light beams carry multidimensional information and encompass optical parameters such as wavelength, amplitude, phase, and polarisation1. Among these, polarisation control has garnered significant attention for optical image processing2–10, which plays a crucial role in applications such as data compression, intelligent recognition, and biomedical engineering. Recently, various nanophotonic techniques have emerged for edge detection and imaging, including those utilising surface plasmon resonance11, spiral phase masks3–5 (SPM), and the spin Hall effect of light6–8 (SHEL). These approaches have demonstrated the potential to enhance edge detection by precisely controlling the phase and polarisation, with some achieving groundbreaking results, particularly in terms of certain exciting performance metrics. However, most existing studies are restricted to single-direction edge detection or single functionality, and often require additional optical components in the setup, which hinders the compactness and multifunctionality of image processors. For instance, the SHEL-based method introduced by Tang et al.6 is constrained to single functionality and requires sophisticated optical equipment; The SPM-based work by Badloe et al.4 necessitates an additional liquid crystal cell for electric switching between edge detection and bright-field imaging, and both may encounter issues related to optical alignment. Therefore, novel mechanisms and techniques are required to overcome these limitations. A promising approach involves leveraging the polarisation singularities12,13 in photonic crystal slabs (PCSs) to design an optical resonance with the required angular dispersion for image processing.
Recently, PCSs have emerged as a favoured platform for polarisation-driven applications owing to their capability to generate diverse far-field polarisation singularities, such as bound states in the continuum14–20 (BICs) and circularly polarised points21,22 (C-points). Research on BICs has made significant strides in lasers23, enhanced nonlinear effects24, and sensing25. Despite these advances, the potential of C-point-driven applications remains largely untapped, with only a few notable exceptions such as chiral emission26,27, unidirectional guided resonances28, and polarisation-dependent beam shifts29. These studies highlighted that strong chiral selectivity leads to distinct optical responses under left- or right-circularly polarised light. This suggests that the spin-dependent PCS imager enabled by C-points holds considerable promise for advanced optical imaging applications.
In this study, we propose and demonstrate both numerically and experimentally a dual-functional imager for edge detection7,30 and bright-field imaging4 , based on an ultrathin silicon nitride photonic crystal slab (200 nm thick). The system leverages strong chiral selectivity26,27 to achieve a Lorentzian-like transmission profile optimised for edge detection and a distinct optical transfer function31–33 (OTF) for conventional bright-field imaging with full transmission. A numerical imaging program was developed to characterise the PCS imager’s performance for two spin-dependent functions, and experimental validation was conducted using a fabricated sample, including resolution analysis for edge enhancement. Notably, this is the first reported image processing approach that utilises the chiral selectivity of C-points, and we established a clear positive correlation between chirality and edge detection, offering key insights for future research on polarisation manipulation.
-
We began discussing the design of our PCS imager by leveraging the C-points of a common PCS platform consisting of a square lattice of silicon nitride (Si3N4, refractive index ~ 2.02). We maintained a fixed period of a = 450 nm, while leaving the thickness of the PCS (d) and the geometric characteristics of the air holes (shape and duty ratio r) adjustable. The duty ratio r is defined as the ratio of the air hole area to that of the slab. This flexibility provides sufficient degrees of freedom to generate C-points and is simultaneously optimised to the desired OTFs under circularly polarised light for edge detection and imaging. Conventionally, BICs in PCS systems are recognised as viable sources for yielding C-points, as substantiated by Liu et al. in their investigation of the spawning of C-points from a BIC21. As schematically illustrated in Fig. 1a, square air holes were transformed into isosceles triangular shapes while maintaining their area (or r) unchanged to introduce the necessary in-plane C2 symmetry breaking. The eigenmode analysis shown in Fig. 1 was conducted to determine the operational band required to generate feasible C-points by calculating the band structure, quality factors (Qs), and polarisation field maps of the PCS exhibiting C4v symmetry or broken symmetry. Here, k, kx, and ky represent normalised wavevectors relative to k0 = 2π/a in momentum space. As depicted in Fig. 1b−d, four BICs with diverging Qs were identified in bands TE2, TE3, TM2, and TM5. Among these, TE2 and TM5 were found to be viable for producing the required C-points in the momentum space, as shown in the Supplementary File. The eigenfield distributions of both bands are shown in the insets of Fig. 1b, c. Our investigation primarily focused on the TE2 band for validation. Notably, the BIC transitions into radiative resonances with finite Qs (Q ~ 400) after symmetry breaking. The calculated polarisation maps (Fig. 1e, f) clearly demonstrate the splitting of a V-point into two C-points, manifesting as eigenmodes of opposite chirality: a Left-Handed (LH) C-point paired with another Right-Handed (RH) C-point. Subsequently, we set the working frequency to fw = 0.6385f0 (λw = 705 nm) and finely tuned the structural parameters (d and r) to achieve the desired OTFs for edge detection according to temporal coupled mode theory33,34. For edge detection, a Lorentzian-like transmission profile is preferred. The PCS was optimised with d = 200 nm and r = 0.15, to achieve a unity background transmission coefficient (td = 1), and the asymmetric Fano-like transmission profile of the PCS was transformed into a symmetric Lorentzian-like profile at a working frequency, as detailed in Supplementary Section I.
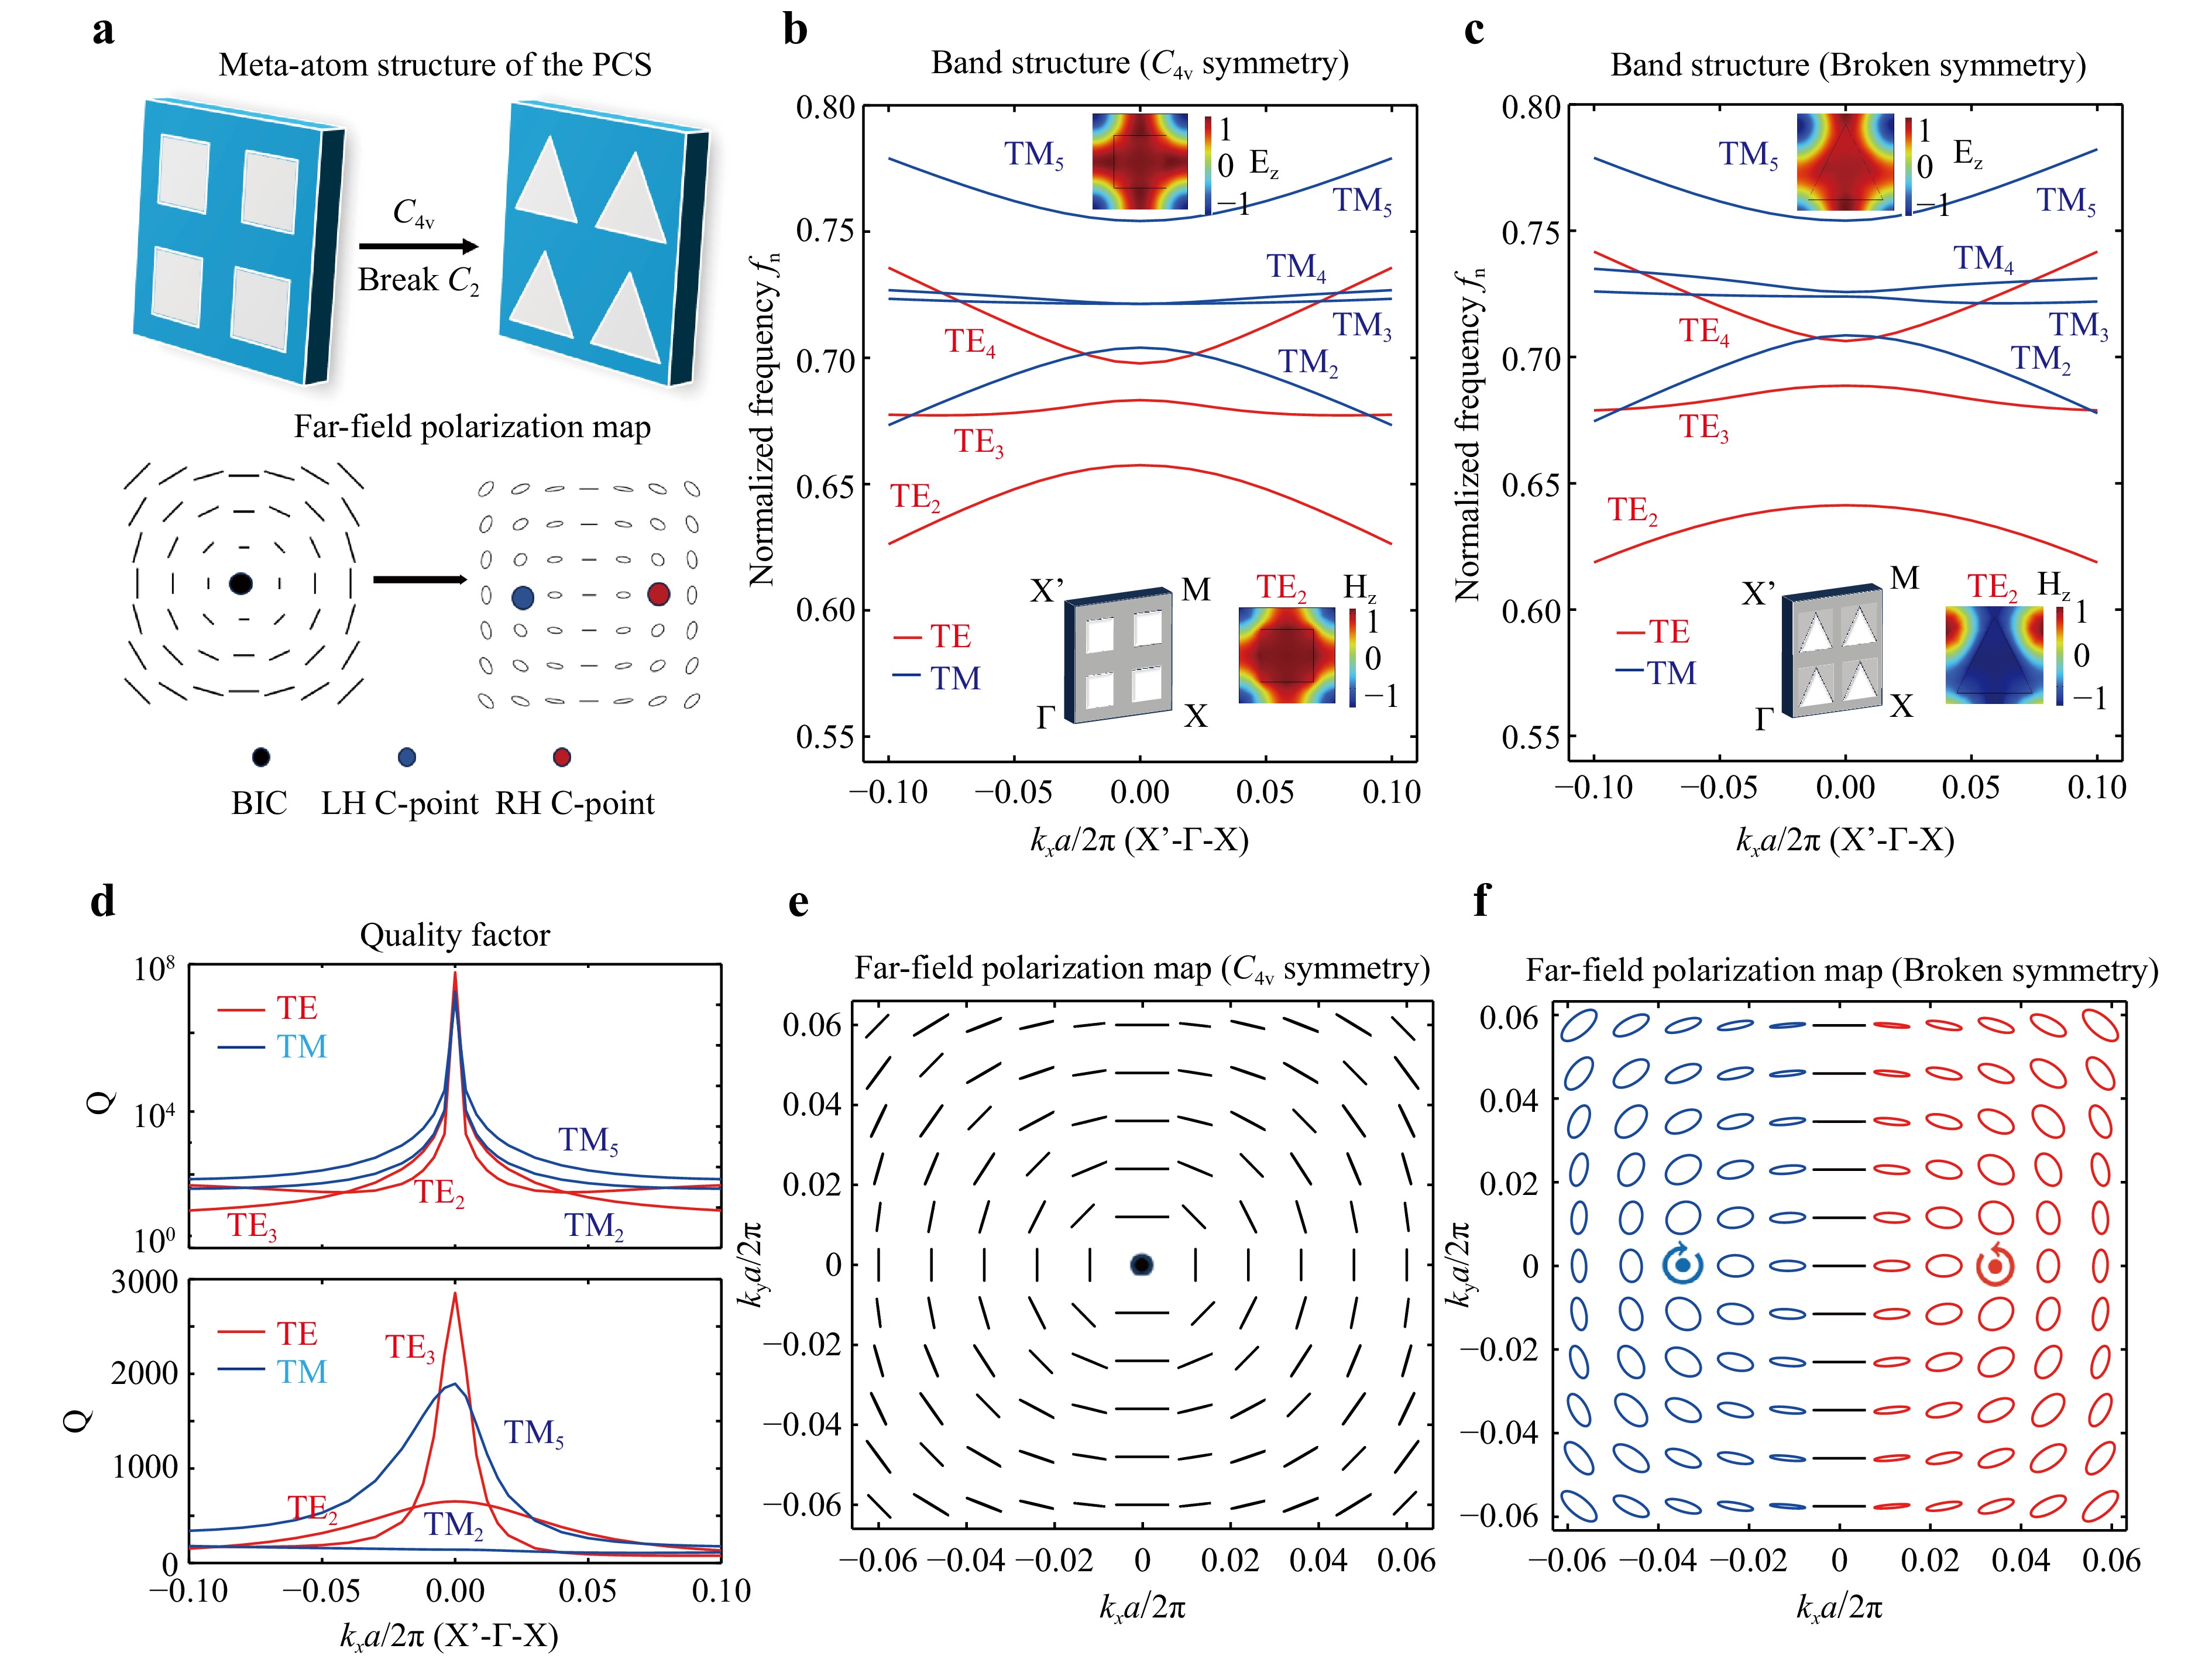
Fig. 1 Schematic for breaking the BIC point into two-paired C-points. a Schematic view of how two C-points with opposite chirality split from a SP-BIC with the broken in-plane C2 symmetry. b, c Simulated bands of TE and TM modes of the PCS following the X’-Γ-X direction, the insets of which show the sketched schematic of the PCS structure. The inset shows the eigenfield distributions for band TE2 and TM5. d Calculated Q factors of bands TE2, TE3, TM2, and TM5 (support BICs) for the PCS before (upper panel) and after (lower panel) symmetry breaking. e, f Calculated polarisation field map of band TE2 before (e) and after (f) symmetry breaking.
The chiral selectivity of the proposed PCS imager was validated by simulating the angle-resolved transmission spectra under light with circular polarisation. As shown in Fig. 2a, the transmittance upon right-handed circular polarisation (RCP) exhibited asymmetry owing to the differing excitation responses of the two C-points. The continuous transmittance zeros in the parameter space (kx, fn) signify the existence of RH C-points at various incident frequencies. Here, fn represents the normalised frequency relative to f0 = c/a and the dotted line in Fig. 2a indicates the working frequency. The calculated transmittance (T) shows that a significant transition from complete transmission (T = 1) to transmission-zeros (T = 0) occurs at the RH C-point (kCR = + 0.039k0) which is indicative of a Lorentzian-like response. Meanwhile, near-unity transmission (T = 1) around the LH C-point (kCL = −0.039k0) remain unchanged. The phase spectra of transmission coefficients (Fig. 2c) reveal a similar crescent pattern, with a phase change close to π around the RH C-point. This distinctive asymmetric transmission response establishes a strict one-to-one correspondence between the C-points and incident polarisation; specifically, RCP (LCP) incidence can only excite the RH (LH) C-point. Therefore, the pronounced chiral selectivity of the PCS has been confirmed, enabling us to utilise the two sets of OTFs for edge detection and bright-field imaging.
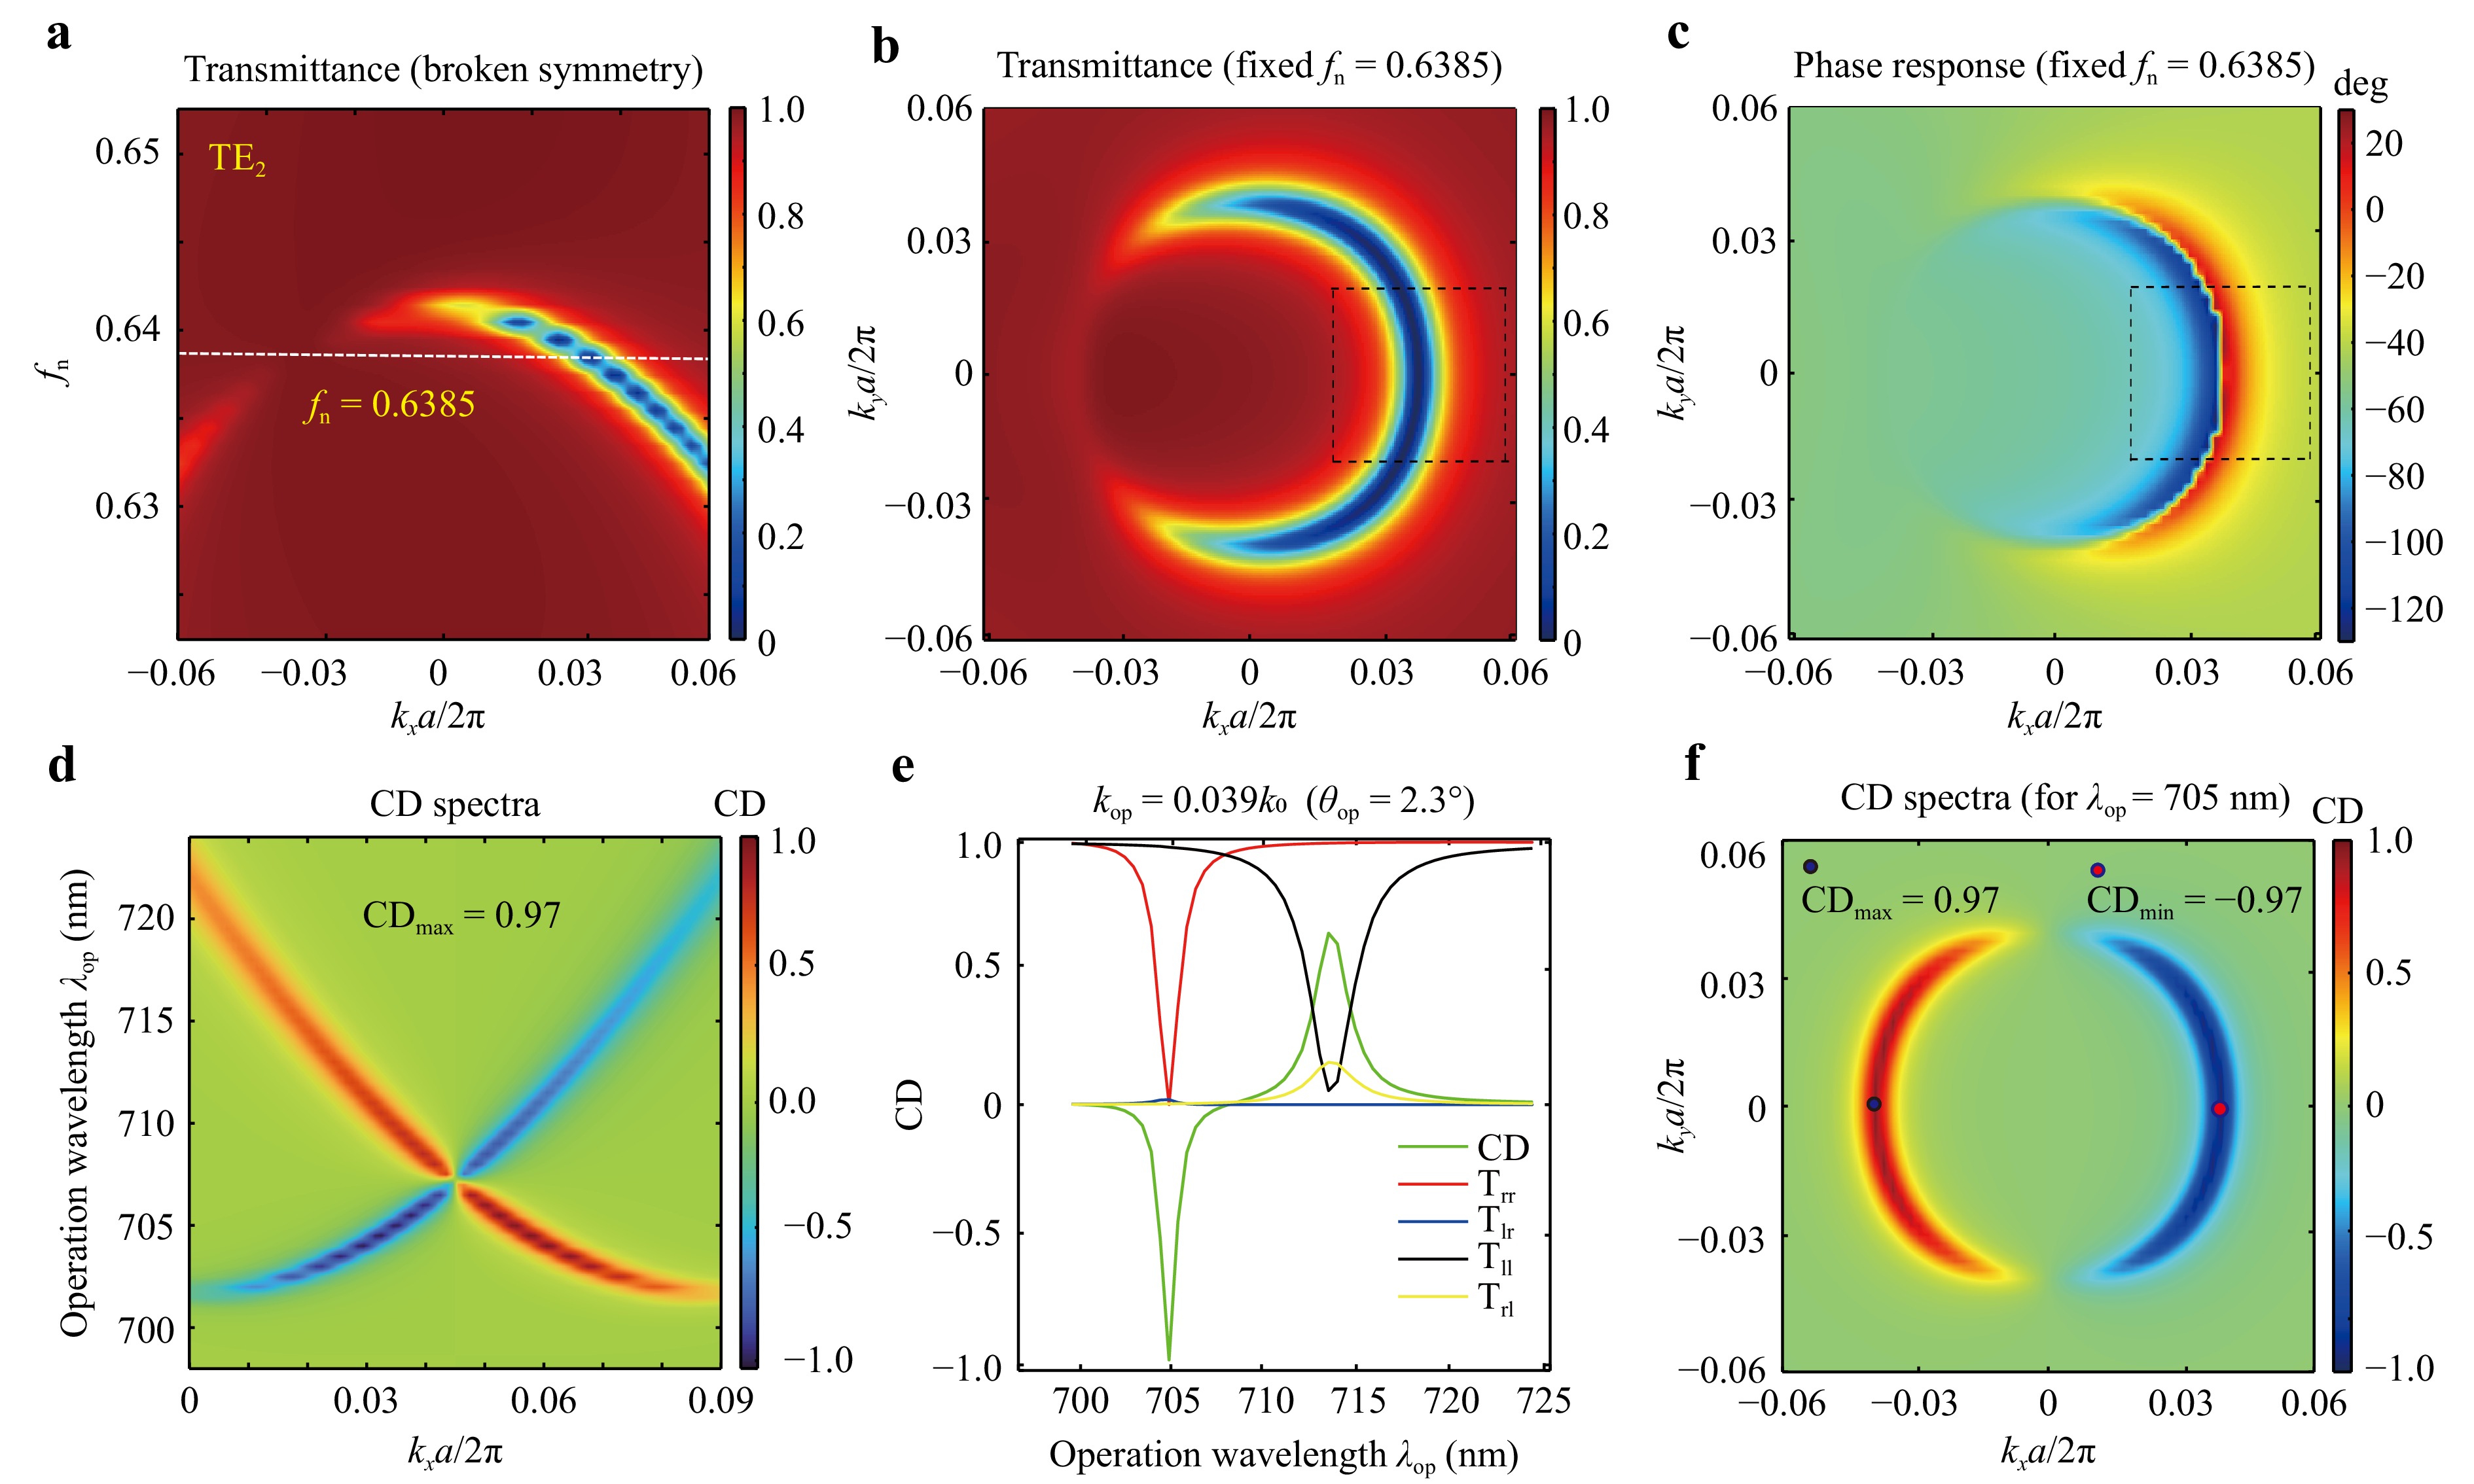
Fig. 2 Chiral selectivity of the designed PCS imager. The background satisfies td = 1 at the working frequency of fw = 0.6385f0, as marked by a dotted white line in a, to achieve a Lorentzian-like response and a near-unitary CD. a Calculated transmission spectra around band TE2 in the parameter space (kx, fn) for the PCS imager. b, c Simulated transmittance (b) and phase response (c) at fixed frequency fw in momentum space. The two boxes, indicate the field of view for the OTFs of the imager. d Calculated CD spectra for varying operational wavelengths and kx (or incident angles). e Transmission and CD spectra for oblique incidence θop = 2.3 degrees. f CD distribution in momentum space with a working wavelength of 705nm.
To assess the chiral selectivity and performance of the PCS imager quantitatively, the corresponding CD spectra were computed. CD is defined as follows26,27,35
$$ CD=\frac{\left({T}_{rr}+{T}_{lr}\right)-({T}_{ll}+{T}_{rl})}{\left({T}_{rr}+{T}_{lr}\right)+({T}_{ll}+{T}_{rl})} $$ (1) Here, Ti,j represents the transmittance of the output polarisation i from the input polarisation j, where r and l denote the RCP and LCP states, respectively. Ensuring maximal chiral selectivity is crucial for optimal performance of the PCS imager across both functionalities. The absolute value of CD serves as an indicator of the degree of chirality. In Fig. 2d, we observed the evolution of CD as the incident wavelengths λop (698–724 nm) and kx (or incident angle θ) are varied continuously. The linewidth of the CD spectrum increases from zero to finite values as θ increases, with the peak CD approaching a near-unity value (|CD|max = 0.97), thereby underscoring the strong extrinsic chirality of the designed PCS. The red and blue strips in the spectra denote the positions of the corresponding LH and RH C-points at different incident wavelengths. Notably, the sign of CD was reversed because of the opposite eigenpolarisation helicity of the two C-points supported by the PCS structure. As demonstrated in Supplementary Section II, our PCS imager maintains a high CD value (0.70 < |CD| < 1.0) and effective edge detection within a bandwidth spanning from 702 nm to 714 nm. Moreover, a positive correlation between |CD| and the edge detection performance was established, as discussed in Supplementary Section III. We further extracted CD and Ti,j spectra for varying wavelengths at the RH C-point with an illumination angle of θop = 2.3 degrees (kop = 0.039k0). From Fig. 2e, it is evident that the maximal chiral selectivity emerges at 705 nm. Additionally, we plotted the CD distributions in momentum space for λw = 705 nm, where the peak |CD| reaches a near-perfect value of 0.97 at two C-points. Remarkably, both the transmission zeros in Fig. 2a and the high CD range in Fig. 2d indicate robust edge detection and imaging across a relatively broad bandwidth of 702–714 nm. This robustness with respect to wavelength deviations can be attributed to the low-Q resonant state of the RH C-point (Q ~ 400) away from the BIC state36,37.
We further determined the OTFs to facilitate edge detection and bright-field imaging, capitalising on the pronounced chiral selectivity of a specific C-point within the PCS imager under different circularly polarised incidences. At the working wavelength of λw = 705 nm, the peak CD of the PCS can reach up to 0.97, which indicates near perfect chiral selectivity for edge detection and imaging. For validation, we constrained the OTFs to encompass a field of view centered around the RH C-point (kCR = + 0.039k0) with |(kx - kCR/k0)| ≤ 0.02 and |ky/k0| ≤ 0.02 (the dotted boxes in Fig. 2b, c). Fig. 3a, b and Fig. 3d, e present the fitted transmittance (T) and phase response within the field of view for RCP and LCP incidences, respectively. Upon RCP incidence, the transmission spectra underwent a sharp transition from 1 to 0 around the RH C-point, accompanied by a sudden change in the transmission phase (Fig. 3b). Subsequently, we computed the transmitted light intensity along the horizontal (ky = 0) and vertical (kx = 0) directions (Fig. 3c, f), as denoted by the dotted crosses in Fig. 3a, d. It is noteworthy that the OTF along the horizontal direction for RCP light (Fig. 3c) exhibited a perfect Lorentzian-like profile around the RH C-point. Moreover, it is complex-valued and described by H(k) = 1 / (α j(k - kCR) + β))38, where α and β are constants. The real and imaginary parts of the OTF are provided in Supplementary Section V. Consequently, this OTF can be effectively utilised for edge detection, as light with a small in-plane vector is reflected from the PCS, whereas light containing edge information, characterised by a large in-plane vector, is transmitted. A similar scenario was observed in the vertical direction, albeit with a slightly reduced light transmittance, enabling the OTF to distinguish vertical edges within the designated field of view. In contrast, under LCP incidence, the transmittance (Fig. 3d) remains close to unity, exhibiting a gradually changing phase response (Fig. 3e), with most of the light transmitted through the PCS (Fig. 3f)) facilitating bright-field imaging.
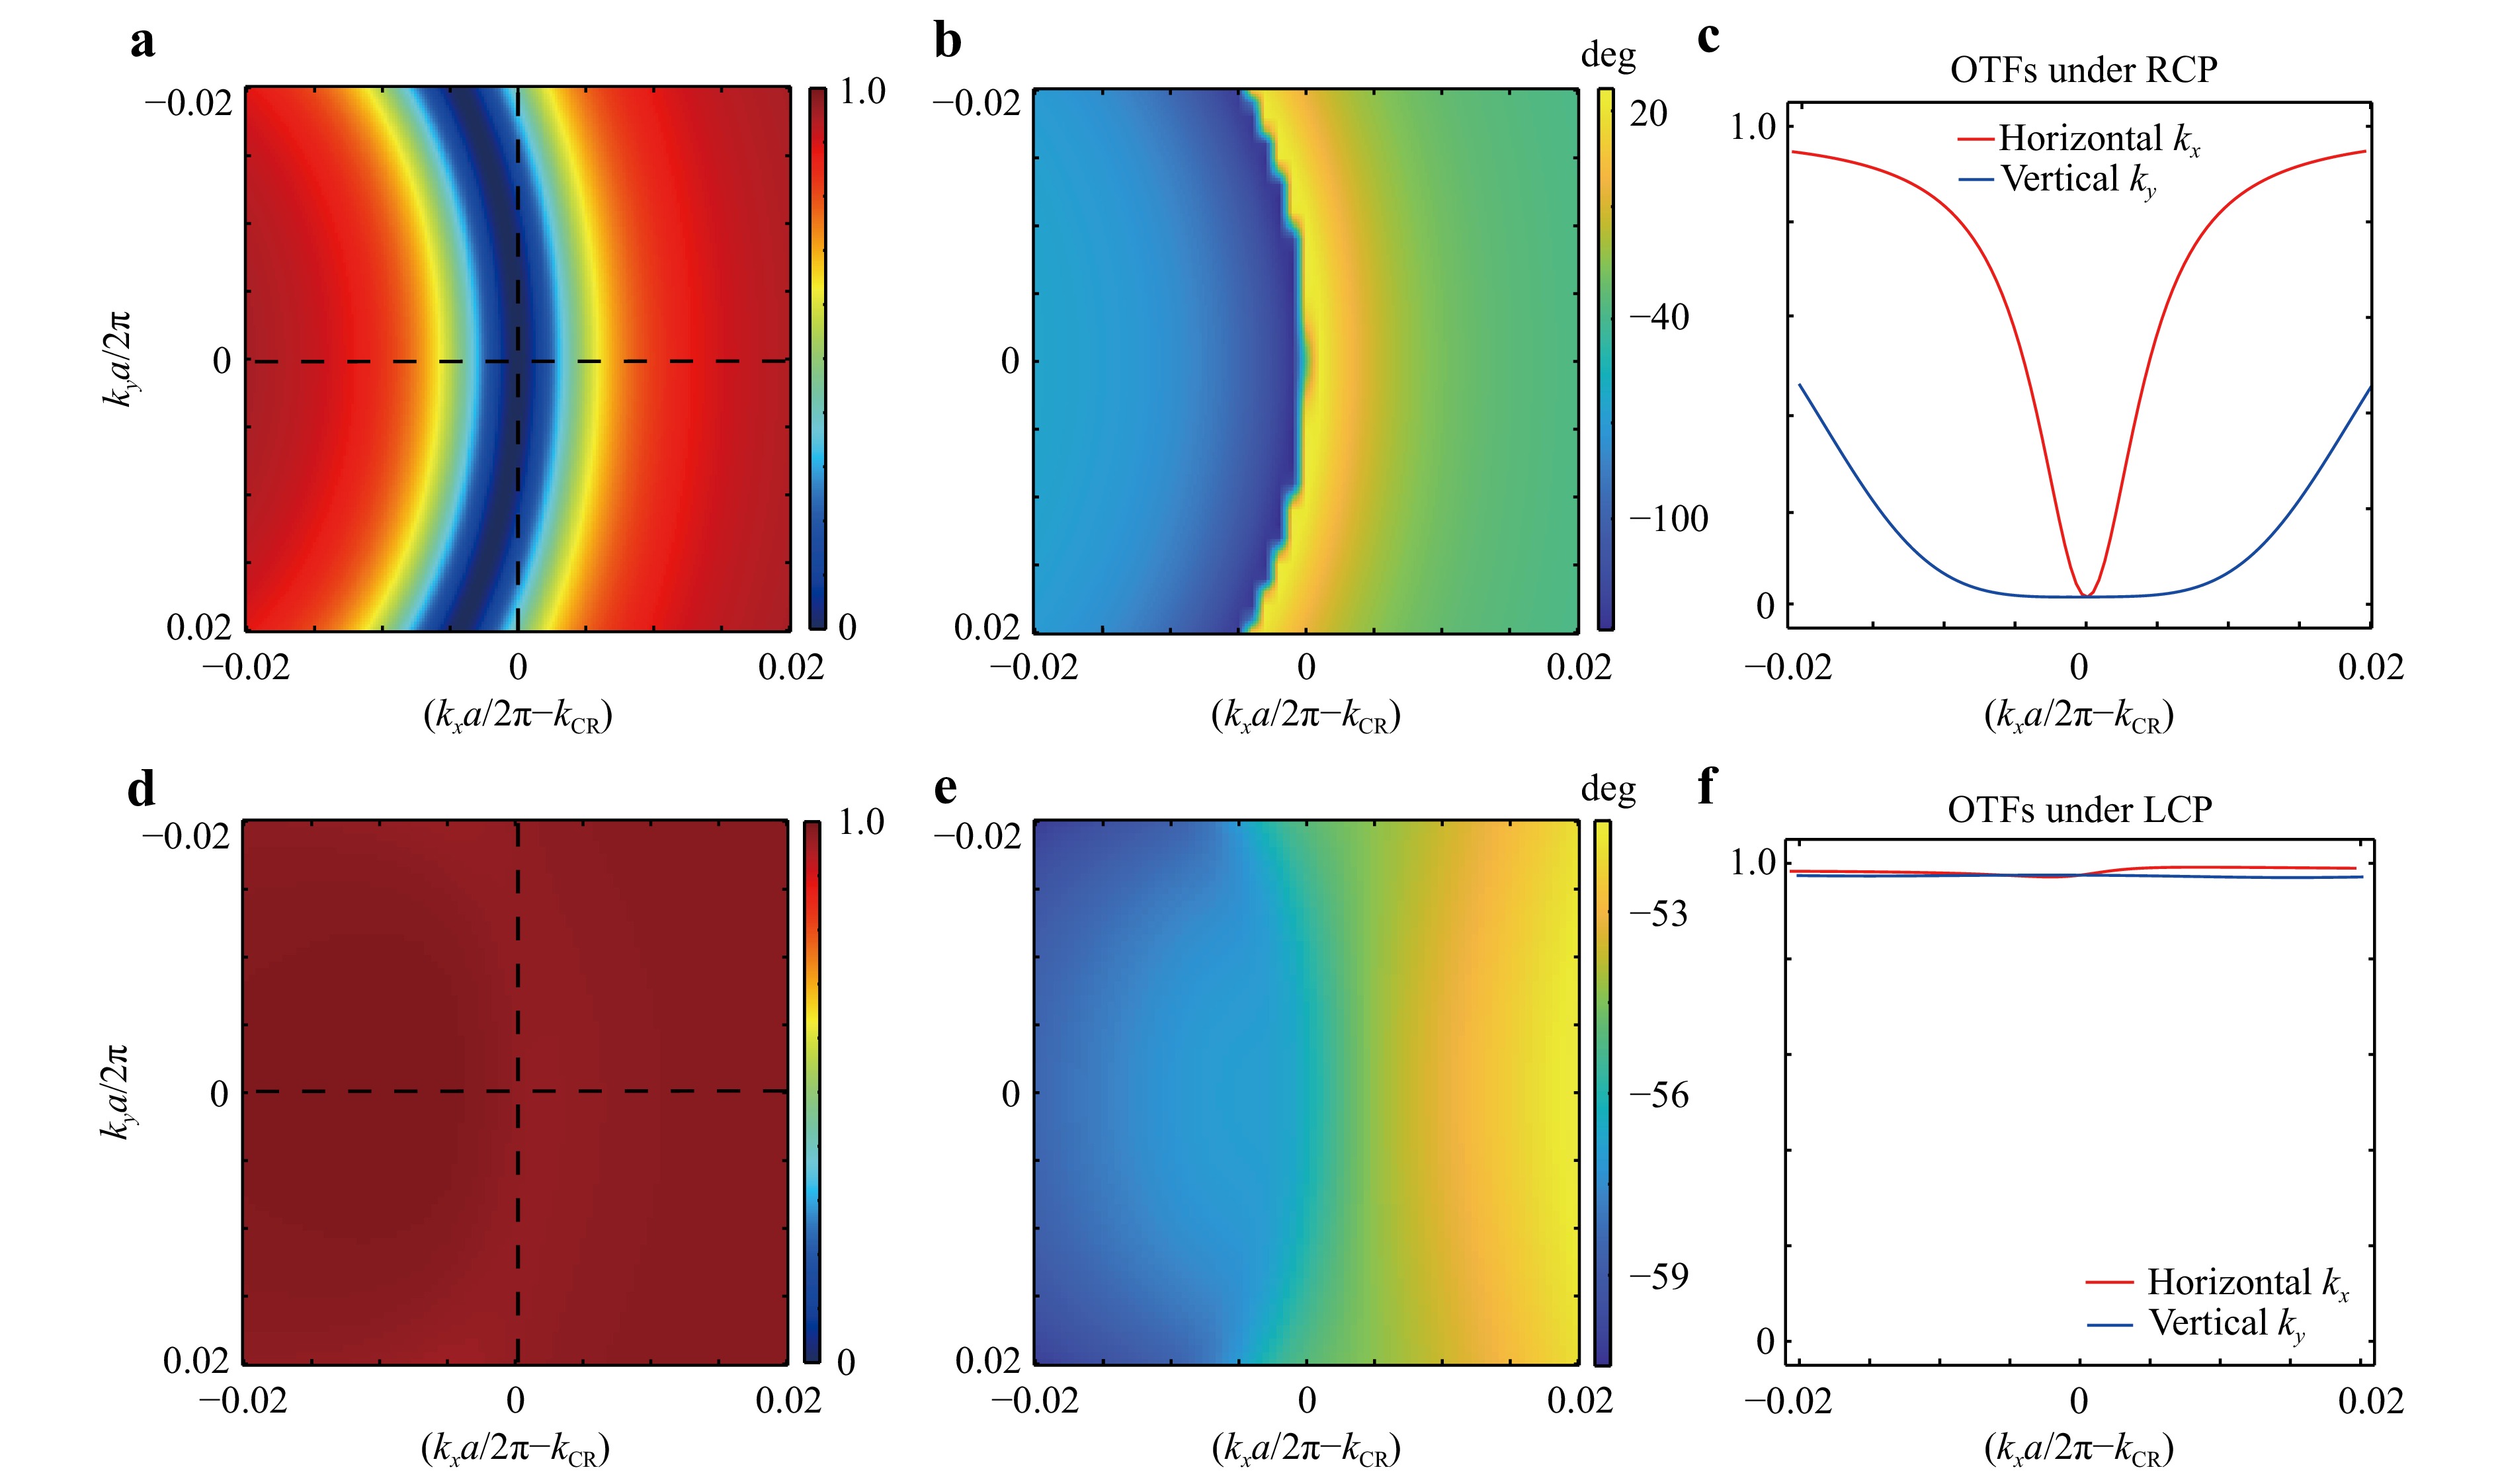
Fig. 3 Two sets of OTFs centered at the RH C-point of the designed PCS imager under RCP or LCP incidence. The PCS imager works at wavelength of λw = 705nm with the field of view: |(kx - kCR/k0)| ≤ 0.02 and |ky/k0| ≤ 0.02. a, b The fitted transmittance (a) and transmission phase (b) under RCP incidence. c The fitted OTFs (transmittance) at the RH C-point at kx/ky directions under RCP incidence along dotted lines in (a, d). d−f, The same as (a−c) but for LCP incidence.
-
To numerically showcase the dual functionalities of the imager, namely, bright-field imaging and edge detection, we leveraged the operation OTFs (Fig. 3) to design a multifunctional image system capable of generating simulated output images and intensity distributions using the developed MATLAB program. The OTFs of the device can be directly integrated into a conventional 4-f system, and the detailed methodology is outlined in the Methods section and Supplementary section VI. The strong extrinsic chirality of the imager arises from the combination of the achiral structure supporting the C-points and oblique incident angles. Hence, it is crucial to position the PCS obliquely at a specific angle θ0 = arcsin (kCR/k0) = 2.3 degrees with respect to the optical axis. For imaging targets, we employed three binarised samples (letters “NJU”, traffic signs, and logo of Nanjing University). We captured output images using different excitation sources (RCP or LCP) at an operational wavelength of 705 nm. Bright-field images for the three cases under LCP excitation shown in Fig. 4a, d, g, revealing detailed and high-quality information about the targets. Upon switching from LCP to RCP excitation, the output images transitioned to high-contrast edge-enhanced images, as shown in Fig. 4b, e, h. The edges of the letters, signs, and logo were distinctly revealed along both the horizontal and vertical directions, indicating effective edge detection capability in both orientations. Notably, the vertical edges were slightly less prominent than the horizontal edges because of their lower transmittance (Fig. 3c). To quantitatively assess the performance of the two functions, we extracted the normalised intensity distributions along the red dashed lines in the output images for analysis, as shown in the upper and lower panels of Fig. 4c, f, i. Bright-field images with unity transmission preserve the amplitude information encoded in the binary samples. In the intensity diagrams of edge detection, clear and well-separated sharp peaks were observed precisely at each edge, whereas regions away from the edges exhibited nearly zero amplitude. These peaks clearly signify the excellent edge detection capability attributable to the Lorentzian-like OTF endowed by the C-points of maximal chiral selectivity within the PCS imager. Additionally, the zoomed-in intensity distributions of all peaks in the edge-enhanced images are shown in the Supplementary File. The minimum full width at half maximum (FWHM) of edge detection imaging was measured to be 1.6 λ (wavelength scale). The numerical simulations detailed in Supplementary Section III demonstrate that effective edge enhancement can be achieved when |CD| exceeds 0.70, and that the edge-detection performance of the PCS imager correlates positively with |CD| (or chirality).
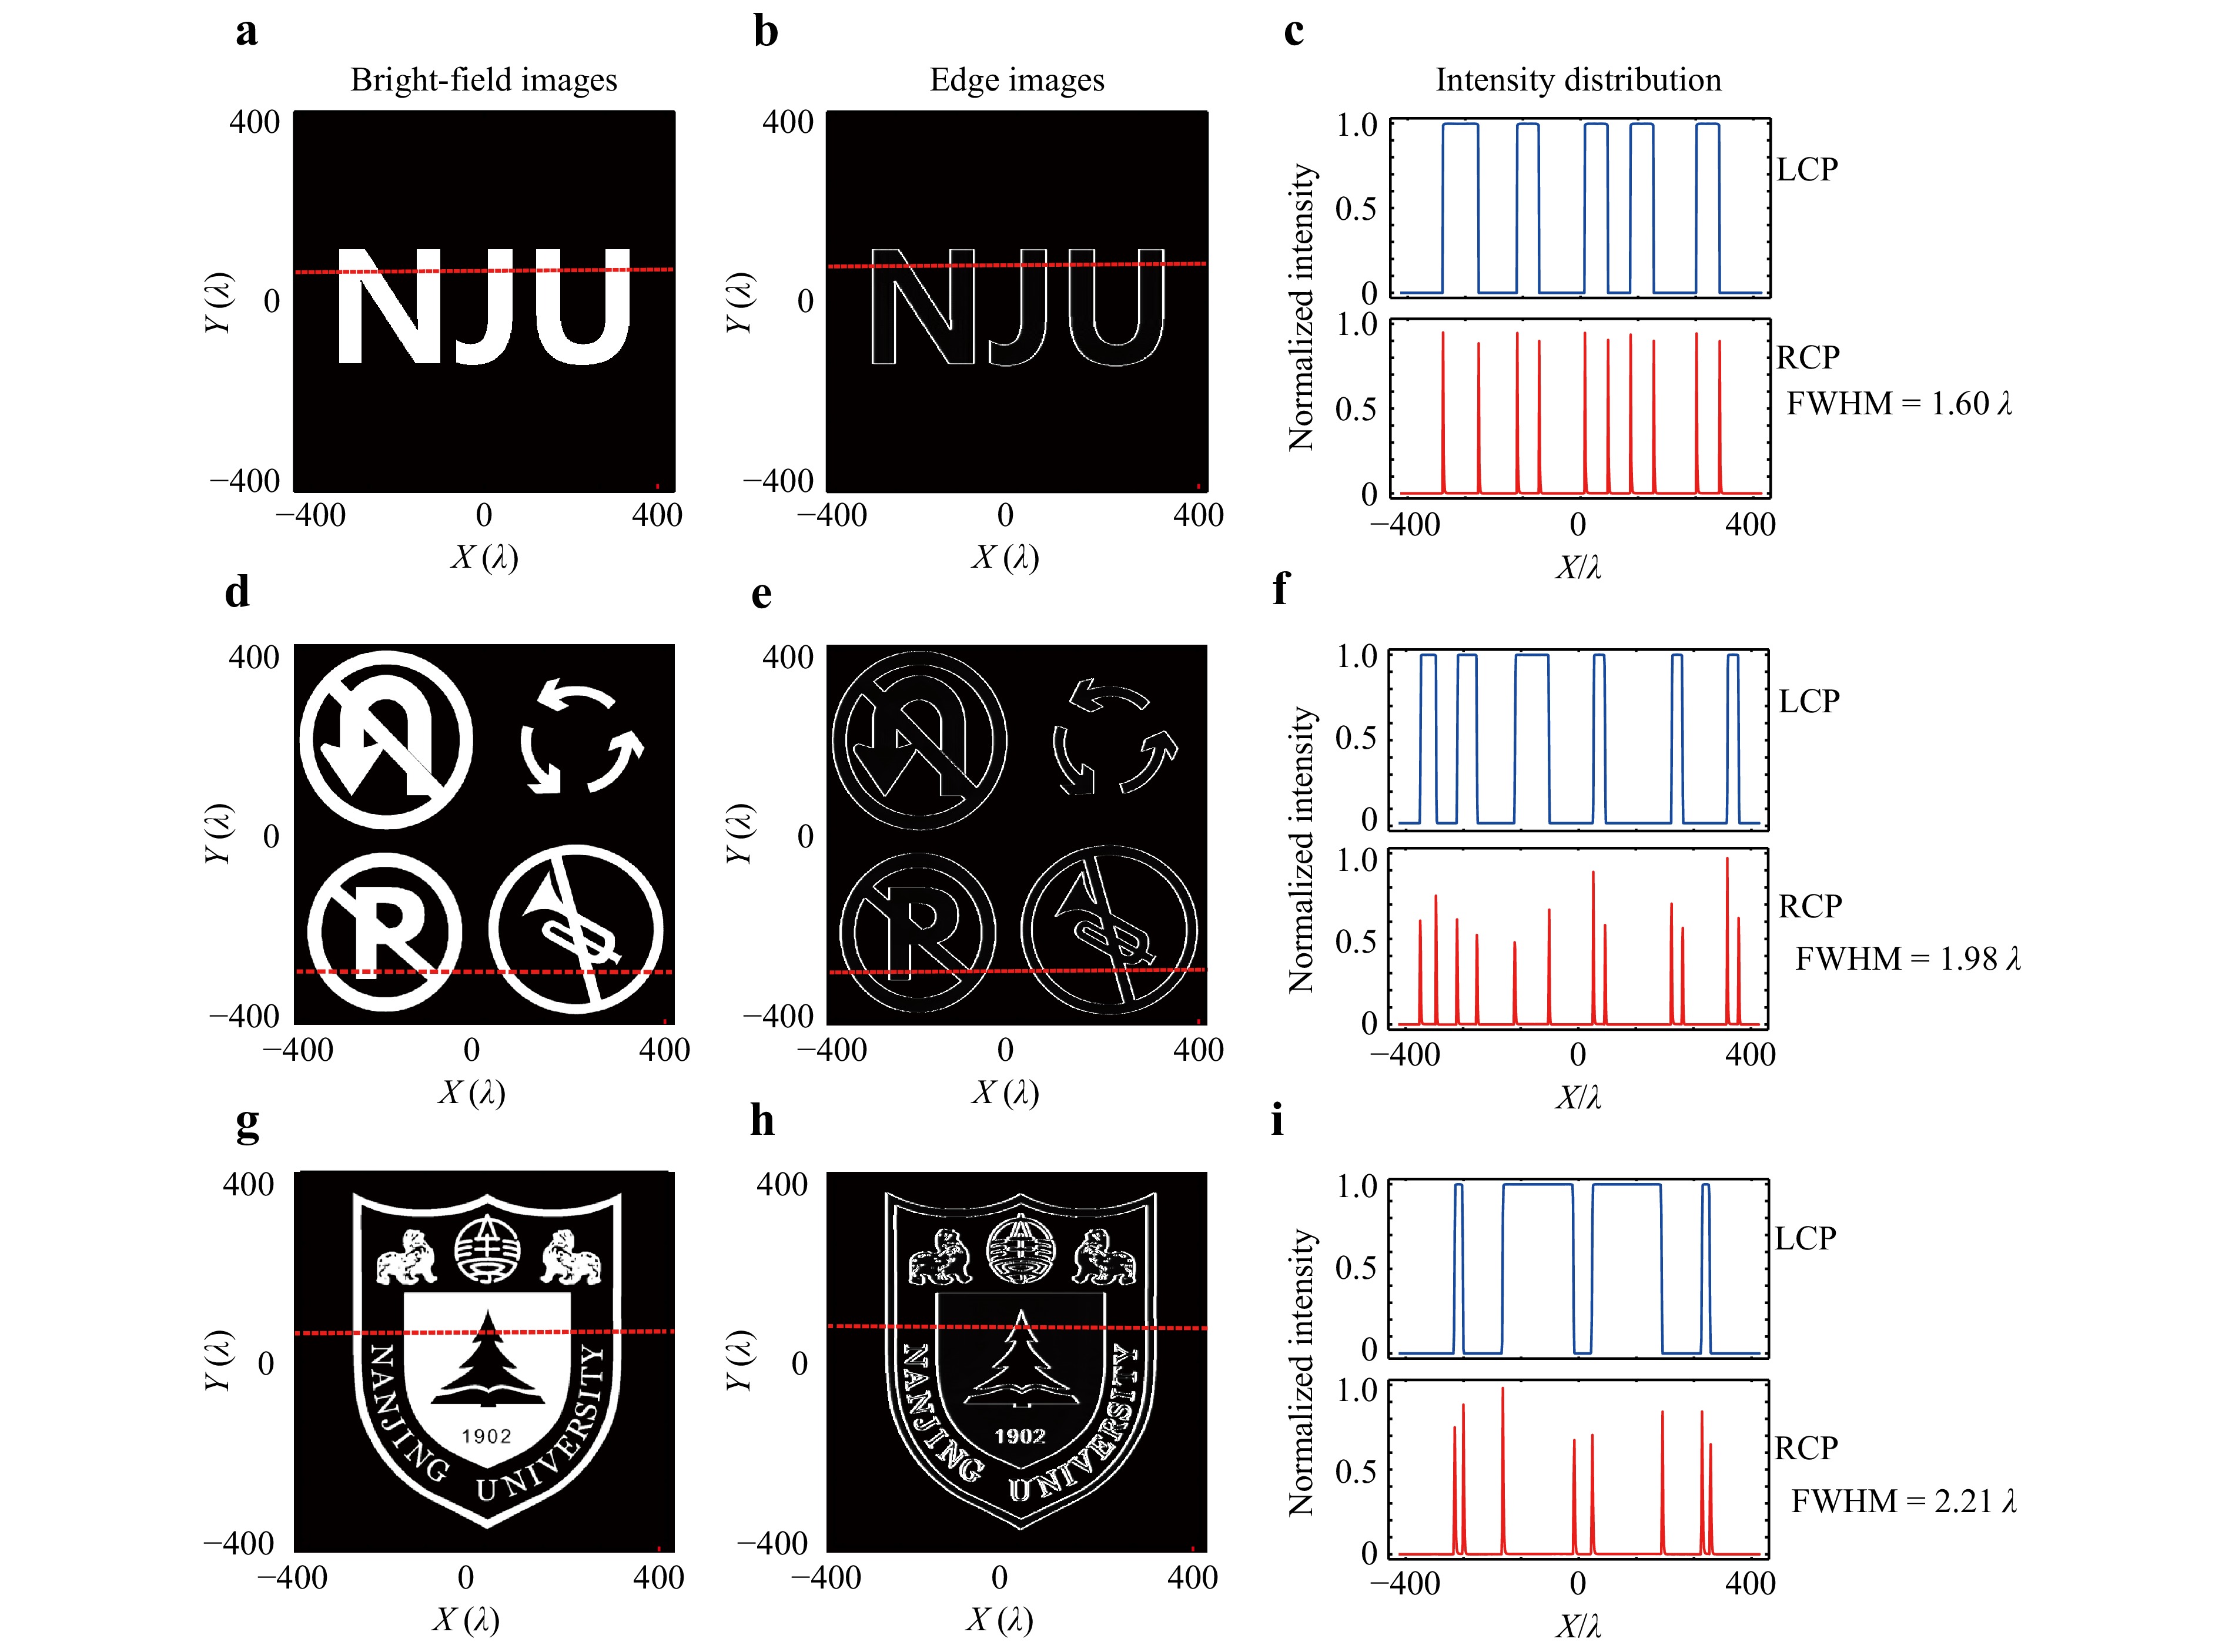
Fig. 4 Numerical characterisation of the two different functions of the PCS imager, edge-imaging and bright-field imaging. Integrating the PCS into a conventional 4-f imaging system can realise edge (or bright field) imaging with RCP (or LCP) incidence. The operation wavelength is 705 nm. a, b The bright-field images under LCP (a) and the edge-enhanced images under RCP (b) for Letters “NJU”. c Intensity distributions along the red dashed lines in edge-enhanced images. d−i The same as (a−c) but for the traffic signs (d−f) and the logo of Nanjing University (g−i).
The experimental setup for spin-dependent edge detection and imaging is shown in Fig. 5a. We constructed an imaging system by integrating the PCS into a conventional optical setup comprising an objective lens and a camera sensor. The lattice constant was redesigned to a0 = 500 nm, which corresponds to an operational wavelength of 785 nm. Fabrication of the sample involved etching holes onto a 200-nm-thick 400μm × 400μm Si3N4 film on a silica substrate (detailed in the Methods). Importantly, we retained the substrate layer for this fabricated sample, which is a practical compromise between structural stability and optical performance. The measured experimental peak CD value was 0.76, which is close to the theoretically calculated CD value of 0.80 for the PCS imager with a substrate. Detailed results regarding the effect of the substrate and the experimental setup for the CD measurements can be found in the Supplementary File. An inset in Fig. 5a shows a scanning electron microscopy (SEM) image of the fabricated sample. For the input imaging targets, we used a specially designed micrometer-scale pattern resembling the letter “N” and an “eye”. Collimated light at a wavelength of 785 nm illuminated the test pattern on the iris plate. A quarter-wave plate (QWP) and linear polariser (LP1) were employed to modulate the helicity of incident circularly polarised light (RCP or LCP). The sample was then imaged using a magnification system comprising a 10× objective lens (NA = 0.3) paired with an imaging lens L2 (f2 = 100 mm) and a near-infrared monochrome charge-coupled device (CCD) camera. Additionally, a rotary table was utilised to rotate the sample with an oblique incident angle of 2.3 degrees, aligned with the OTFs centred around the RH C-point. Bright-field images of the two apertures were captured under LCP excitation, as shown in Fig. 5b, e. Upon switching the input polarisation from LCP to RCP, edge-enhanced images with the same targets were displayed in Fig. 5c, f, showing significant edge enhancements along both the horizontal and vertical directions. Furthermore, we extracted the intensity distributions of the light fields in the edge-enhanced images, specifically at the two peaks marked by red and blue lines in Fig. 5d, g, respectively. The measured average FWHM for distinguishing the edges is approximately 4.0 μm, indicating effective edge detection with micrometer-scale resolution. It is worth noting that the measured FWHM is slightly larger than the theoretical predictions, possibly owing to the smaller CD (0.76 with substrate) of the sample as well as diffractive artefacts from lenses and other optical elements. In principle, the imaging resolution of this PCS imager can be improved by further removing the substrate to increase the CD and changing the objective lens.
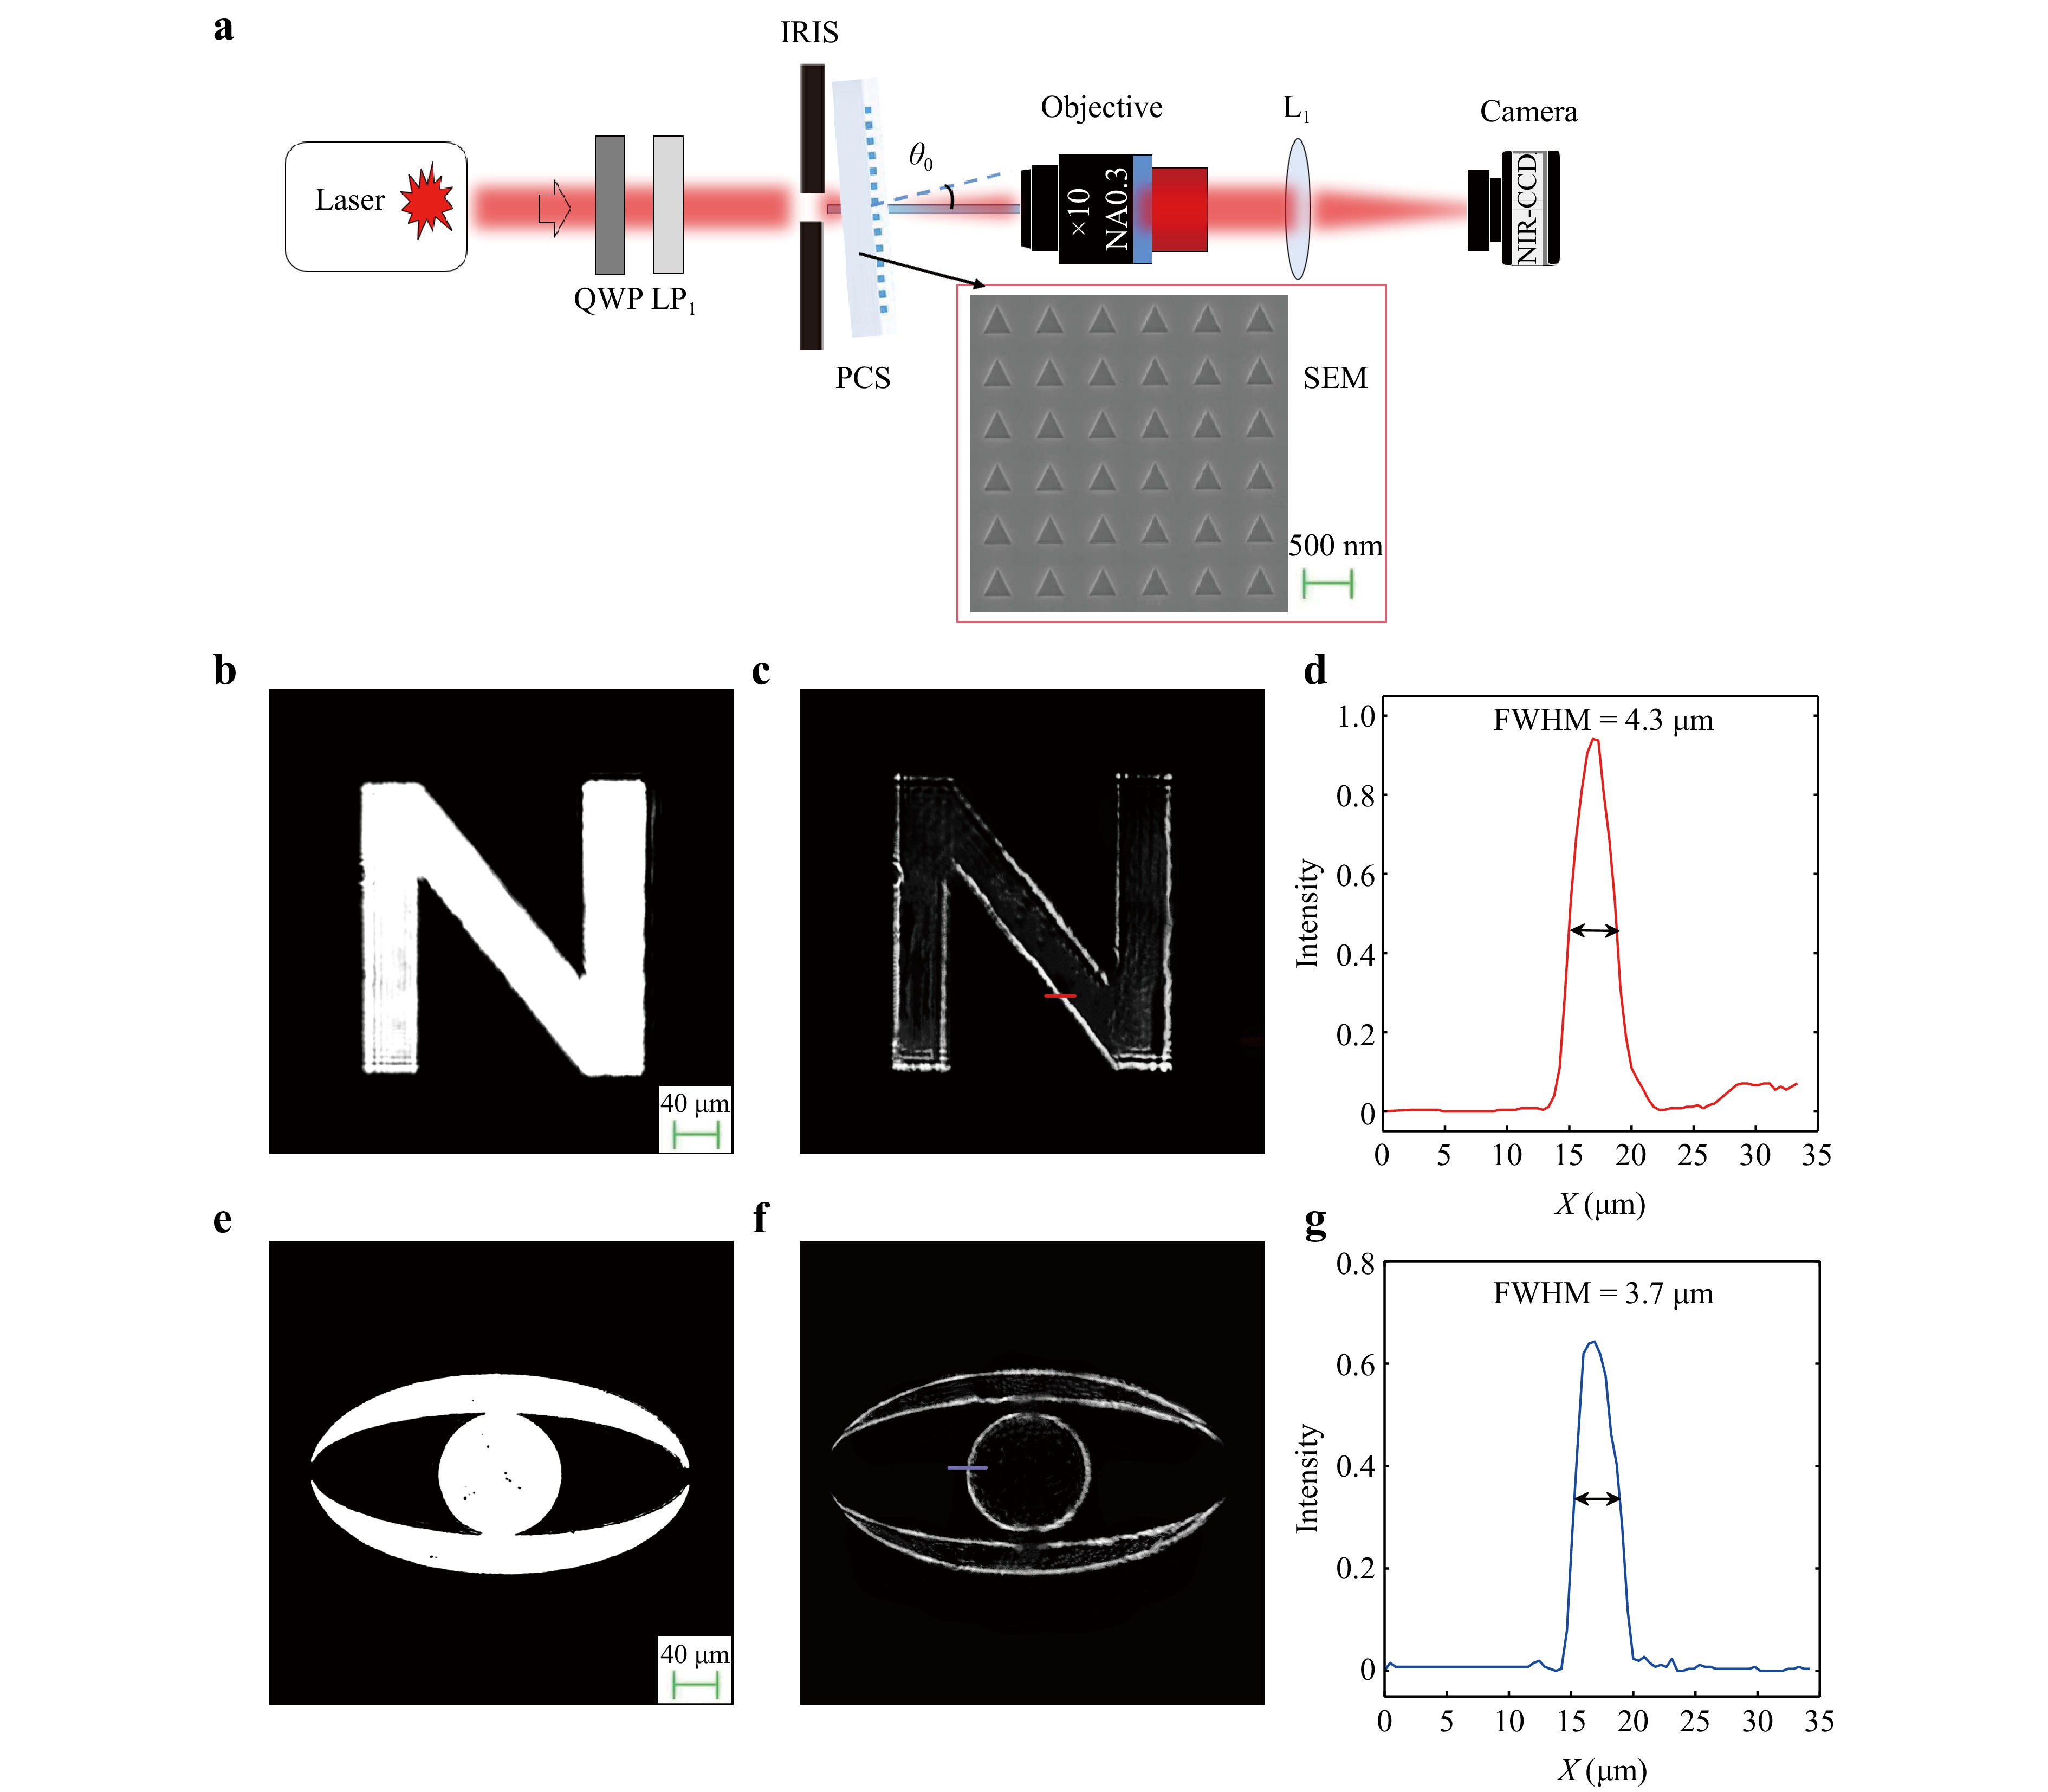
Fig. 5 Sketch of the experimental set-up for characterizing the proposed PCS imager. LP1: linear polariser; QWP: quarter-wave plate; IRIS: a properly designed aperture with shape of letter “N” and an eye; L1: imaging lens; NIR-CCD. a The schematic of the experimental set-up. The inset SEM image shows the fabricated sample. The imager was illuminated obliquely with θ0 = 2.3 degrees. b, c Bright-field image under LCP (b) and edge-enhanced image under RCP (c) for the letter “N”, respectively. d Intensity distributions along the red line denoted in (c). e, f The same as (b−c) but for the “eye”. g Intensity distributions along the blue line in (f).
Based on both numerical and experimental demonstrations, we showed that the PCS imager is compatible with various traditional optical imaging setups and provides spin-dependent dual functionalities with high resolution. The nonlocality37,39 of OTFs in this device is also a crucial advantage over most traditional optical elements that require strict alignment with the optical axis . Moreover, the designed PCS imager exhibited a robust performance with small deviations from the operational wavelength. A key consideration involves balancing the edge detection performance with the practical need for a substrate during fabrication, which is essential for mechanical stability and ease of handling. Although the inclusion of the substrate resulted in a reduced CD peak of 0.76, the chiral selectivity remained sufficiently strong to ensure effective edge detection. The utilisation of C-points within the TM5 band of the same PCS structure is shown in Supplementary Fig. S8 and allows for the realisation of both the edge detection and bright-field imaging modes.
-
In summary, we introduced a novel approach for realising a dual-functional PCS imager capable of spin-dependent bright-field and edge-detection modes, harnessing the unique properties of C-points in PCS platforms. Our proposed method enables the generation of two distinct sets of OTFs driven by the chirality selectivity of the C-points, thereby laying the foundation for a switchable imaging system. Theoretical analysis and experimental validation have demonstrated that the imager can be incorporated into traditional imaging systems, offering switchable edge detection and imaging under circularly polarised light with high resolution. We believe that this study will enrich the manipulation of C-points in chiral sensing and image processing in the future.
-
Numerical simulations: Eigenmode simulations of the PCS were conducted using a finite-element method with a commercial eigenfrequency solver. Subsequently, the transmission and CD spectra were computed using a commercial frequency domain solver. Periodic boundary conditions were applied in the x and y directions, whereas perfectly matched layers were employed in the z direction. The simulations depicted in Fig. 4, which include both bright-field and edge-enhanced imaging, were executed using a custom MATLAB code developed specifically for the imaging system. Fresnel diffraction was simulated using Fresnel diffraction integrals. The amplitude and phase response of the lenses were modeled using the following specific phase distribution for a lens40,
$$ \phi \left(r\right)=\frac{2\pi }{r}(f-\sqrt{{f}^{2}+{r}^{2}}) $$ Furthermore, the complex-valued OTFs of the PCS imager were integrated into the imaging system using the Fourier transform and inverse Fourier transform methods, given that the OTFs operate within the momentum space. This computational framework allowed for the acquisition of the light-field amplitude and phase distributions at any position within the imaging system, thereby enabling the numerical realisation of the desired 4-f imaging process.
Sample fabrication: The samples were fabricated using a multistage process, beginning with EBL, followed by RIE. Initially, the 200-nm-thick layer of silicon nitride (Si3N4) layer was deposited onto a 500-µm-thick fused silica substrate by using Plasma Enhanced Chemical Vapor Deposition (PECVD) at a temperature of 300 ℃. Subsequently, the sample was spin-coated with a 600 nm-thick film of a positron beam resist (AR-P 6200). Following this, a 100-nm-thick layer of a water-soluble conductive polymer (AR-PC 5090) was spin-coated onto the resist for electron-beam charge dissipation. EBL (ELS-F125, Elionix) was used to pattern the photonic crystal structures onto the resist layer. After patterning, the conductive polymer was dissolved in water and the resist was developed in a resist developer solution. Subsequently, the chip was subjected to heating at 130 ℃ for 1 min to enhance the strength of the photoresist mask. The pattern was then transferred to the underlying Si3N4 layer by dry etching in an Inductively Coupled Plasma (ICP) machine (ULVAC CE300I) using SF6 and CHF3 as the etching gases. Finally, the resist mask was removed using a solvent (N-Methylpyrrolidone) and degummed using an oxygen plasma drying method to prevent any residual photoresist from affecting subsequent experiments.
-
This work was supported in part by the National Key Research and Development Program of China under Grant 2022YFA1405000, in part by the Natural Science Foundation of Jiangsu Province through Major Project under Grant BK20243067, in part by the Leading-Edge Technology Program of Jiangsu Natural Science Foundation under Grant BK20232001, in part by the National Natural Science Fund for Excellent Young Scholars (Overseas), in part by Fundamental Research Funds for the Central Universities, and in part by Nanjing University Integrated Research Platform of the Ministry of Education - Top Talents Program.
Spin-dependent edge detection and imaging enabled by optical circularly polarised states
-
Jiale Chen1, 2,
 ,
, - Zhao-xian Chen3,
- Zi-xin Zhou1, 2,
-
Yan-qing Lu1, 3, 4, *, ,
,
-
Jun-long Kou1, 2, 4, *, ,
- Light: Advanced Manufacturing 6, Article number: 8 (2025)
- Received: 12 July 2024
- Revised: 19 November 2024
- Accepted: 04 December 2024 Published online: 06 February 2025
doi: https://doi.org/10.37188/lam.2025.008
Abstract: In photonic crystal slab (PCS) structures, the bound states in the continuum (BICs) and circularly polarised states (dubbed C-points) are critical topological polarisation singularities in momentum space that have garnered significant attention owing to their novel topological and optical properties. In this study, we engineered a novel PCS imager featuring two C-points with opposite chirality through symmetry breaking, resulting in maximal asymmetric transmission responses characterised by near-unity circular dichroism (CD) values. By harnessing the chiral selectivity of the C-points, a high-CD PCS imager can provide two sets of optical transfer functions (OTFs) to facilitate both edge detection and bright-field imaging. Notably, one set of OTFs was finely tuned to a Lorentzian line shape to achieve perfect edge detection. We developed a multifunctional imaging system by integrating a PCS imager into a traditional optical system. Both theoretical and experimental demonstrations confirmed that this system provides bright-field and edge-enhanced images with micrometer-scale resolution. Furthermore, these two independent functions can be easily switched by altering the circular polarisation state of the light source.
Research Summary
Spin-dependent edge detection and imaging enabled by C-points
A new nanophotonic imager offers spin-dependent edge detection and bright-field imaging, showing promise for applications in biological imaging and computer vision. Researchers utilized the chirality selectivity at circularly polarized points (C-points) of a proper designed photonic crystal slab (PCS) to construct two different optical transfer functions for edge enhancement and imaging. Jun-long Kou from Nanjing University and colleagues achieved wavelength-scale high resolution in both imaging modes, as confirmed by numerical and experimental demonstrations. The chiral PCS imager's dual functions can be dynamically switched by altering the circular polarisation of the incident light, showcasing its flexibility and practicality in real-time optical image processing. This innovative PCS imager broadens the application of C-points in photonic crystals to emerging fields of optical computing and imaging, leading to broad prospects for data compression, intelligent recognition, biomedical engineering and other related fields.
Rights and permissions
Open Access This article is licensed under a Creative Commons Attribution 4.0 International License, which permits use, sharing, adaptation, distribution and reproduction in any medium or format, as long as you give appropriate credit to the original author(s) and the source, provide a link to the Creative Commons license, and indicate if changes were made. The images or other third party material in this article are included in the article′s Creative Commons license, unless indicated otherwise in a credit line to the material. If material is not included in the article′s Creative Commons license and your intended use is not permitted by statutory regulation or exceeds the permitted use, you will need to obtain permission directly from the copyright holder. To view a copy of this license, visit http://creativecommons.org/licenses/by/4.0/.

 DownLoad: