


-
Laser polishing (LP) has recently emerged as a promising advanced manufacturing technology for producing ultra-smooth surfaces owing to its non-contact operation, high efficiency, environmental friendliness, and compatibility with complex surfaces and materials. LP has gained attention in various fields, such as additive manufacturing1–6, optical components7–12, mould manufacturing13–16, and biomedical engineering17. However, LP has not yet achieved industrial success compared with other types of laser heat processing techniques, attributed to several factors, including its relatively short development time, unclear mechanisms, and the lack of specialised equipment18. LP was introduced approximately 20 years ago, after other laser heat treatment processes, and has not received sufficient attention from scientists and engineers. Additionally, the absence of specialised equipment to observe real-time changes in the molten pool morphology during LP, similar to the use of X-ray diffractometers in additive manufacturing, significantly limits our understanding of the LP mechanism, which involves rapid dynamic changes in material properties under laser irradiation. For most metals and glass materials, the viscous flow of molten materials driven by surface tension is generally considered the main contributor to smoothing2,19–21, while many studies have reported that the evaporation of materials also plays a significant role22,23 and is even the leading polishing mechanism for some materials such as diamond7,24–26. In addition, the formation mechanism of mid-frequency waviness (MFW), which limits the performance of LP on a large spatial scale27,28, needs to be clarified. Current viewpoints on MFW include the Marangoni effect 19, non-uniform removal of materials29, surface vapour pressure30, and fictive temperature (for glass)31,32. The role of the Marangoni effect remains controversial, with some researchers believing that it directly leads to the formation of MFW19, while some argue that it can accelerate the smoothing process, thus playing an active role in LP20. Finally, considering LP is the result of the combined action of a series of thermal physical phenomena, including heat conduction, convection, radiation, surface tension, phase change, gravity and melt flow, evaporation, and surface vapour pressure, understanding when and how these effects occur is critical for optimising the resultant roughness.
To gain a deeper understanding of the underlying mechanisms of LP, efforts in two directions are critical: establishing more accurate multi-physics models to replicate thermal and fluid physical processes of LP and conducting real-time in situ monitoring of the process parameters and results. Most studies have focused on the former direction22,23, with early LP models primarily reliant on analytical33 and statistical34 models, which depend heavily on summarising experimental process parameters and measurement results. In recent years, progress in commercial finite element software has advanced the development of LP modelling. This mainstream research method uses multi-physics finite element models (FEM) to calculate heat transfer, phase changes, flow fields, and weak liquid-phase viscous forces during the heating process before mutually corroborating the surface morphology after cooling with experimental results3,5,35. For example, we modelled and experimentally verified LP for glass and titanium alloy materials and, from the perspective of the surface smoothing time scale, proposed that the optimal irradiation time in LP is jointly determined by the liquid-phase viscosity of the material and the laser power density27,36. However, the lack of complete/comprehensive temperature-related material physical parameters necessitates using an empirical simplification in the model, and an indirect comparison between simulations and experiments limits its effectiveness in guiding specific processing parameters.
While real-time and in situ measurements of various key process parameters are crucial, similar to other thermal-based manufacturing processes (such as welding), only a few LP parameters can be accurately and immediately measured, with the surface after polishing requiring evaluation at the submicron or even nanometre scale. The most commonly measured parameter is temperature12,37; however, the relationship between the temperature and polishing quality is still not sufficiently direct. Direct imaging observation of the processing area and high-speed dynamic measurement of the surface morphology evolution are highly attractive. The difficulty lies in the LP-specific small molten pool, nano/micron-level accuracy, and extremely fast process, which requires extremely high temporal and spatial resolutions. High-speed X-ray imaging technology has shown promise as it captures the evolution of keyhole formation in additive manufacturing with microsecond-level temporal resolution and micrometer-level spatial resolution38–40. However, the complexity of the X-ray equipment (large accelerators) and sample preparation makes it almost impossible to apply it to industrial equipment. While the optical holographic online measurement system developed by the Fraunhofer Institute is highly practical41, CMOS-based imaging restricts the upper limit of the observation rate. OCT methods can conduct most of the monitoring during laser processing but cannot fulfil the need for nanoscale resolution42. The current consensus is that further development of LP strongly depends on high-speed, high-resolution online measurement technology.
In this study, to reveal the nanosecond-scale dynamics in LP, we employed optical time-stretch quantitative interferometry (OTS-QI) to monitor the evolution of the material surface topography during LP in real time. Benefiting from the high spatial resolution (< 1 µm), high temporal resolution (< 10 ns), and the capability of continuous image acquisition of OTS-QI43, we investigated the entire laser-material interaction process during the quartz glass surface polishing with a CO2 laser. Specifically, we recorded the thermal expansion, surface smoothness, Marangoni flow, and evaporation removal after laser irradiation on a glass surface. To the best of our knowledge, this is the first time LP dynamics were quantitatively and virtually measured at the nanosecond level. Additionally, we compared the measurement results with that of our self-built multi-physical field model, yielding highly consistent results. This study clarifies the time scales and effects of various phenomena (mechanisms) in LP, which can be utilised to optimise processing parameters. Specifically, we confirmed that the formation of MFW in the LP is primarily attributed to two mechanisms: the Marangoni effect and non-uniform evaporation. Fortunately, they occur after surface smoothing, thus providing a favourable polishing window. This window facilitates reducing surface roughness to a minimum and suppressing MFW by manipulating the process parameters. Furthermore, the OTS-QI used in this study was confirmed as a promising candidate for real-time, in situ, and quantitative laser processing measurements.
-
A schematic diagram of the experimental setup is shown in Fig. 1a. The glass sample is irradiated using a CO2 laser with a centre wavelength of 10.6 μm and a maximum power of 30 W. In this configuration, the CO2 laser beam was maintained in the horizontal plane at an angle of approximately 15° relative to the vertical axis of the sample. To measure the dynamics during irradiation, the temporally stretched femtosecond laser-chirped pulse was first split into signal and reference paths. In the signal path, the pulse was spatially dispersed and focused on the surface of the glass by the first diffraction grating and objective lens, respectively. Therefore, variations on the glass surface were mapped onto the probe-pulse spectrum. Subsequently, the 1D rainbow pulse was collected and spatially recombined by the second objective lens and diffraction grating with the same parameters as the first. Considering temporal stretching, also known as dispersive Fourier transform, has already linked the temporal and frequency domains of the pulse, the spatial information of the glass was mapped onto the temporal waveform of the pulse. To acquire the intensity and phase of the pulse simultaneously, the pulses of the signal and reference paths were coupled and detected by the photodetector. Finally, the 1D interference signal I(t) is sampled by a digitiser and processed in the digital domain to recover the images of the glass.
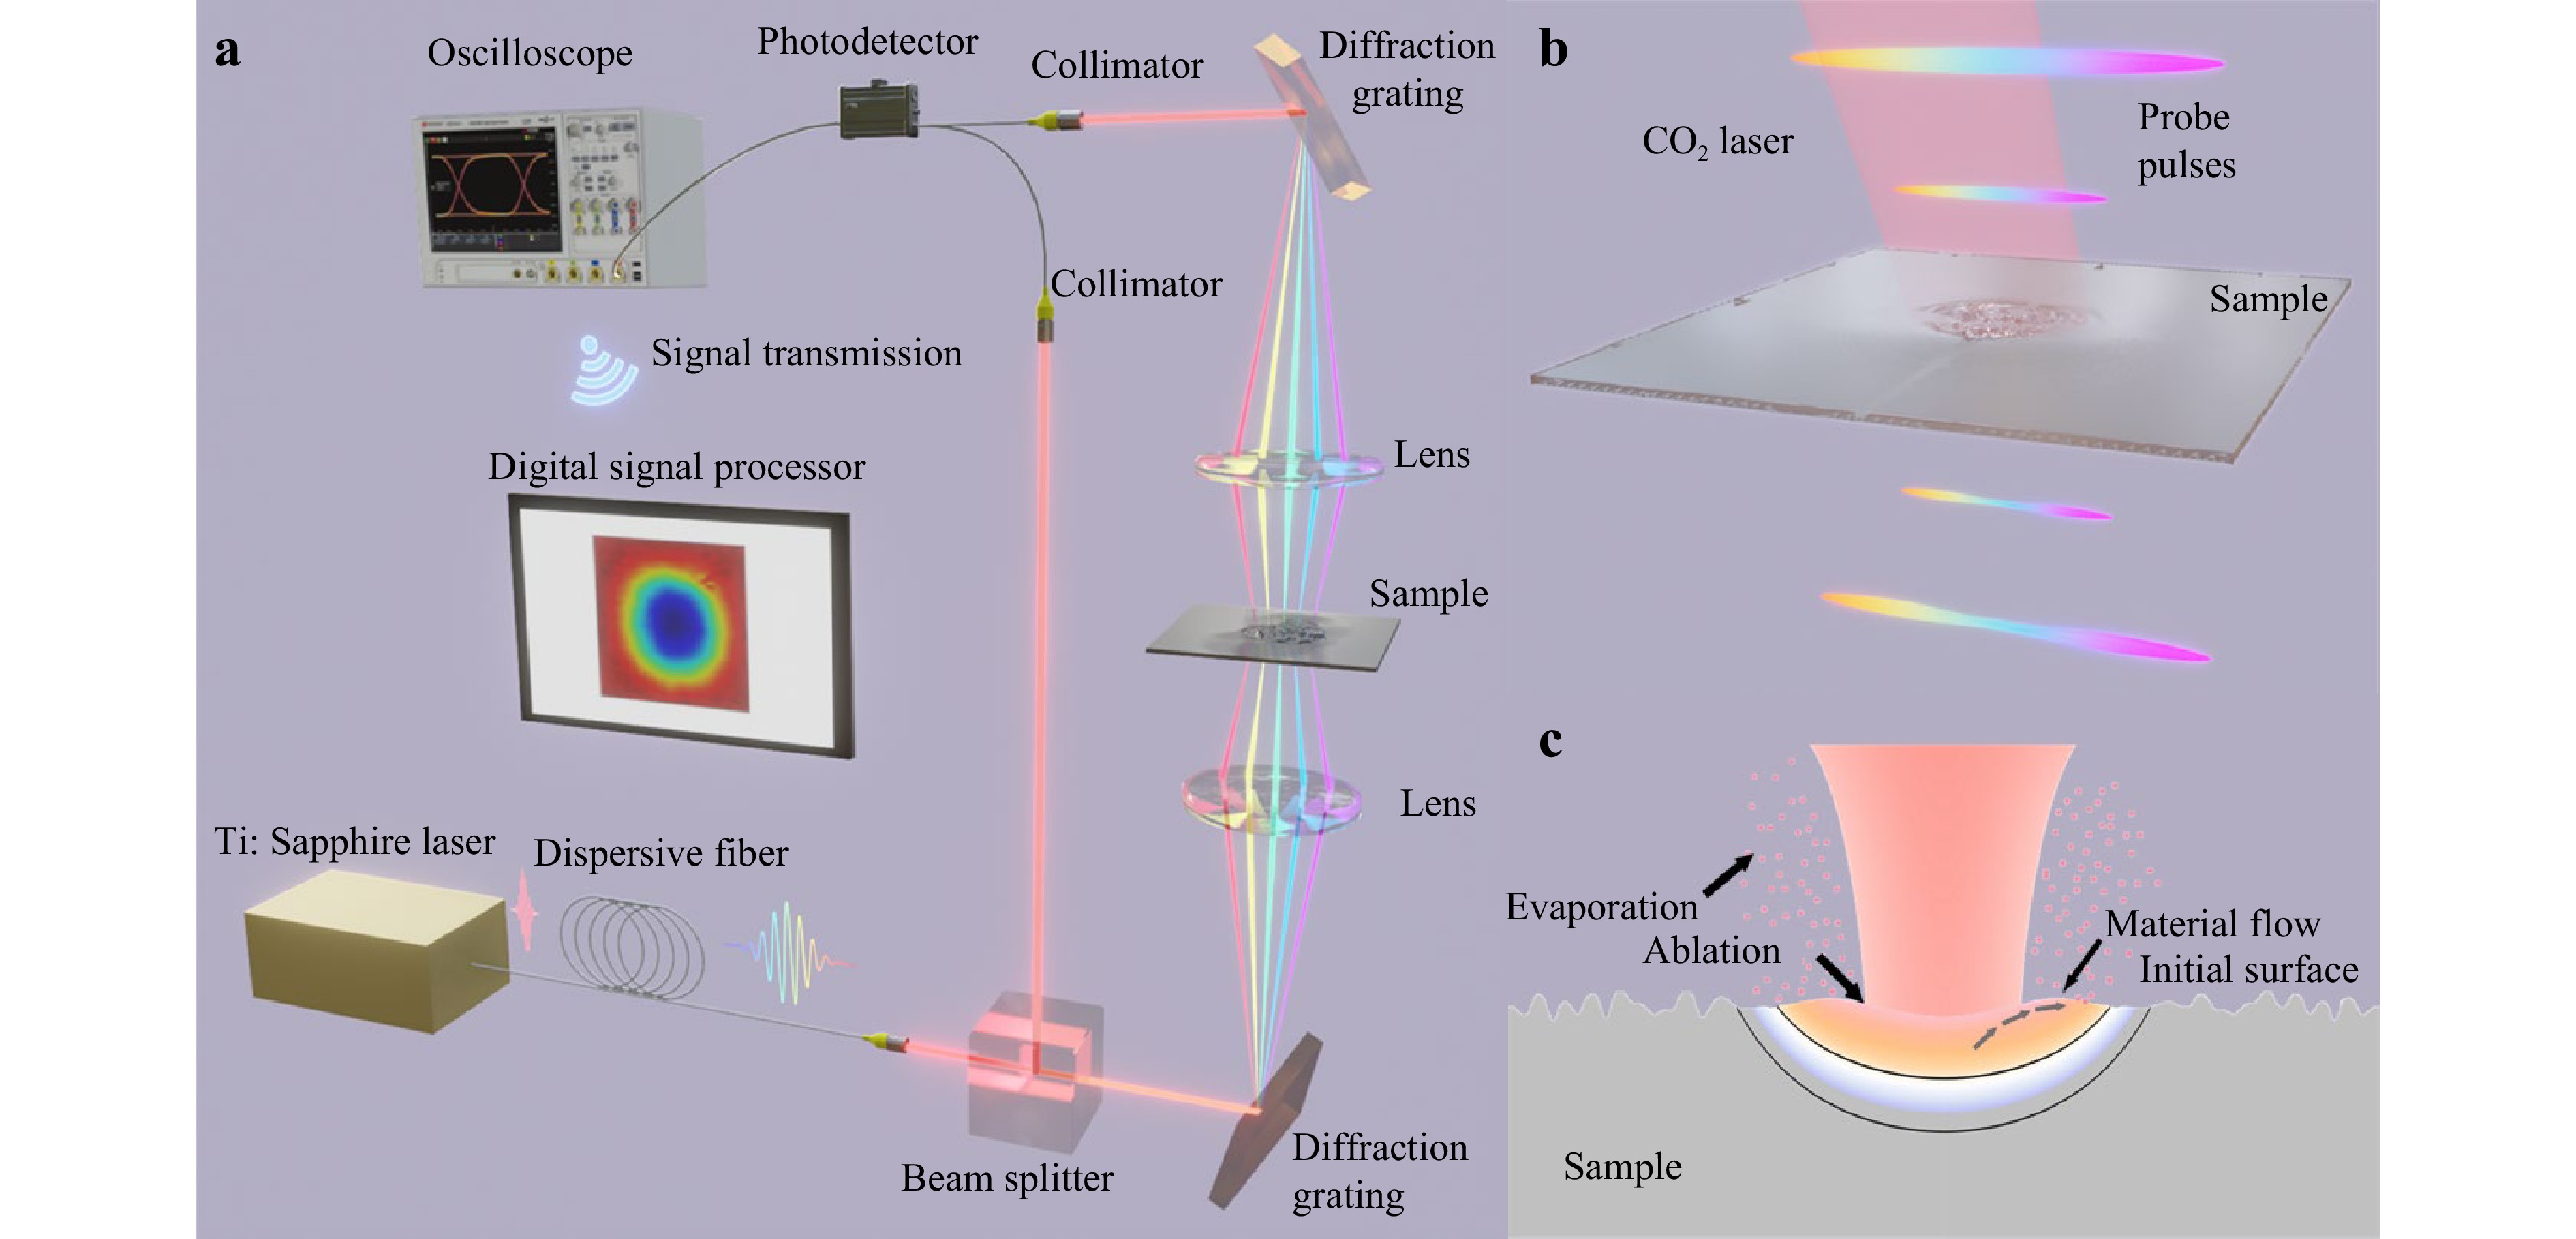
Fig. 1 Experimental observation and numerical simulation of surface topography evolution in LP. a Real-time and in situ observation of LP using OTS-QI. Temporally stretched femtosecond pulses are split into two paths, one for signal detection and the other as the reference. The pulses in the signal path are spatially dispersed and focused onto the polishing area. After recording the surface topography evolution during LP, the pulses are spatially recombined and coupled with the reference pulses for photodetection later. Finally, the images of the temporal evolution during LP are recovered by digital signal processing. b Positional relationship between the CO2 laser irradiated on the sample and probe pulse. c. Multi-physics model used to numerically analyse the dynamic process in LP, where heat transfer, phase change, microflow, and evaporation are considered.
To better capture a real-world scenario, as depicted in Fig. 1c, a multi-physics FEM was designed as a reference. A two-dimensional model of a full-size sample was established to accurately calculate the solid heat transfer, thereby overcoming the drawback of inaccurate boundary conditions observed in most micro-area models. Subsequently, a micro-area was selected within the laser irradiation area for mesh refinement and dynamic analysis, which included the phase transformation, flow field, evaporation, and other pertinent factors. Detailed information regarding the specific boundary condition settings and control equations is provided in Fig. S1 and Table S1. The physical parameters of the materials are listed in Table S2. In the calculation time range, large-scale Marangoni flow and material evaporation are also accounted for, as these phenomena can occur readily despite not being the intended outcome of the LP process.
-
To demonstrate the performance of the OTS-QI, we measured the images of quartz glass processed with the CO2 laser using an optical microscope, a 3D optical surface profiler, and an OTS-QI. As shown in Fig. 1, in OTS-QI, the probe pulse exhibited a linear shape as it passed through the sample. Therefore, in this experiment, we mounted a glass sample on a one-dimensional (1D) y-axis-moved motorised translation stage. As shown in Fig. 2a, each pulse measured one cross-section of the sample. The pulses covered the entire sample surface as the stage moved from the top to the bottom. By stacking z(x, t0), the 2D surface topography z(x, y) of the sample could be recovered on the y-axis (see Materials and Methods). The inset of Fig. 2a shows the image of the standard USAF-1951 resolution chart, and the spatial resolution of the OTS-QI is 7.81 µm. The lateral spatial resolution of the system can be readily enhanced to the optical diffraction limit corresponding to the detection wavelength. However, this enhancement necessitates a trade-off in the spatial range of measurements. The initial roughness of the glass surface was 0.22 µm, and the power density of the laser beam was 7.0 × 10⁴ W/cm2. We irradiated the glass surface for 10 ms, 20 ms, and 40 ms, with the images of the glass samples acquired using the three different methods shown in Fig. 2b. The intensity and phase images acquired with OTS-QI exhibited high similarity to those obtained using a microscope and 3D optical surface profiler. These images reveal that, with an increase in processing time, the central region of the sample undergoes successive stages of smoothing and ablation.
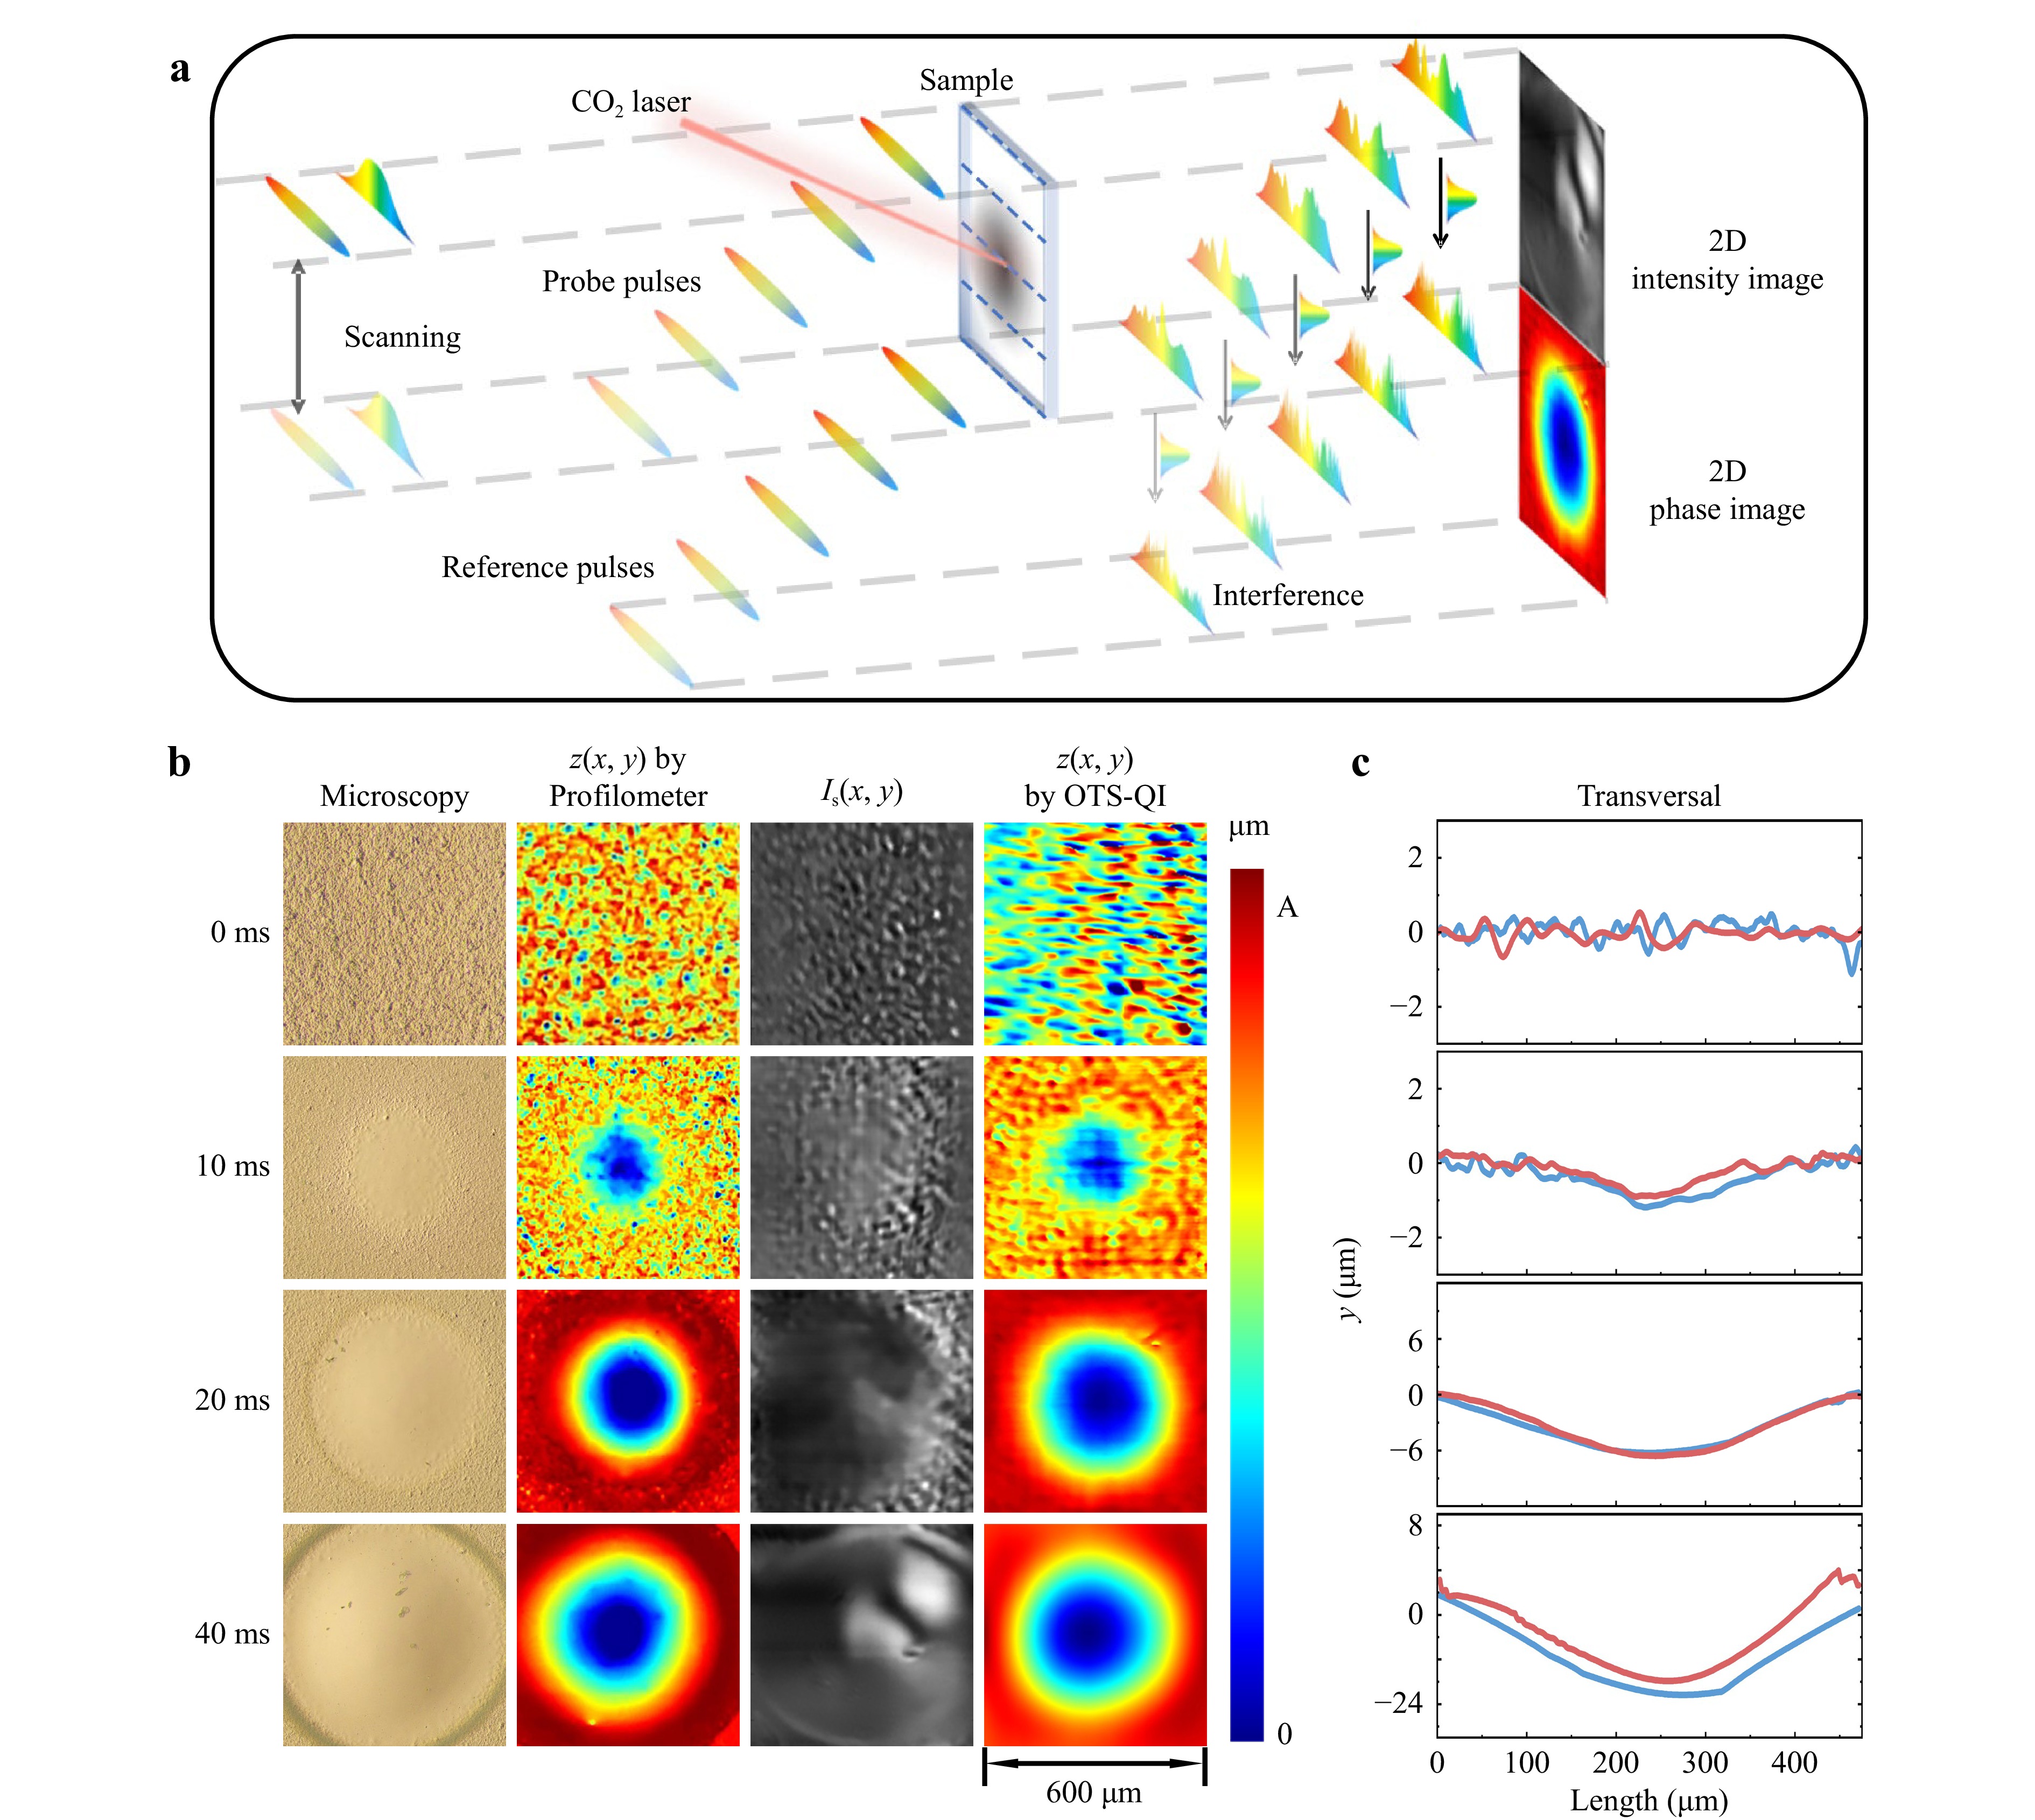
Fig. 2 Imaging performance of OTS-QI. a Principle of 2D image recovery. b 2D surface topography of glass acquired using a conventional microscope, a 3D profilometer, and the proposed OTS-QI with a processing time of 0 ms, 10 ms, 20 ms, and 40 ms at a power density of 7.0 × 10⁴ W/cm2, respectively. c Cross-sections of the images acquired by the 3D profilometer and proposed OTS-QI.
Furthermore, in Fig. 2c, we depict the cross-sections of the images acquired with our OTS-QI and the 3D optical surface profiler with different processing times. We employed the relevant factor, defined as
$$ {\rho _{xy}} = \frac{{\mathop \sum \nolimits_{n = 1}^N \left( {{x_n} - \bar x} \right)\left( {{y_n} - \bar y} \right)}}{{\sqrt {\mathop \sum \nolimits_{n = 1}^N {{\left( {{x_n} - \bar x} \right)}^2} \cdot \mathop \sum \nolimits_{n = 1}^N {{\left( {{y_n} - \bar y} \right)}^2}} }} $$ (1) to quantitatively evaluate the differences between the curves. In Eq. 1, xn and yn represent the 1D data of the curves acquired using the OTS-QI and optical profiler, respectively. The results show that the relevance of all the curve pairs in Fig. 2c is greater than 0.9, indicating that the accuracy of our OTS-QI is almost identical to that of the optical profiler.
-
Alternatively, as shown in Fig. 3a, we can also fix the position of the 1D rainbow beam on the surface of the glass and then start laser processing and measurement simultaneously. Owing to the high repetition rate of the probe pulse (~100 MHz), each pulse measures z(x, t) at a specific time t. Hence, by stacking the pulses, an image recording the temporal evolution of the material surface during LP can be obtained. In the experiment, the glass sample was illuminated by a CO2 laser with a power density of 7.0 × 10⁴ W/cm2 for 50 ms before turning off the laser. The surface evolution over 100 ms, including 50 ms for processing and 50 ms for cooling, was measured by our OTS-QI, and z(x, t) at different times is plotted as black curves in Fig. 3b. We simulated the same process using the numerical model and show images of the glass sample at the corresponding times in Fig. 3b. Both the experimental and numerical results showed that, as the processing started, the centre part of the glass bulged owing to an increase in the local temperature. When the temperature reaches the glass softening point, the material tends to flow towards a smaller surface area owing to surface tension, decreasing the roughness. The roughness of the glass surface reached its minimum value at approximately 25 ms. As heating continued, the temperature at the centre reached the evaporation point. The Marangoni effect causes the liquid in the molten pool to flow from the centre to the sides while simultaneously ablating the pool centre. Combining these two factors results in the gradual formation of a pit at the laser irradiation centre, with a convex edge commonly known as a ‘crater’ shape. Thus, the formation of the MFW is primarily attributed to the Marangoni effect and ablation, both of which occur over prolonged interaction times. After laser irradiation was terminated, the material was rapidly cooled. The correspondence between the experimental and numerical results indicated that the OTS-QI system accurately and efficiently captured and recorded the evolution of the surface topography during the LP in situ and in real time.

Fig. 3 Temporal evolution of glass surface topography during LP. a Image construction of glass surface topography evolution during LP. b Numerical (colour regions) and experimental (black curves) results of the glass surface topography at different time points during LP. As LP starts, surface thermal expansion occurs first, followed by the smoothing process of shallow melt microflow at 20–25 ms, the Marangoni flow from 27 ms, and ablation from 30 ms to 50 ms. As the laser is turned off at 50 ms, the surface starts to cool down, eventually resulting in a crater shape at 70 ms.
These findings provide a comprehensive picture of the evolution of surface topography during LP. As shown in Fig. 4, the glass surface underwent a sequence of transformations, including thermal expansion, smoothing flow, wavy flow, and ablation, from the beginning of the process. Thermal expansion does not directly affect the final processing outcome. Although Marangoni flow is always present in physics, in the early stages, the smoothing process driven by the surface tension was dominated by the shallow molten pool. As the molten pool expanded, the disadvantages of the Marangoni effect began to emerge, leading to the formation of waviness on a large spatial scale. As the temperature of the molten pool needs to be controlled just below the evaporation point in LP, the fluctuations in laser power (e.g., the typical stability of industrial CO2 lasers is ±5%) and the differences in thermal processes at different locations unavoidably cause slight ablation in random areas, resulting in random MFW. Therefore, the smoothness achieved depends strongly on when laser processing is terminated.
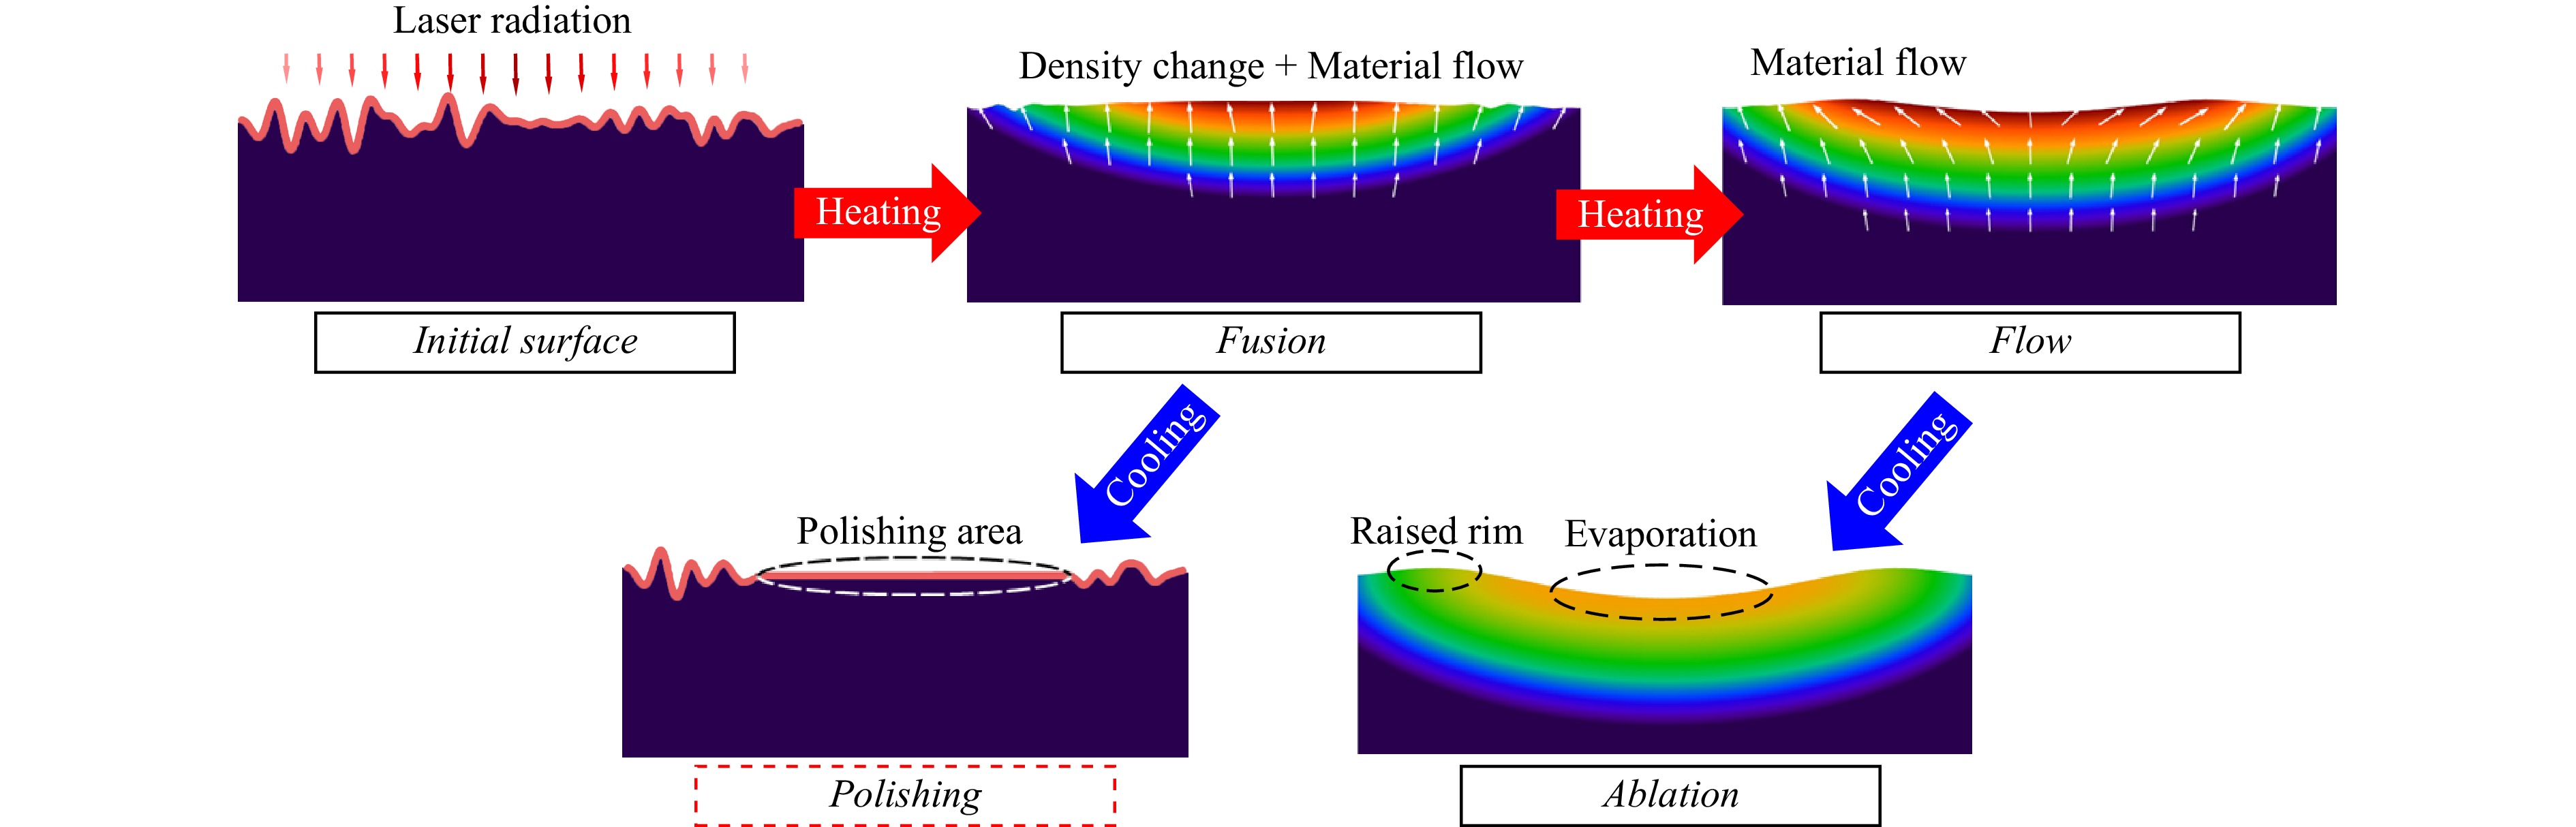
Fig. 4 Schematic diagram of the surface topography evolution of quartz glass during LP. As LP starts, a series of transformations occur successively, including melting, flow, smoothing, and ablation processes. Notably, the process of shallow melting and surface smoothing is transient. Therefore, the achieved surface roughness highly depends on when the heating is terminated. The minimum surface roughness can be acquired when the processing is terminated at a certain point; otherwise, Marangoni flow and ablation will occur on the surface, resulting in MFW.
-
The aforementioned phenomenon indicates the existence of a ‘polishing window’, which facilitates controlling the interaction time between the laser and the material, thus allowing the processing area to begin cooling just as the roughness decreases to its minimum value, thereby avoiding uneven flow and material removal. This window constitutes an essential foundation for the theoretical feasibility of LP processes. We refer to this window as the ‘perfect polishing point’, denoting a specific action time for a given laser power density at which roughness can be reduced to its lowest value. As illustrated in Fig. 5a, we measured the temporal evolution of the laser-polished glass surfaces at different power densities ranging from 3.5 × 10⁴ W/cm2 to 1.4 × 10⁵ W/cm2. The four critical time points—T1, T2, T3, and T4—represent the moments when the measurement starts, heating starts, heating stops, and the measurement ends, respectively. Except for the power density of 3.5 × 10⁴ W/cm2, insufficient to melt the surface within the given processing time, the other three figures exhibit a similar trend as that in Fig. 3. Additionally, owing to the quantitative measurement capability of OTS-QI, the specific values of surface roughness directly correspond to z(x, t), allowing us to detect changes in roughness with nanosecond accuracy, as shown by the solid line in Fig. 5b. To facilitate the comparison, we included the results generated by the numerical model (shown as dashed lines). Both the experimental and numerical results demonstrate the existence of a perfect polishing point, which represents the processing window we strive to achieve in practice.
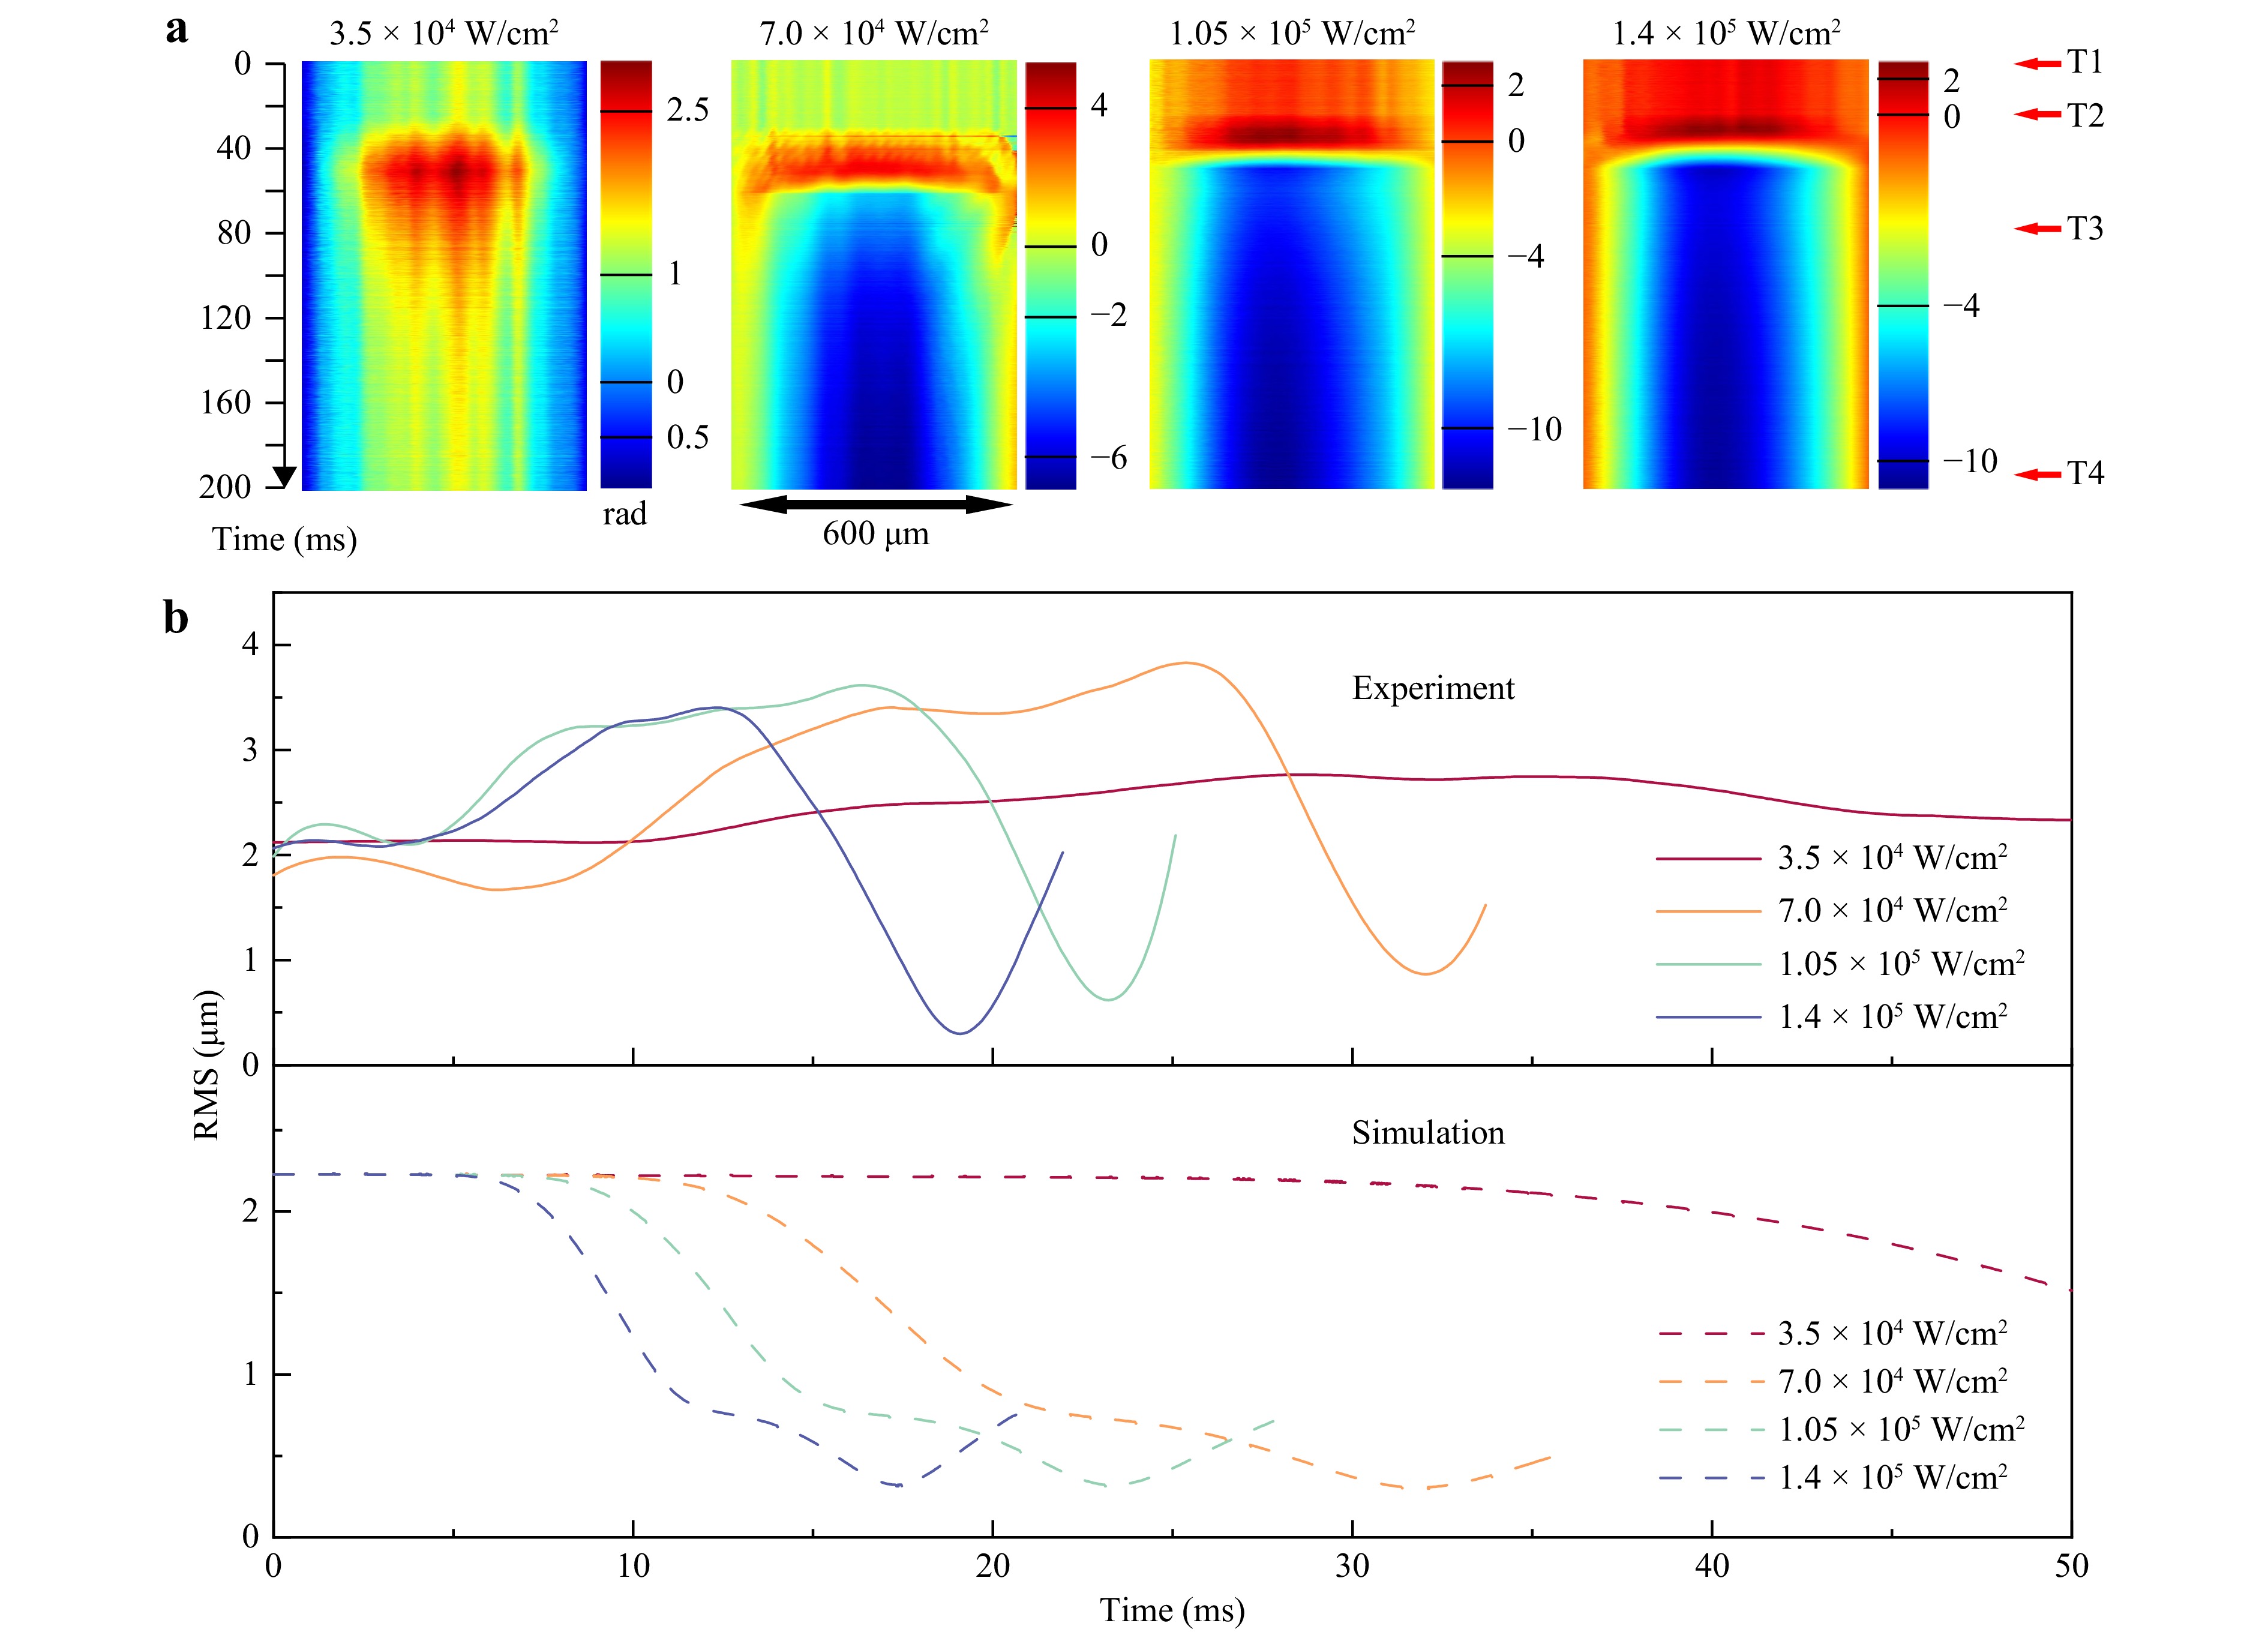
Fig. 5 Temporal evolution of the quartz glass topography during LP under different power densities. a Images of temporal evolution of the quartz glass topography under laser power densities of 3.5 × 10⁴ W/cm2, 7.0 × 10⁴ W/cm2, 1.05 × 10⁵ W/cm2, and 1.4 × 10⁵ W/cm2, respectively. T1, T2, T3 and T4 represent the moments of the start of the measurement, heating started, heating stopped, and the end of the measurement, respectively. b Temporal evolution of the surface roughness of the quartz glass during LP under different laser power densities acquired by OTS-QI and the simulation. The perfect consistency between the experimental and numerical results indicates that OTS-QI can achieve high-speed and accurate quantitative measurement of surface roughness during LP.
In practice, the beam scanning of a material surface is necessary to polish a specific surface area, with the interaction time determined by the size of the light spot and the scanning speed; therefore, a ‘perfect polishing point’ can be considered an optimal combination of power density and scanning speed. Fig. 6 presents the experimental results of the scanning polishing process conducted at a peak power density of 800 W/cm2 and scanning speeds ranging from 0.03 mm/s to 0.25 mm/s. To analyse the data, we converted the X-axis in Fig. 5b from time to scanning speed, with the calculated surface RMS variation curve shown in Fig. 6a. We selected four typical scanning speeds and measured their corresponding surface topographies. The measured topographies before and after applying the roughness filter are shown in Fig. 6b, with the calculated RMS values indicated for comparison in Fig. 6a. The results indicate that excessively high scanning speeds result in insufficient re-melting flow (Fig. 6bI), whereas excessively low scanning speeds lead to Marangoni flow (Fig. 6bIII) and significant material removal (Fig. 6bIV). The optimal scanning speed corresponded to the proposed ‘perfect polishing point’ (Fig. 6bII). In Figs. 6bIII, IV, despite a pronounced MFW caused by Marangoni flow and non-uniform removal, the micro-roughness does not exhibit a significant increase. This finding aligns with our theoretical predictions using FEM and the observations using OTS-QI.
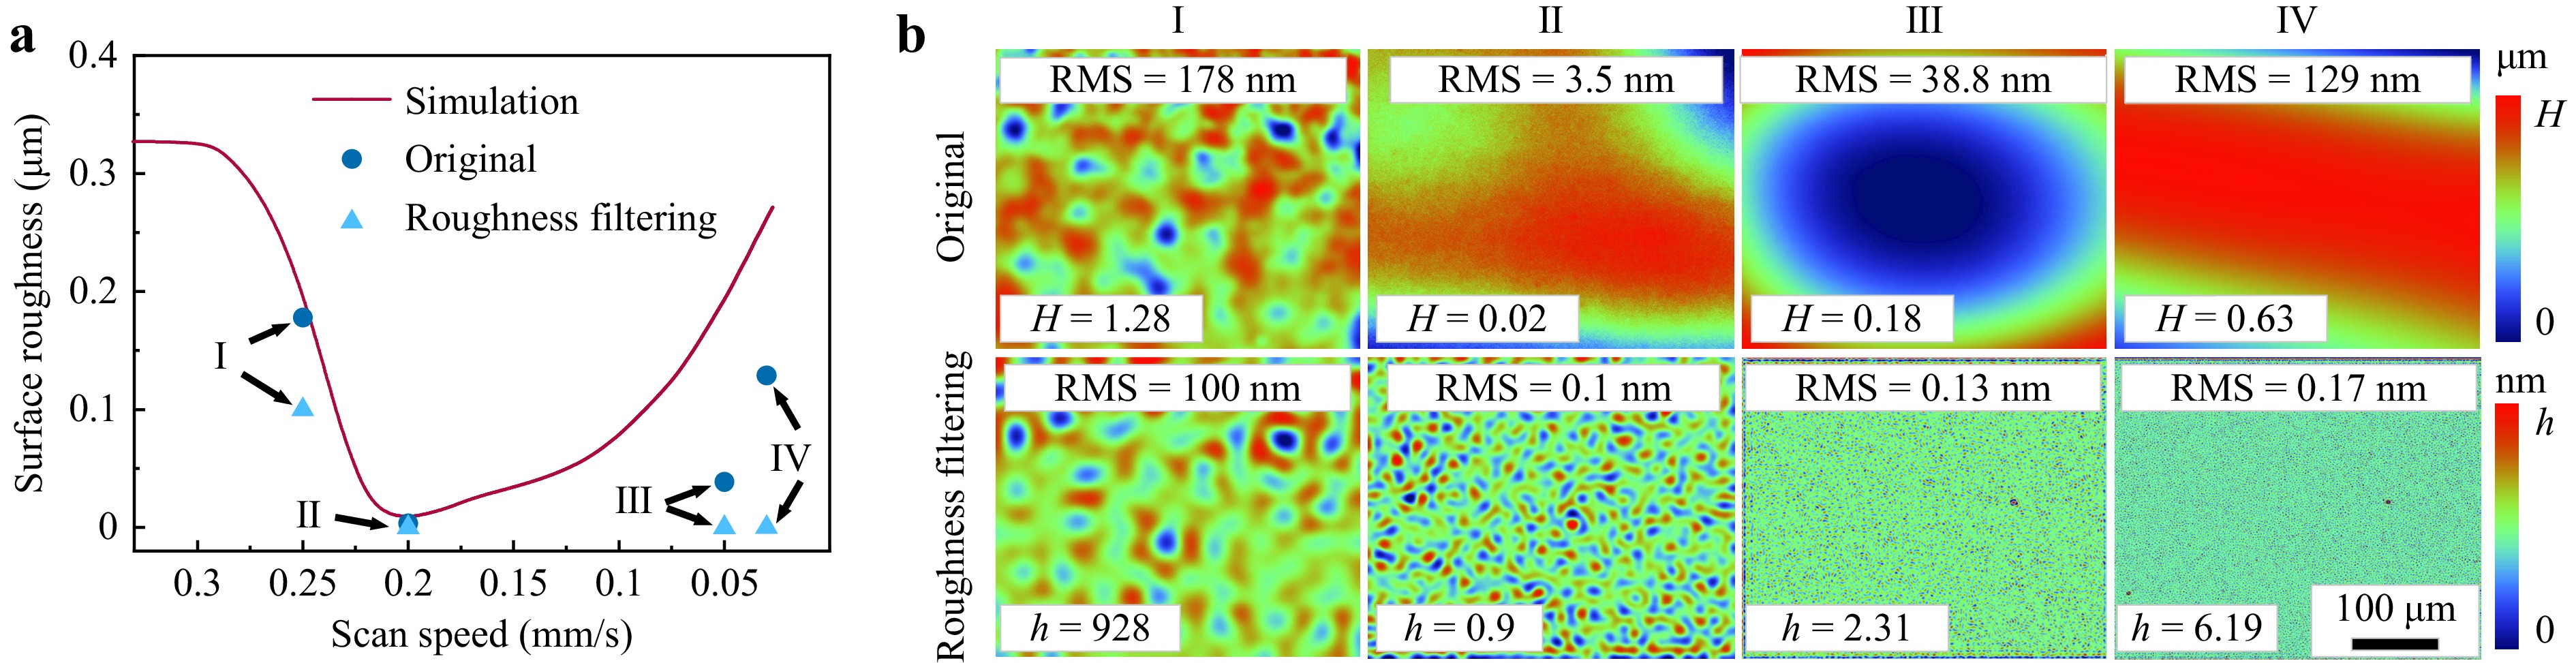
Fig. 6 Surface roughness evolution of CO2 laser polished quartz glass under different scanning speeds. a Surface roughness under different scanning speeds with a CO2 laser power density of 800 W/cm2. b Surface topography measured by a white light interferometer (WLI) under different scanning speeds. The upper images show the original results, while the lower images are the results after roughness filtering. The results demonstrate that optimal polishing is achieved at the scanning speed of 0.2 mm/s, where the RMS reduced from >300 nm to 3.5 nm, and the corresponding microroughness is 0.1 nm, aligning with our perfect polishing point theory acquired using OTS-QI.
-
The proposed concept of a ‘perfect polishing point’ was explored using finite element models and indirect processing experiments in our previous research on titanium alloys and quartz glass. In this study, we directly confirmed the time scale of each mechanism during the LP for the first time using OTS-QI technology. Our observations demonstrate that the Marangoni effect and non-uniform removal are important factors in forming an MFW; however, the results also indicate the existence of an extremely narrow process window that allows us to achieve the best polishing effect through strict control of the flow field in the molten pool.
However, stopping the laser irradiation for every position at the time of the perfect polishing point by simply controlling the process parameters is challenging owing to fluctuations in the laser power, differences in the thermal course at different locations, and the potential demands of complex geometric surfaces. The liquid viscosity of glass materials is approximately three orders of magnitude larger than that of metals, making the smoothing time of quartz glass hundreds of milliseconds. As a result, although we can achieve a time resolution of 10 ns, the morphological transformation of the polishing process shown in Fig. 3 occurs on a millisecond timescale. Considering the measurement rate of this system is determined by the repetition rate of the femtosecond laser used for detection, the nanosecond time resolution of the OTS-QI is fully applicable even for metal materials with faster smoothing flow rates (tens to hundreds of microseconds). Completing this experiment only requires changing the optical design of the system for the reflective measurement—an easy adjustment. Hence, the primary significance of OTS-QI technology is that it provides a real-time in situ monitoring method, which facilitates directly controlling laser power, scanning speed, and other process parameters based on real-time changes in surface roughness. Moreover, this method is cost-effective and industrially viable because of the maturity of lasers, photodetectors, and other components involved. In particular, the rapid advancement of high-repetition-rate femtosecond lasers has significantly enhanced the industrial application potential of this technology. Additionally, the system allows easy adjustment of the field of view for a single measurement via modifying the basic settings of the imaging optics and scanning strategy, thereby achieving an optimal balance between spatial resolution and sampling rate, making this method particularly well suited for multi-pass and large-area polishing processes involving moving or rotating workpieces. However, ultrahigh inspection speeds generate data streams exceeding 100 Gb/s, placing significant pressure on data transmission and processing equipment. Combining an FPGA with compressed sensing imaging can facilitate rapid data processing and transmission, enabling real-time feedback and regulation of the machining process. Hence, the OTS-QI technology is suitable for LP and offers considerable potential in any machining scenario involving high-speed detection of surface topography.
-
The source was a femtosecond laser (PriTel FFL-FR-PMFA) with a central wavelength of 1555 nm, bandwidth of 15–30 nm, pulse repetition frequency of 101.7 MHz, and average output power greater than 100 mW, with an adjustable pulse width and spectral width in the range of 100–400 fs and a 3 dB spectral width in the range of 15–30 nm, respectively. Each pulse of the laser was used for time-domain stretching by a 15 km single-mode fibre (SMF) (YofcA5H02621WB1) with a group velocity dispersion (GVD) of approximately 255 ns/nm and amplified by an erbium-doped fibre amplifier (EDFA) (GT-EDFA-C-T-200-FA-FA) with an optical gain of approximately 20 dB. The dispersed amplified pulses were split into two optical paths using a non-polarised beam splitter (Thorlabs BS006) with a power ratio of 50:50, forming a signal path and a reference path. In the signal path, the optical signal pulse was spatially dispersed through a diffraction grating (Thorlabs GR25-0616) with an inscribed line density of 600 lines/mm, resulting in a one-dimensional (1D) rainbow pulse focused on the laser processing area by a lens (Thorlabs LA1509-C, f = 100 mm) acting as an objective lens.
-
Interferometric fringes can be extracted by applying a digital high-pass filter to remove the low-frequency components. The interferogram was then Fourier transformed to obtain the real and imaginary parts of the transform, which are used to calculate the intensity and phase signals. A phase unwrapping algorithm is employed to obtain a continuous phase image44.
In an optical time-domain stretching quantitative phase microscopy system, the spatial information (x) of the laser processing region in intensity and phase is converted into the spectral information (ω) of the pulse via a conversion factor (B).
$$ {{\Delta }}x = B{{\Delta }}\omega $$ (2) The conversion factor (B), typically determined by the inscribed density of the diffraction grating (600 lines/mm), focal length (f) of the lens acting as the objective, and magnification of the 4f lens system in the system, is generally calibrated for confirmation by imaging a known resolution chart, such as the USAF-1951 resolution plate. This method is typically used to determine B in optical systems.
The temporal information of the detected signal (t) is obtained from the spectral information of the pulse (ω) via a conversion factor (C), also known as a temporal interferogram. This method is commonly used to convert spectral information into temporal information in pulse measurement systems.
$$ {{\Delta }}\omega = C{{\Delta }}t $$ (3) The conversion factor (C) was determined using the total group velocity dispersion (GVD) of the system. In this study, the GVD of a single-mode fibre (SMF) used for the time-domain stretching of the entire system was approximately equal to the total GVD of the system.
Eqs. 2 and 3 can be combined to obtain the following result:
$$ {{\Delta }}x = BC{{\Delta }}t $$ (4) According to Eq. 4, the spatial information (x) of the laser-processing region can be obtained by detecting the temporal information (t), which allows us to decode the temporal interferogram using the conventional QPI algorithm to construct an intensity and phase image of the laser-processing region. To create a frequency difference between the signal and reference path pulses, we partially aligned the reference path pulse in the time domain with the signal path pulse and adjusted the optical range difference between the reference and signal paths to s. Each temporal interferogram can be expressed as
$$ I(t) = {I_R}(t) + {I_S}(t) + 2\sqrt {{I_R}(t){I_S}(t)} \cos \left[ {K(t){{\Delta s}} + {\phi _S}(t)} \right] $$ (5) In Eq. 5, $ {I_R}(x) $ and $ {I_S}(x) $ represent the intensity values of the reference and signal pulses, respectively. The chirp rate of the temporal dispersion pulse is represented by $ K(t) $, while $ {\phi _S}(t) $ represents the phase information of the detected laser-processing region. By utilising the conversions of x and t in Eq. 4, Eq. 5 can be rewritten as follows:
$$ I(x) = {I_R}(x) + {I_S}(x) + 2\sqrt {{I_R}(x){I_S}(x)} \cos \left[ {\frac{{K(x){{\Delta s}}}}{{BC}} + {\phi _S}(x)} \right] $$ (6) Extract the intensity graph information $ {I_S}(x) $ and phase graph information $ {I_R}(x) $ from Eq. 6, respectively representing $ {I_S}(x) $ and $ {I_R}(x) $ in Eq. 6 as low-frequency components and high-frequency components, we can remove $ {I_S}(x) $ and $ {I_R}(x) $ by high-pass filtering and only retain the last term in Eq. 6, a high-frequency component (HFC). By applying the Hilbert transform in Eq. 6, the real and imaginary parts of the final term in Eq. 6.
$$ {\rm Re} [HFC] = \sqrt {{I_R}(x){I_S}(x)} \cos \left[ {\frac{{K(x){{\Delta }}s}}{{BC}} + {\phi _S}(x)} \right] $$ (7) $$ {\rm Im} [HFC] = \sqrt {{I_R}(x){I_S}(x)} \sin \left[ {\frac{{K(x){{\Delta }}s}}{{BC}} + {\phi _S}(x)} \right] $$ (8) Eq. 7 and Eq. 8 lead to:
$$ {I_S}(x) = \frac{{{\rm Re} {{[HFC]}^2} + {\rm Im} {{[HFC]}^2}}}{{{I_R}(x)}} $$ (9) $$ {\phi _S}(x) = \frac{1}{2}{\tan ^{ - 1}}\frac{{{\rm Im} [HFC]}}{{{\rm Re} [HFC]}} - \frac{{K(x)\Delta s}}{{BC}} $$ (10) Once the phase map information $ {\phi _S}(x) $ is obtained, the phase image of the detected laser processing area can be obtained using the phase demodulation method.
The optical path difference (OPD) of the pulse after passing through the sample as a function of the phase change is given by Eq. 11
$$ OPD(x) = \frac{{\lambda (x)}}{{2\pi }}{\phi _S}(x) $$ (11) The optical path difference of the pulse can also be expressed as
$$ OPD(x) = n(x) \cdot z(x) $$ (12) where n(x) is the refractive index of the sample at different locations and s(x) is the thickness of the sample at different locations
Therefore, height fluctuations on the sample surface can be expressed as
$$ \Delta z(x) = \frac{{\lambda (x)}}{{2\pi n(x)}}\Delta {\phi _S}(x) $$ (13) A two-dimensional static height fluctuation image $ \Delta z(x,y) $ of the melt pool can be reconstructed by stacking the one-dimensional height fluctuations $ \Delta z(x) $ in the above equation in space, while a one-dimensional dynamic height fluctuation image $ \Delta z(x,t) $ of the melt pool can be reconstructed by stacking the one-dimensional height fluctuations $ \Delta z(x) $ in the above equation in time. Similarly, the 2D static-intensity image $ {I_S}(x,y) $ of the melt pool can be obtained by spatially stacking the 1D intensity $ {I_S}(x) $ in Eq. 9.
Considering the transmissive time-domain stretching imaging system used in this study, the detection light with a wavelength of 1555 nm must penetrate the sample to record the surface information, as shown in Eq. 13, with the magnitude of the refractive index of the sample in the imaging system related to the height fluctuation obtained from the measurements. During in situ observations, the refractive index of the glass changes with temperature at different locations, i.e., different times and locations have different refractive indices, affecting the measurement of height fluctuations on the sample surface and becoming part of the cause of the experimental error.
To avoid the effect of refractive-index changes on the measurement results, reflective time-stretch quantitative interferometry will be used in the future.
-
The simulation principles and parameters are detailed in Supplementary Sections S1 and S2, respectively. The simulation results for quartz glass and a comparison with laser metal polishing are presented in Supplementary Section S3.
-
This research was supported by the National Natural Science Foundation of China (12374295, 62075200), the National Key Research and Development Program of China (2023YFB4603803), The Fund of National Key Laboratory of Plasma Physics (6142A04230201), Fundamental Research Funds for the Central Universities (2042023kf0113), and the Shenzhen Science and Technology Program (20JCYJ20220530140601003). We gratefully acknowledge Serendipity Lab for facilitating collaboration opportunities.
Dynamics of molten pool evolution and high-speed real-time optical measurement in laser polishing
-
Du Wang1, 2, *, ,
 ,
, - Mingjie Yu1,
- Yifan Yao1,
- Shaoyi Wang3,
- Yueyun Weng1,
- Shuang Zhao1,
- Fei Fan3,
- Keisuke Goda1, 4, 5,
- Sheng Liu1,
-
Zongqing Zhao3, *, ,
,
-
Cheng Lei1, 2, *, ,
- Light: Advanced Manufacturing 5, Article number: 50 (2024)
- Received: 09 May 2024
- Revised: 26 August 2024
- Accepted: 28 August 2024 Published online: 14 October 2024
doi: https://doi.org/10.37188/lam.2024.050
Abstract: Laser polishing (LP) is considered an effective method for generating ultrasmooth surfaces owing to its precision, flexibility, and material compatibility. However, a lack of understanding of the evolution of surface topography during LP significantly limits the achievable surface roughness in practice. In this work, for the first time, by employing optical time-stretch quantitative interferometry (OTS-QI), we recorded the entire evolution of surface topography during LP with nanosecond-level temporal resolution, providing insight into the mechanisms involved in the surface roughness evolution, such as the Marangoni effect and the formation mechanism of mid-frequency waviness (MFW). Assisted by numerical calculations, we reveal that a ‘perfect polishing point’ exists, i.e., the optimal interaction time for LP at a specific laser power density, at which the surface roughness can be minimised without the formation of an MFW owing to the Marangoni effect and non-uniform removal. This OTS-QI system harnesses the rapid repetition rate of femtosecond lasers, achieving a remarkable measurement speed exceeding 100,000,000 times per second while preserving a measurement accuracy comparable to that of existing white light interferometers (WLIs), setting a new benchmark as the fastest recorded roughness measurement. In addition to LP, the proposed method can be applied for real-time and in situ monitoring of many machining scenarios involving highly dynamic phenomena.
Research Summary
In-situ monitoring: Real-time optical quantitative measurement of melt pool
A device capable of quantitatively measuring surface topography with ns time resolution holds promise for real-time observation and regulation of laser processing. Optical time stretch is a data acquisition method that enables continuous imaging, reflectometry, terahertz and other measurements at refresh rates reaching billions of frames per second with non-stop recording spanning trillions of consecutive frames. The teams of Du Wang and Cheng Lei from Wuhan University and Zong-qing Zhao from China Academy of Engineering Physics report on the development of an optical time stretch quantitative measurement system that has been applied to the monitoring of surface morphology during laser polishing. The team used this method to confirm the time scale of each mechanism in the laser polishing, demonstrating that optimal polishing can be achieved by tightly controlling the flow field in the molten pool.
Rights and permissions
Open Access This article is licensed under a Creative Commons Attribution 4.0 International License, which permits use, sharing, adaptation, distribution and reproduction in any medium or format, as long as you give appropriate credit to the original author(s) and the source, provide a link to the Creative Commons license, and indicate if changes were made. The images or other third party material in this article are included in the article′s Creative Commons license, unless indicated otherwise in a credit line to the material. If material is not included in the article′s Creative Commons license and your intended use is not permitted by statutory regulation or exceeds the permitted use, you will need to obtain permission directly from the copyright holder. To view a copy of this license, visit http://creativecommons.org/licenses/by/4.0/.

 DownLoad: