


-
Optical spectrometers are powerful instruments utilized to decompose complex optical spectra and quantify the intensity of their various wavelength components. Their extensive applications span diverse fields like chemical analysis, environmental monitoring, material characterization, and even astronomical observation1. While traditional spectrometers often boast high spectral resolution and broad coverage, they also tend to be cumbersome due to their large dispersive optics, long optical paths, detector arrays, and movable parts. However, the modern need for portable or handheld spectral analysis devices, lab-on-chip systems, and smartphone integration2-4 demands a shift towards high-portability, easy integration, and real-time measurement capabilities. In this context, minimizing physical size, power consumption, and production costs often takes precedence over pure performance, leading to a surge in interest towards micro-spectrometers in recent years5-8.
A wide variety of micro-spectrometers have emerged since the early 1990s. The basic form of these micro-spectrometers generally consists of a wavelength-selective system and a photodetection system. The most common micro-spectrometers are those using conventional strategy, where different spectral components are spatially separated by miniaturized dispersive optics9-14. Moreover, narrowband filters, which can selectively transmit light with specific wavelengths, were also used in spectral analysis either with a single filter or an array of multiple unique narrowband filters15-19. The readout of the detectors directly constitutes the spectrum in these micro-spectrometers. However, the spectral resolution decreases significantly with the miniaturization of the spectrometer size, limiting the footprint of the micro-spectrometers relying on one-to-one spectral-to-spatial mapping.
A new form of micro-spectrometer known as “computational” spectrometers has emerged in the past decade, which offers significant advantages over the existing micro-spectrometers in terms of size reduction, high resolution, broad spectral range, low cost, and fast data acquisition20-25. Spectrum analysis in this system relies on a sequence of mathematical computations between signature patterns and transfer function, where the resolving power is determined by the dissimilarity between signature patterns created by two distinct wavelengths rather than the Rayleigh criterion5, 24. Thus, the more diverse the signature patterns between the shortest and longest wavelengths are, the higher resolving power can be obtained.
The existing computational spectrum reconstruction was mainly based on complex spectral-to-spatial mapping, which distinguishes the wavelengths by creating a lateral signature pattern in the spatial domain for each wavelength5. Typically, they contain a set of detectors that receive distinctive spectrum-encoded signature patterns. The target spectrum to be reconstructed is essentially the assembly of scaling weights corresponding to the signature patterns obtained using these detectors20. However, multiple-channel (either one- or two-dimensional) detectors are required to record the encoded lateral two-dimensional (2D) patterns, which hinders the further decreasing of footprint. Moreover, the existing micro-spectrometers using off-axis focusing strategies will inevitably suffer from various aberrations such as coma and astigmatism, which require additional components to compensate the distortion26, 27.
Here, we propose and experimentally demonstrate a computational micro-spectrometer based on an ultrathin graphene oxide (GO) planar-lens with a lens thickness of 250 nm and a lens radius of 100 μm. Strong axially chromatic dispersion produced by the detour-phased design gives a large dissimilarity in on-axis focal fields between the two ends of the incident spectrum, establishing a spectral-to-spatial relationship with high diversity, largely improving the resolving power over those using the similar configuration but the resoling power determined by the Rayleigh criterion. Axially dispersed focal points are recorded by a single-channel photon detector mounted on a linear scanning stage, and the incident spectrum is reconstructed using spectral-to-spatial mapping method. The detour phase design enables broadband high-quality aberration-free focusing across entire visible range, which is also advantageous for maintaining high accuracy throughout the entire measurement range. Consequently, broadband spectrum measurement covering the visible range (420 - 750 nm) was achieved in experiment over a linear scanning range of around 200 μm, resulting in a sub-millimeter optical compartment of our spectrometer. Furthermore, the ultracompact spectrometer is compatible with MEMS (Micro-electromechanical Systems) or piezo devices, and single-pixel detectors can also be used to further reduce the size, which will significantly accelerate its application in portable, handheld, and wearable devices. To the best of our knowledge, this is the first report that combines detour-phased planar lens, GO material, single-channel detector together in computational spectroscopy
-
The design of GO lenses in this study originates from detour phase holography28-30, which is a convenient way of controlling light within a single ultrathin interface (Details of the lens design is discussed in Supplementary Materials Note 1). The detour phased planar lens possesses significant axial dispersion properties, thus if the incident wavelength of λ is different from the designed one (λd), shift of the focal length at this wavelength will be:
$$ f = \frac{{{\lambda _d}{f_d}}}{\lambda } $$ (1) When an incident light with a broadband spectrum passing through the lens, the wavelength differences in the spectrum is converted into intensity variations along the optical axis with an inversely proportional dependence on the incident wavelength. Consequently, the intensity distribution along the optical axis is a result of superposition of various wavelength components’ contributions. The strong chromatic dispersion along the axial direction is a prerequisite for spectrum reconstruction using computational methods.
The principle of the spectrum reconstruction is conceptionally illustrated in Fig. 1. When an incident light source with an unknown broadband spectrum (Fig. 1a) passes through the GO lens (Fig. 1b), the axial intensity distributions of the focal fields are dispersed inversely proportional to the incident wavelengths as depicted in Fig. 1c. Subsequently, the incident spectrum and its intensity distribution along the optical axis can be digitally discretized as S(λ) and I(z) with dimensions of m × 1 and n × 1, respectively. The intensity at an arbitrary distance along the optical axis is the summation of the focal fields from various wavelength components:
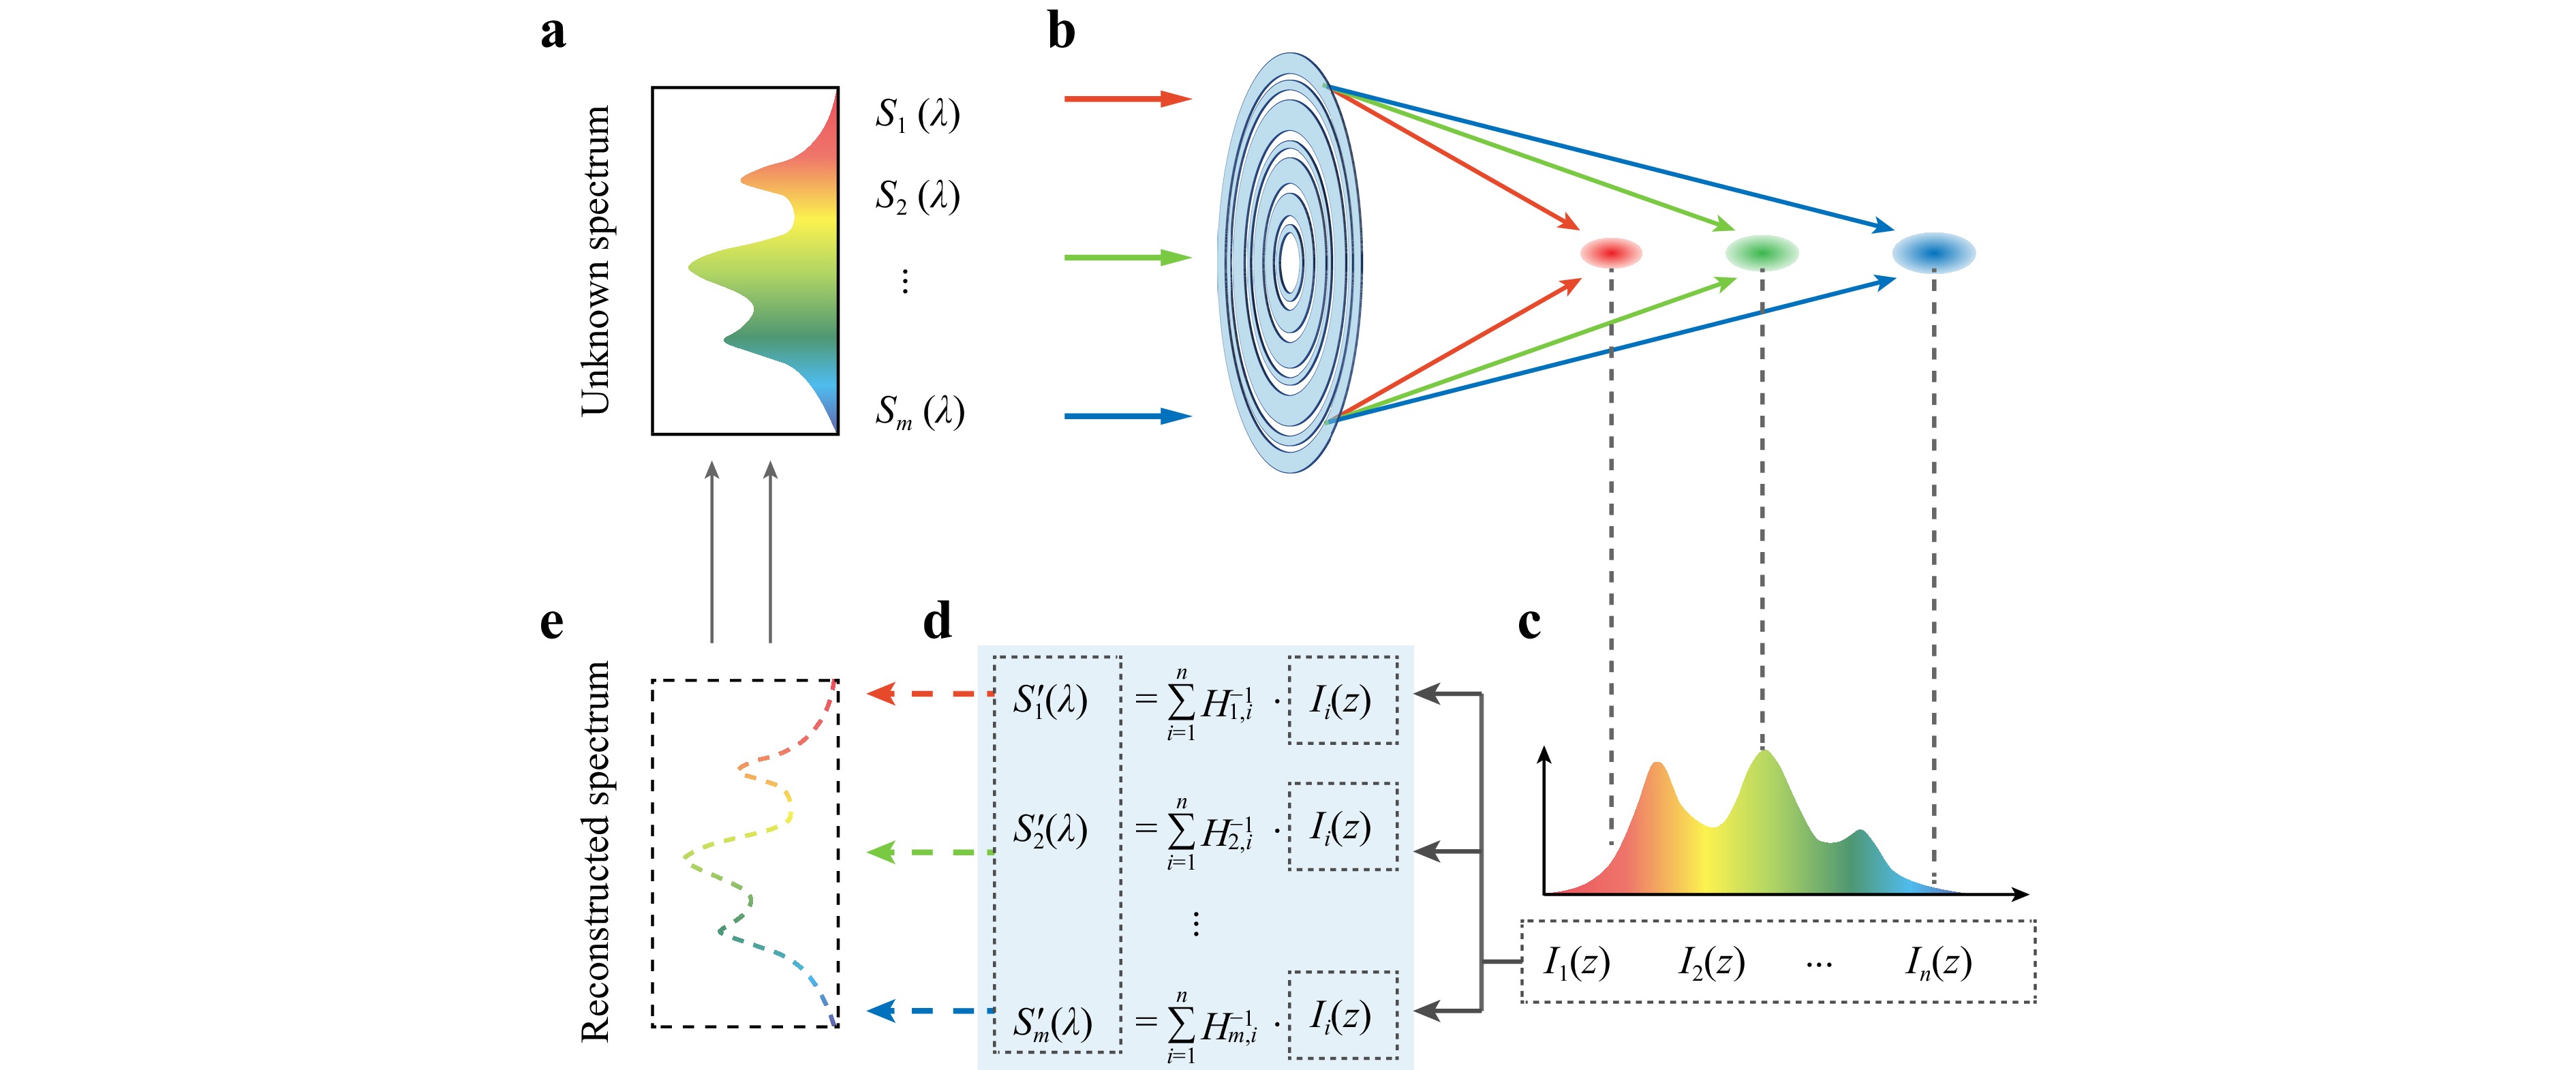
Fig. 1 The principle of the detour-phased lens-based computational micro-spectrometer. a An unknown incident spectrum that was digitally discretized into m components. b Spectral-to-spatial mapping relations of the detour-phased lens through strong axial chromatic dispersion. c Intensity distribution behind the lens was digitally discretized into n components. d Spectrum reconstruction based on the mapping matrix. e The reconstructed spectrum.
$$ {{\bf I}_j}\left( {\text z} \right) = \sum\limits_{i = 1}^m {{{\bf H}_{j,i}} \cdot {{\bf S}_i}\left( \lambda \right)} $$ (2) where H is the mapping matrix that represents the spectral-to-spatial relationship, and Hj,i represents the calibration coefficient of the ith wavelength component for the jth axial intensity component, as illustrated in Fig. 1d. The reconstruction of the incident spectrum S’(λ) is depicted in Fig. 1c–1e and is calculated by:
$$ {{\rm S}'}\left( \lambda \right) = {{\bf H}^{ - 1}}{\bf I}\left( {\text z} \right) $$ (3) where H−1 is the inverse matrix of H. For a square matrix, H−1 can be directly obtained as long as H is a full rank. Alternatively, if m is not equal to n, H−1 can be obtained by computing the generalized inverse matrix. The calibration coefficient Hj,i is the ratio of the intensity obtained by the detector to the intensity of the incident light with a wavelength of λi, which is invariant for a specific system and can be calibrated in advance using a known spectrum.
There are many advantages combing computational method with detour-phased GO lens. Firstly, all the wavelength-dependent parameters, including transmittance and absorption of GO, diffraction efficiency of the lens, and spectral response of the photodetector, that change the original shape of the incident spectrum during measurement are incorporated into the mapping matrix of H. The axial intensity in the focal region of the lens is the only dataset required in the spectrum reconstruction, which significantly simplifies the spectrum measurement system. Secondly, if the focal fields of two wavelengths are identical, determining which wavelength leads to the intensity pattern is impossible. In other words, two wavelengths are possible to be distinguished provided that differences are present in their focal fields. In this way, dissimilarity between the signature patterns determines the resolving power of the reconstructive spectrometers. As a result, the great dissimilarity of signature patterns resulting from large axial chromatic dispersion allows for high resolving power in spectrum reconstruction. Finally, off-axis aberrations including coma, astigmatism, and lateral chromatic aberration are eliminated along the optical axis, ensuring high-performance focusing at various distances.
-
A detour-phased GO planar lens with a working wavelength of 550 nm, a focal length (f) of 300 μm, and a lens radius (R) of 100 μm was designed. The resulting numerical aperture (NA) is 0.32 according to NA = R∕f. The intensity distribution along the optical axis in the focal region of the planar lens was calculated using the Fresnel scalar diffraction theory (Supplementary Material Note 2)31.
Prior to the reconstruction of the incident spectrum, the micro-spectrometer's mapping matrix H must be calibrated first. The calibration coefficients at the ith column of H were calculated by the ratios of axial intensity distribution I(z) to the intensity Ii(λ) of a single wavelength incident (calibration beam). Fig. 2a shows the axial intensity distributions of various single-wavelength calibration beams incident with a 10 nm interval from 420 nm to 750 nm, and the values along the axial direction representing the distance from the lens plane. As previously stated, the calibration coefficient is invariant for a given system, so the peak intensity of each calibration beam can be set flexibly in the simulation, which was set to 1 for convenience. The focal length variances resulted from the axial chromatic dispersion of the detour-phased planar lens was shown in Fig. 2b. The solid blue is the theoretical prediction according to Eq. 1, and the red squares are calculated based on the Fresnel scalar diffraction theory. The inversely proportional relationship between the focal length and the wavelength perfectly coincides both in theory and simulation. Well-defined 2D focus fields along the axial direction indicate an efficient phase modulation using the detour phase method. Fig. 2c depicts a 2D plot of values of the mapping matrix produced from simulation, which exhibits a similar tendency to that depicted in Fig. 2b because the energy is concentrated around the various focuses.
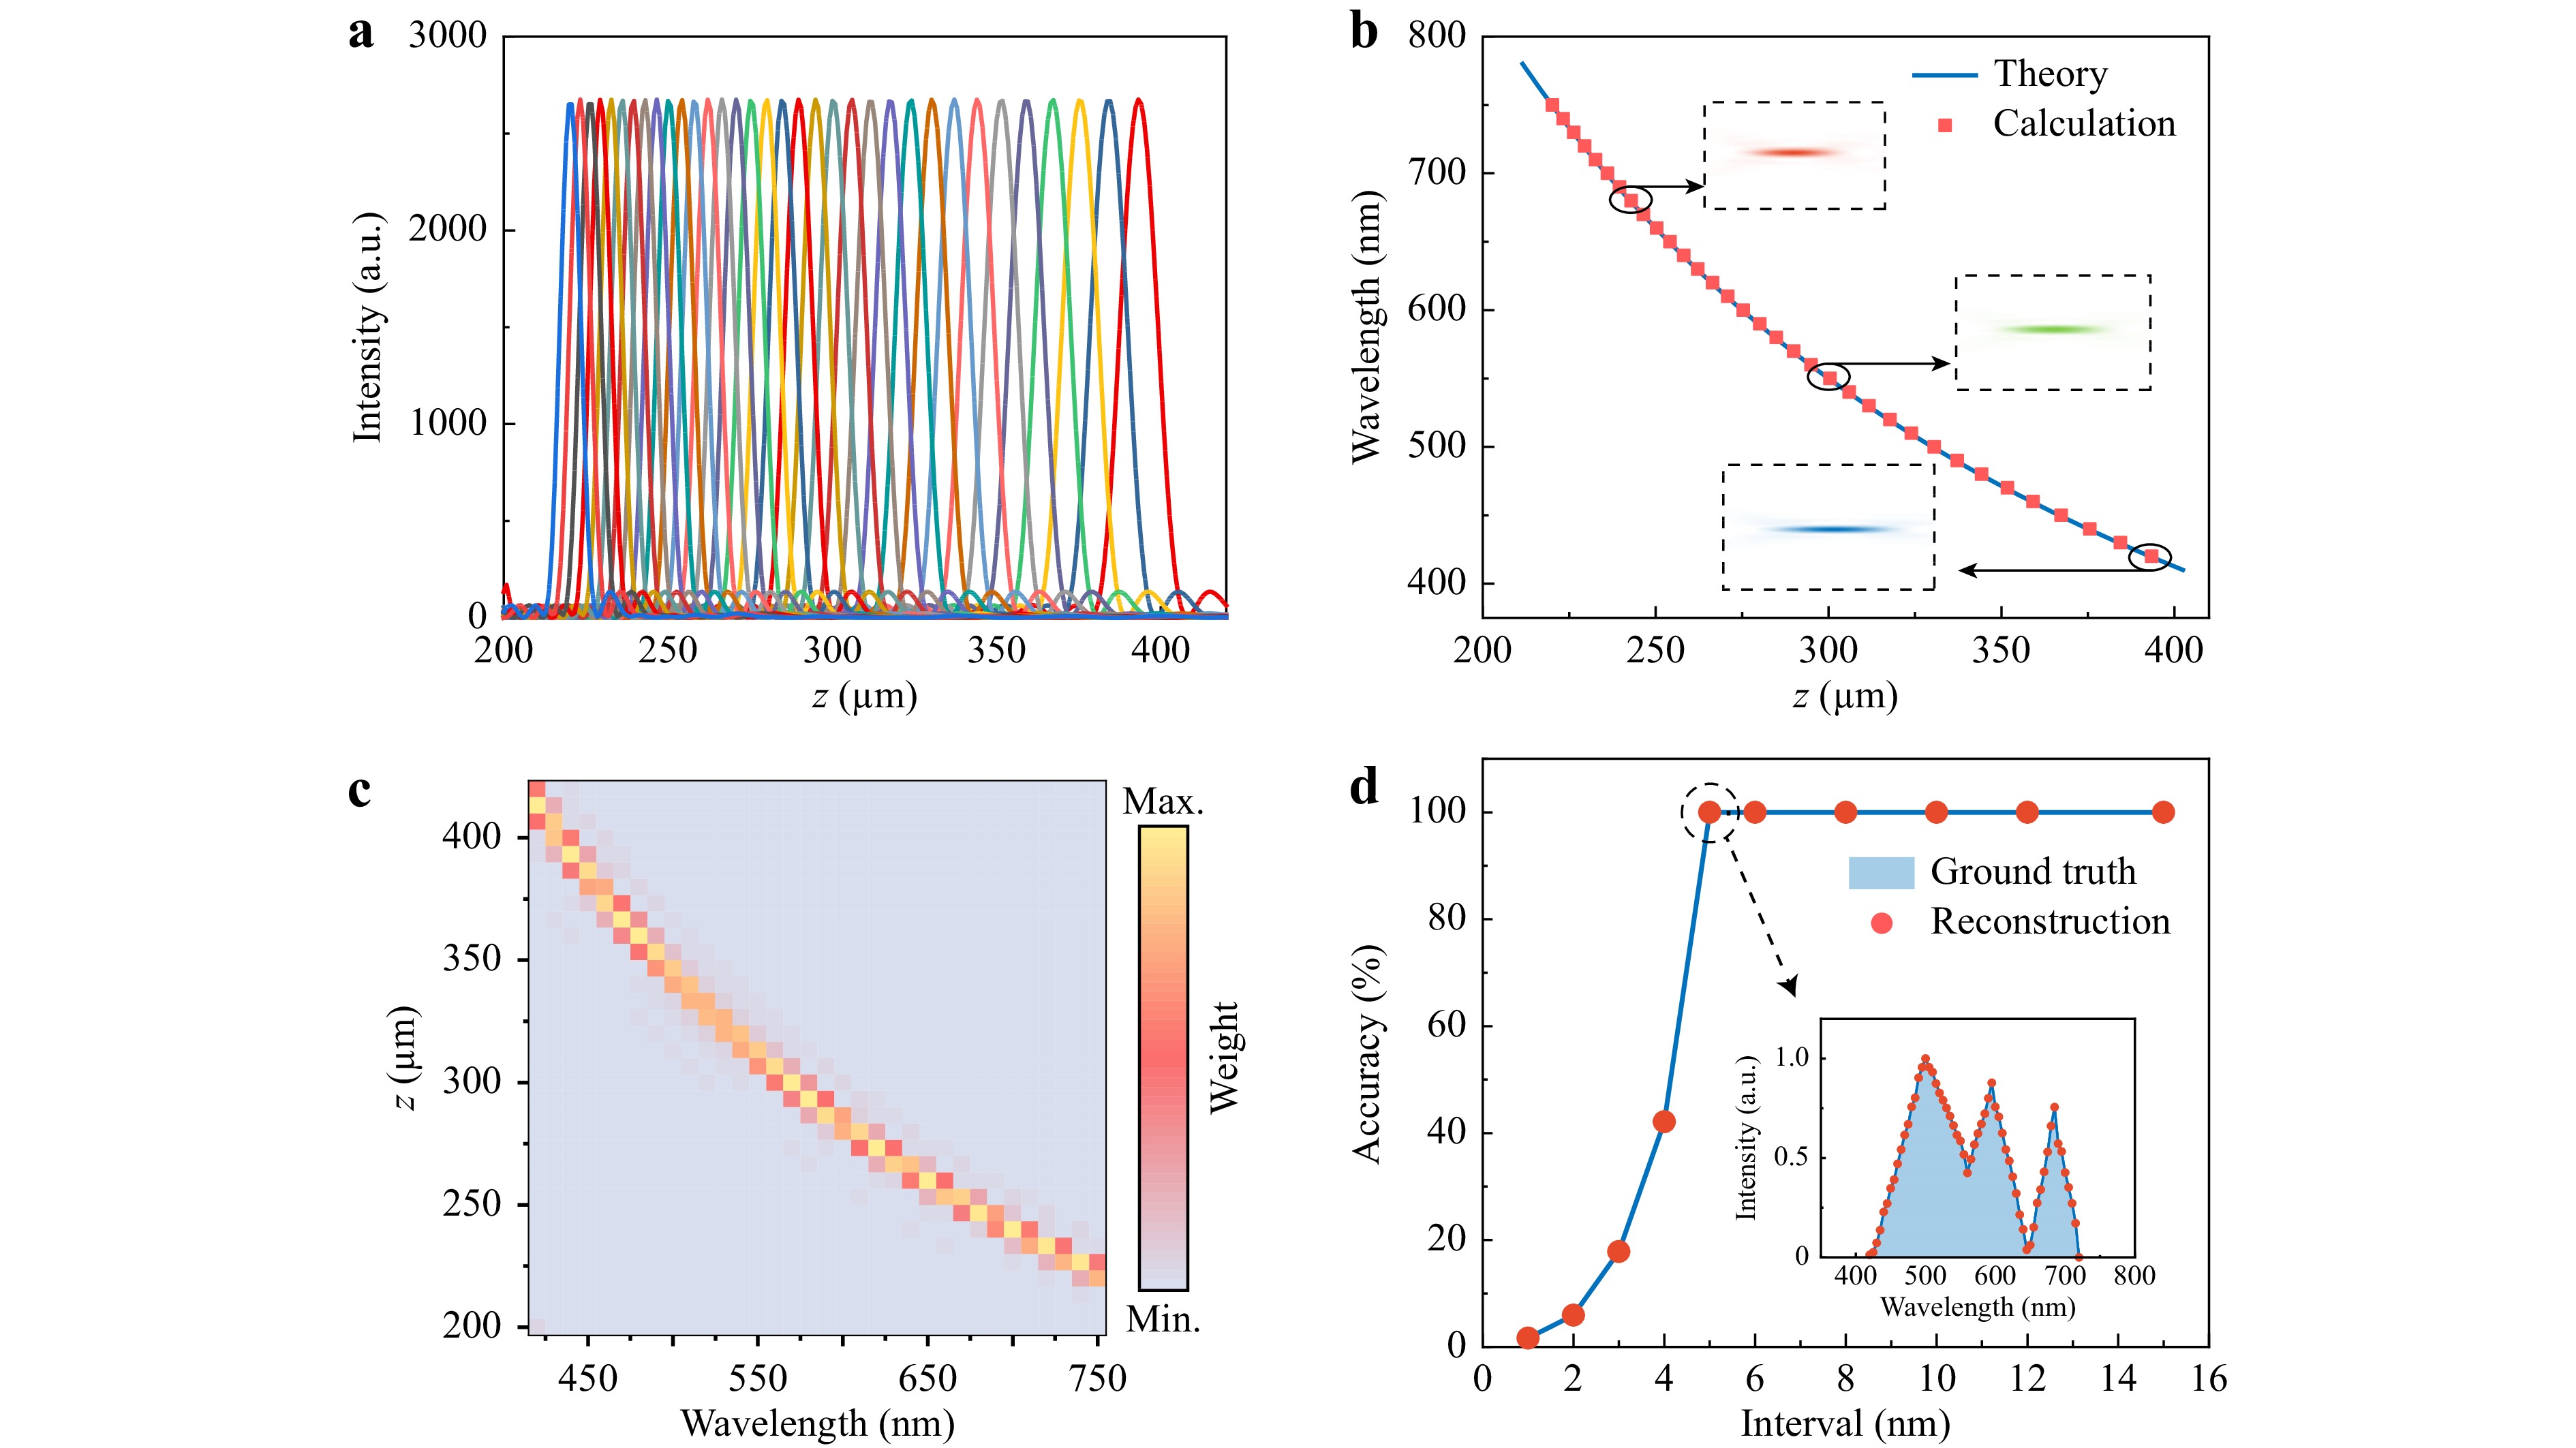
Fig. 2 Spectrum reconstruction simulations. a Axial intensity distributions of the calibration beam with various wavelengths. b Focal length variations with different wavelengths due to axial chromatic dispersion of the detour-phased planar lens. Solid blue line: theory; red squares: simulation; insert: longitudinal focusing intensity distributions at the wavelengths of 420, 555, and 680 nm. c Surface plot of the mapping matrix. d Spectrum reconstruction accuracy with wavelength intervals from 1 nm to 15 nm. Inset: spectrum reconstruction with a wavelength interval of 5 nm, where solid blue region and red dotted line are the original and reconstructed spectrum, respectively.
An incident beam with a broadband random spectrum (420−750 nm) was used to demonstrate the validity of the spectrum reconstruction method as demonstrated in Fig. 2d. The corresponding axial intensity distribution behind the detour-phased lens was calculated using Fresnel diffraction theory (The intensity pattern is shown in Supplementary Material Fig. S2). Theoretically, when using the computational method, two focal points are supposed to be distinguished as long as the two focal points are not completely overlapped (it is impossible to determine which wavelength leads to the observed pattern if the signature patterns of two distinct wavelengths are identical), which makes it possible to break the diffraction limitations. However, the greater the similarity between the intensity distributions from adjacent wavelengths, the larger the condition number of H, leading to a poorer numerical solution of Eq. 324. As a result, the minimum wavelength interval in spectrum reconstruction is not unlimited. Here, spectrum reconstruction accuracy (ratio of the accurately retrieved points) at various wavelength intervals are investigated, and the results are shown in Fig. 2d. When the wavelength interval is larger than 5 nm, the incident spectrum can be completely reconstructed (spectrum reconstruction at an interval of 10 nm is present in Supplementary Fig. S3). However, when the wavelength interval becomes 4 nm, the reconstruction accuracy decreases to about 42%, and decrease continuously as the wavelength interval reducing. As a result, the spacing of the discretization wavelength should be selected carefully to maximize the potential of the system. Nevertheless, an incident spectrum can be accurately retrieved at a wavelength interval of 5 nm. Without using the computational method, the resolvable wavelength is limited by the Rayleigh criterion, which in this regime is 24.75 nm (The resolving power compared with the traditional method is discussed in Supplementary Materials Note 3). The result achieved by computational method is a 5-time improvement over the traditional approach without using the computational methods.
-
GO was chosen considering the following two main facts. Firstly, both refractive index and extinction coefficient are almost maintained from visible to infrared regions, which provides GO lens a possible mechanism for achieving broadband focusing32. Secondly, GO possess high thermal conductivity and is easy to be ablated by laser with low pulse energy33. The detour-phased lenses were fabricated using the direct femtosecond laser writing technique34, 35, and the transparent rings were produced by mask-free ablation of GO films, as illustrated in Fig. 3a. The laser source is a homemade green femtosecond laser operating at 520 nm with a repetition rate of 10 kHz and a pulse width <100 fs. Using a low repetition rate femtosecond laser instead of the more frequently used MHz laser is intended to suppress heat accumulations during writing process. An objective lens (MPLAPON50X, Olympus) with a high NA of 0.95 was used to achieve sub-micrometer linewidth. The pulse energy of the femtosecond laser measured at the entrance pupil was set to 2.5 nJ. A high-precision, two-axis translation stage (L-738, Physik Instrument) was used to move samples at a scanning speed of 20 μm/s in writing process. The fabricated lens has the same parameters as that used in the spectrum reconstruction simulation, and the theoretically calculated lens profile using the detour phase method is shown in Fig. 3b. Fig. 3c shows the fabricated lens profile characterized by a conventional optical microscope. The magnified details of the rings from a zoom-in image are provided in Fig. 3d, where the uniform linewidth can be clearly seen. The formation of the ablated rings was further confirmed by an atomic force microscopy (AFM) image and an optically smooth surface was obtained, as shown in Fig. 3e. The surface roughness was controlled within tens of nanometers, which is much smaller than the designed operational wavelength of 550 nm. As a result, light is weakly scattered and has a minimum impact on the optical properties of the lens. The linewidth of the rings is ~500 nm, and the thickness of the GO film is ~250 nm, as presented in the corresponding height profile along the white dashed line. The selection of a thickness of 250 nm is to get optimal focusing efficiency of GO lens, which provides a near π phase difference for the light beam compared to the light passing through the fabricated air grooves32, 36.
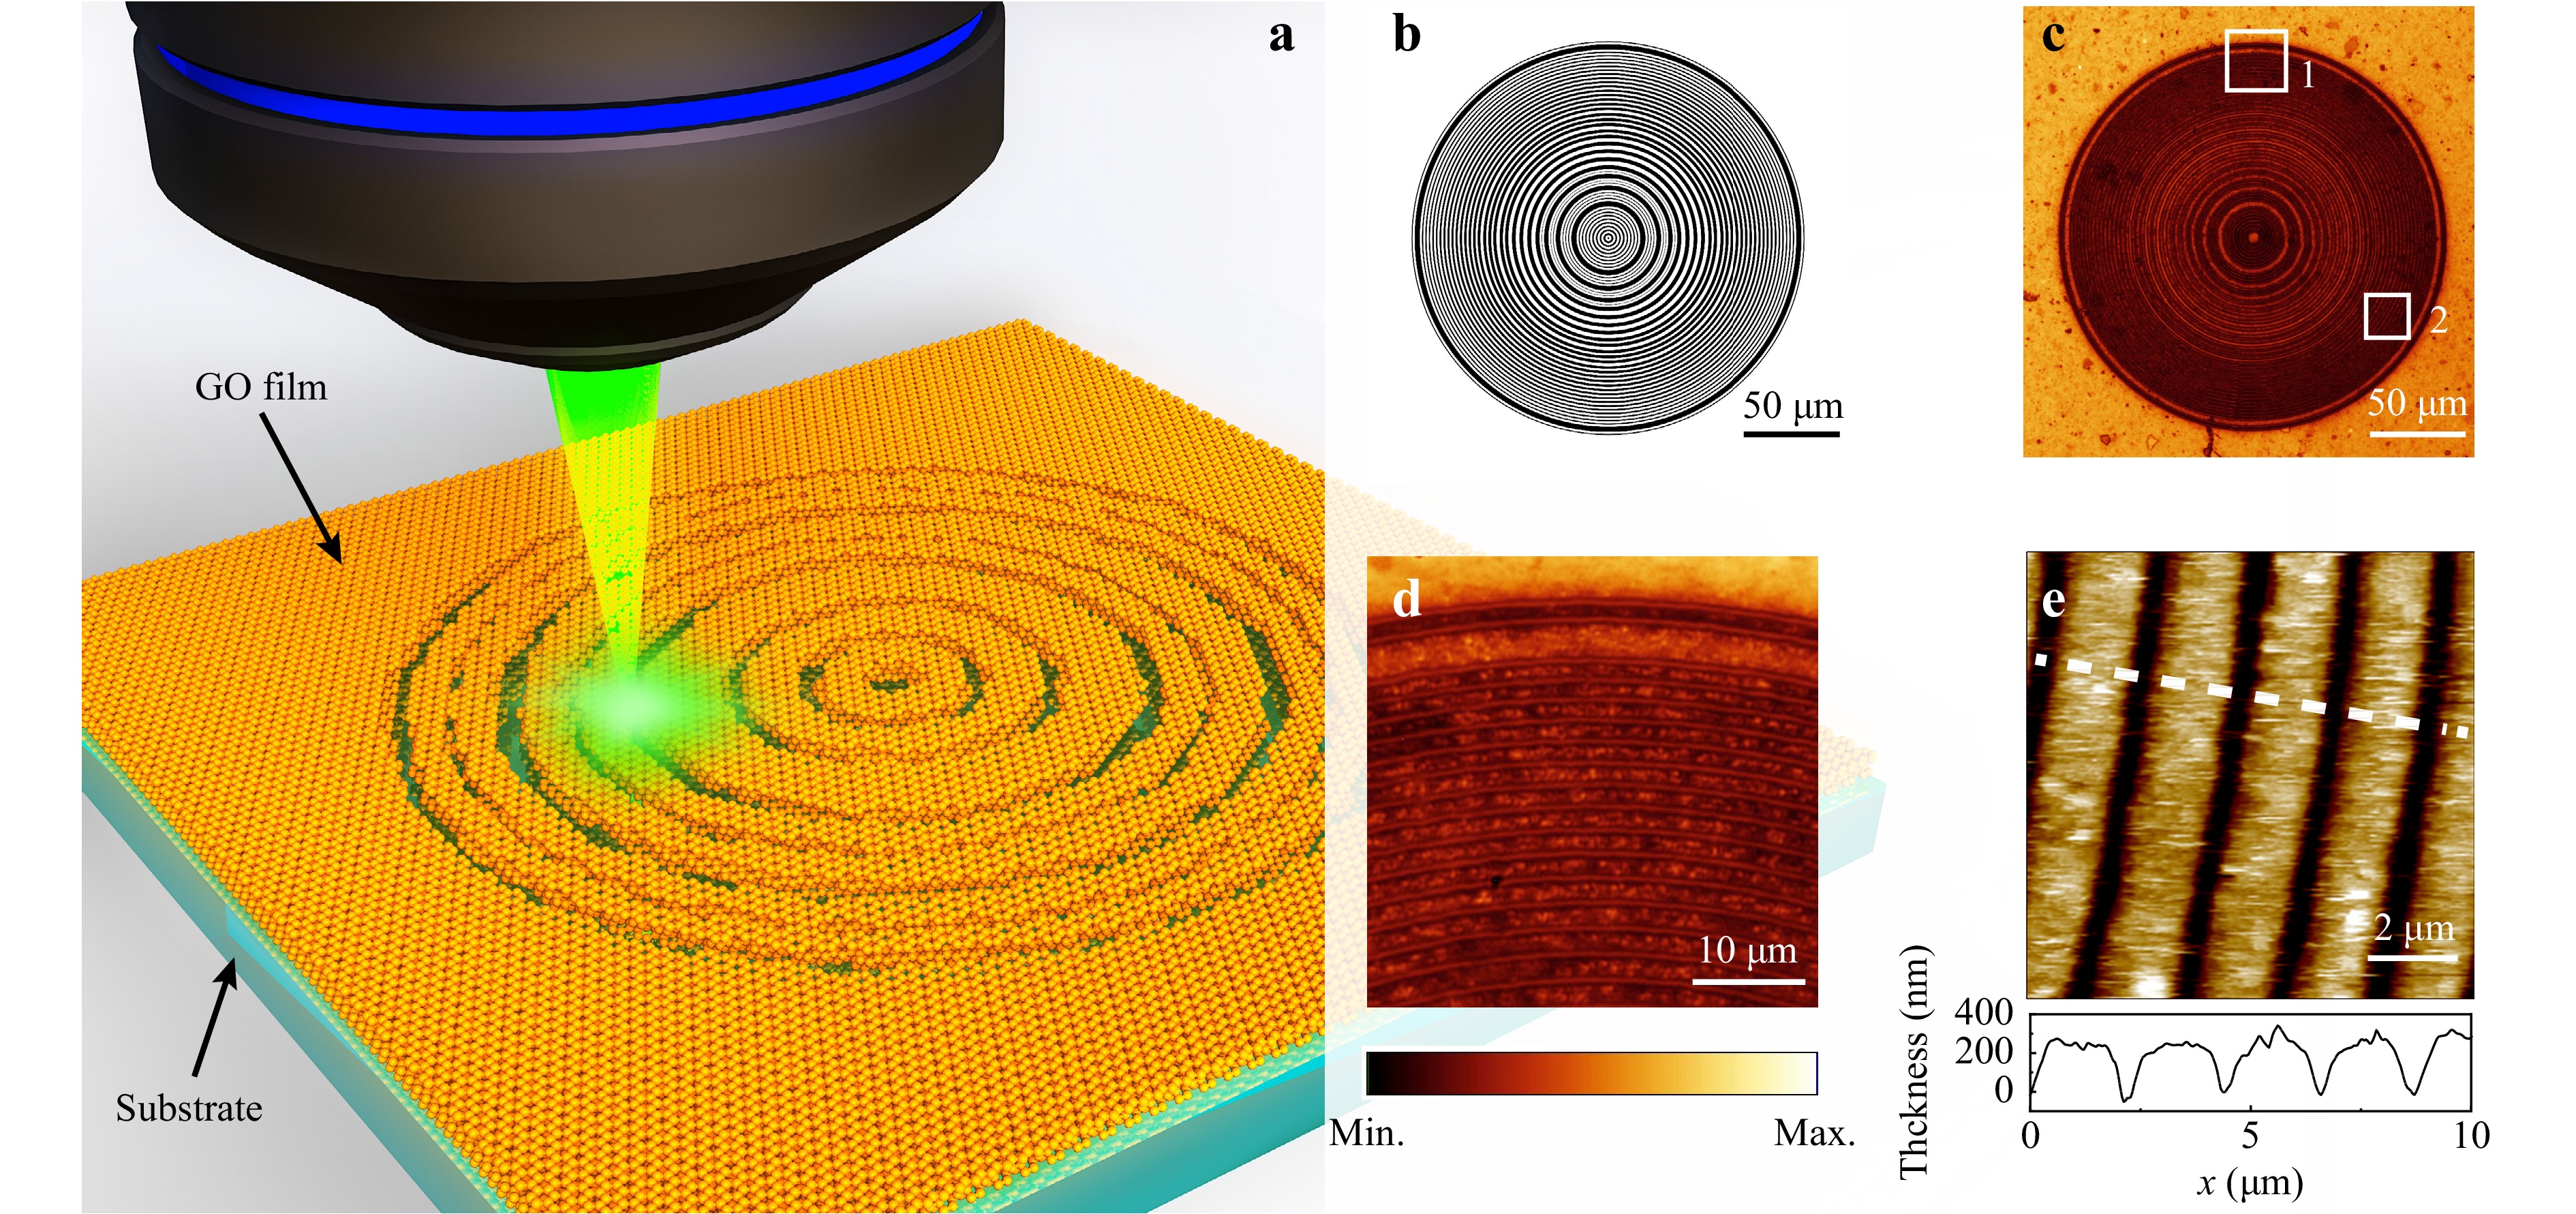
Fig. 3 Direct femtosecond laser writing of detour-phased lens. a Schematic illustration of the direct laser writing process. b Theoretically calculated lens profile with concentric rings. c Fabricated detour-phased lens imaged by an optical microscope. d Zoom-in image of region 1 in c. e AFM image of region 2 in c and the corresponding height profile along the white dashed line.
-
The principle of the micro-spectrometer in this work is based on the strong axial chromatic dispersion of diffractive detour-phased lenses. Therefore, characterizing the focal fields along the optical axis under incident light at different wavelengths is essential. The incident laser is a commercial picosecond supercontinuum light source (SC-PRO-M, YSL Photonics) that can generate a broadband spectrum covering 410−2400 nm. A motorized variable filter allows for tunable wavelength selection from 400 to 840 nm with a bandwidth from 6 to 300 nm. The filtered spectrum was coupled into a single-mode fiber (S405-XP, Nufern) and collimated using a plan achromat objective lens (PLN 4×/0.1, Olympus). As a result, the transmitted light after collimation can be continuously tuned from 420 to 750 nm with a bandwidth of 6 nm and then directed into the characterization system. The experimental setup for characterizing the axial intensity distributions is schematically illustrated in Fig. 4a. An objective (MPLAPON50×, NA = 0.95, Olympus) was mounted on a linear translation stage (composed of an LTA-HS high-speed motorized actuator and an M423 linear translation stage from Newport) to scan along the optical axis with a step of 1 μm. Subsequently, the axial intensity distribution was recorded using a CMOS camera (MC050MG-SY, XIMEA), which acts as a single-pixel detector in the spectrum reconstruction process. Experimentally measured longitudinal focus fields of the input with wavelengths of 450 nm, 555 nm, and 660 nm are shown in Fig. 4b−d, and the corresponding lateral intensity distributions at the focal plane are also provided in the insets. The focal fields are well-shaped and display high signal-to-noise ratios in both longitudinal and lateral directions. For comparison, the corresponding axial intensity distributions along the optical axis of the experimental measurements and theoretical calculations are also presented in Fig. 4e. The experimental results agree with the calculations, except for a minor deviation (~2%, originated from imperfect fabrication of the lens, such as surface roughness of the GO film, residues left on the lens surface, and resolution of the mechanical stage, etc.) that does not affect the spectrum reconstruction results (see section 3.3) because the single wavelength response will be calibrated prior to reconstruction. For a spatially incoherent light source, it can cause the focal point distorted from the ideal profile and focusing efficiency will also decrease as the light at the detector comes from random directions from the sample, eventually resulting in the reduction in resolution.
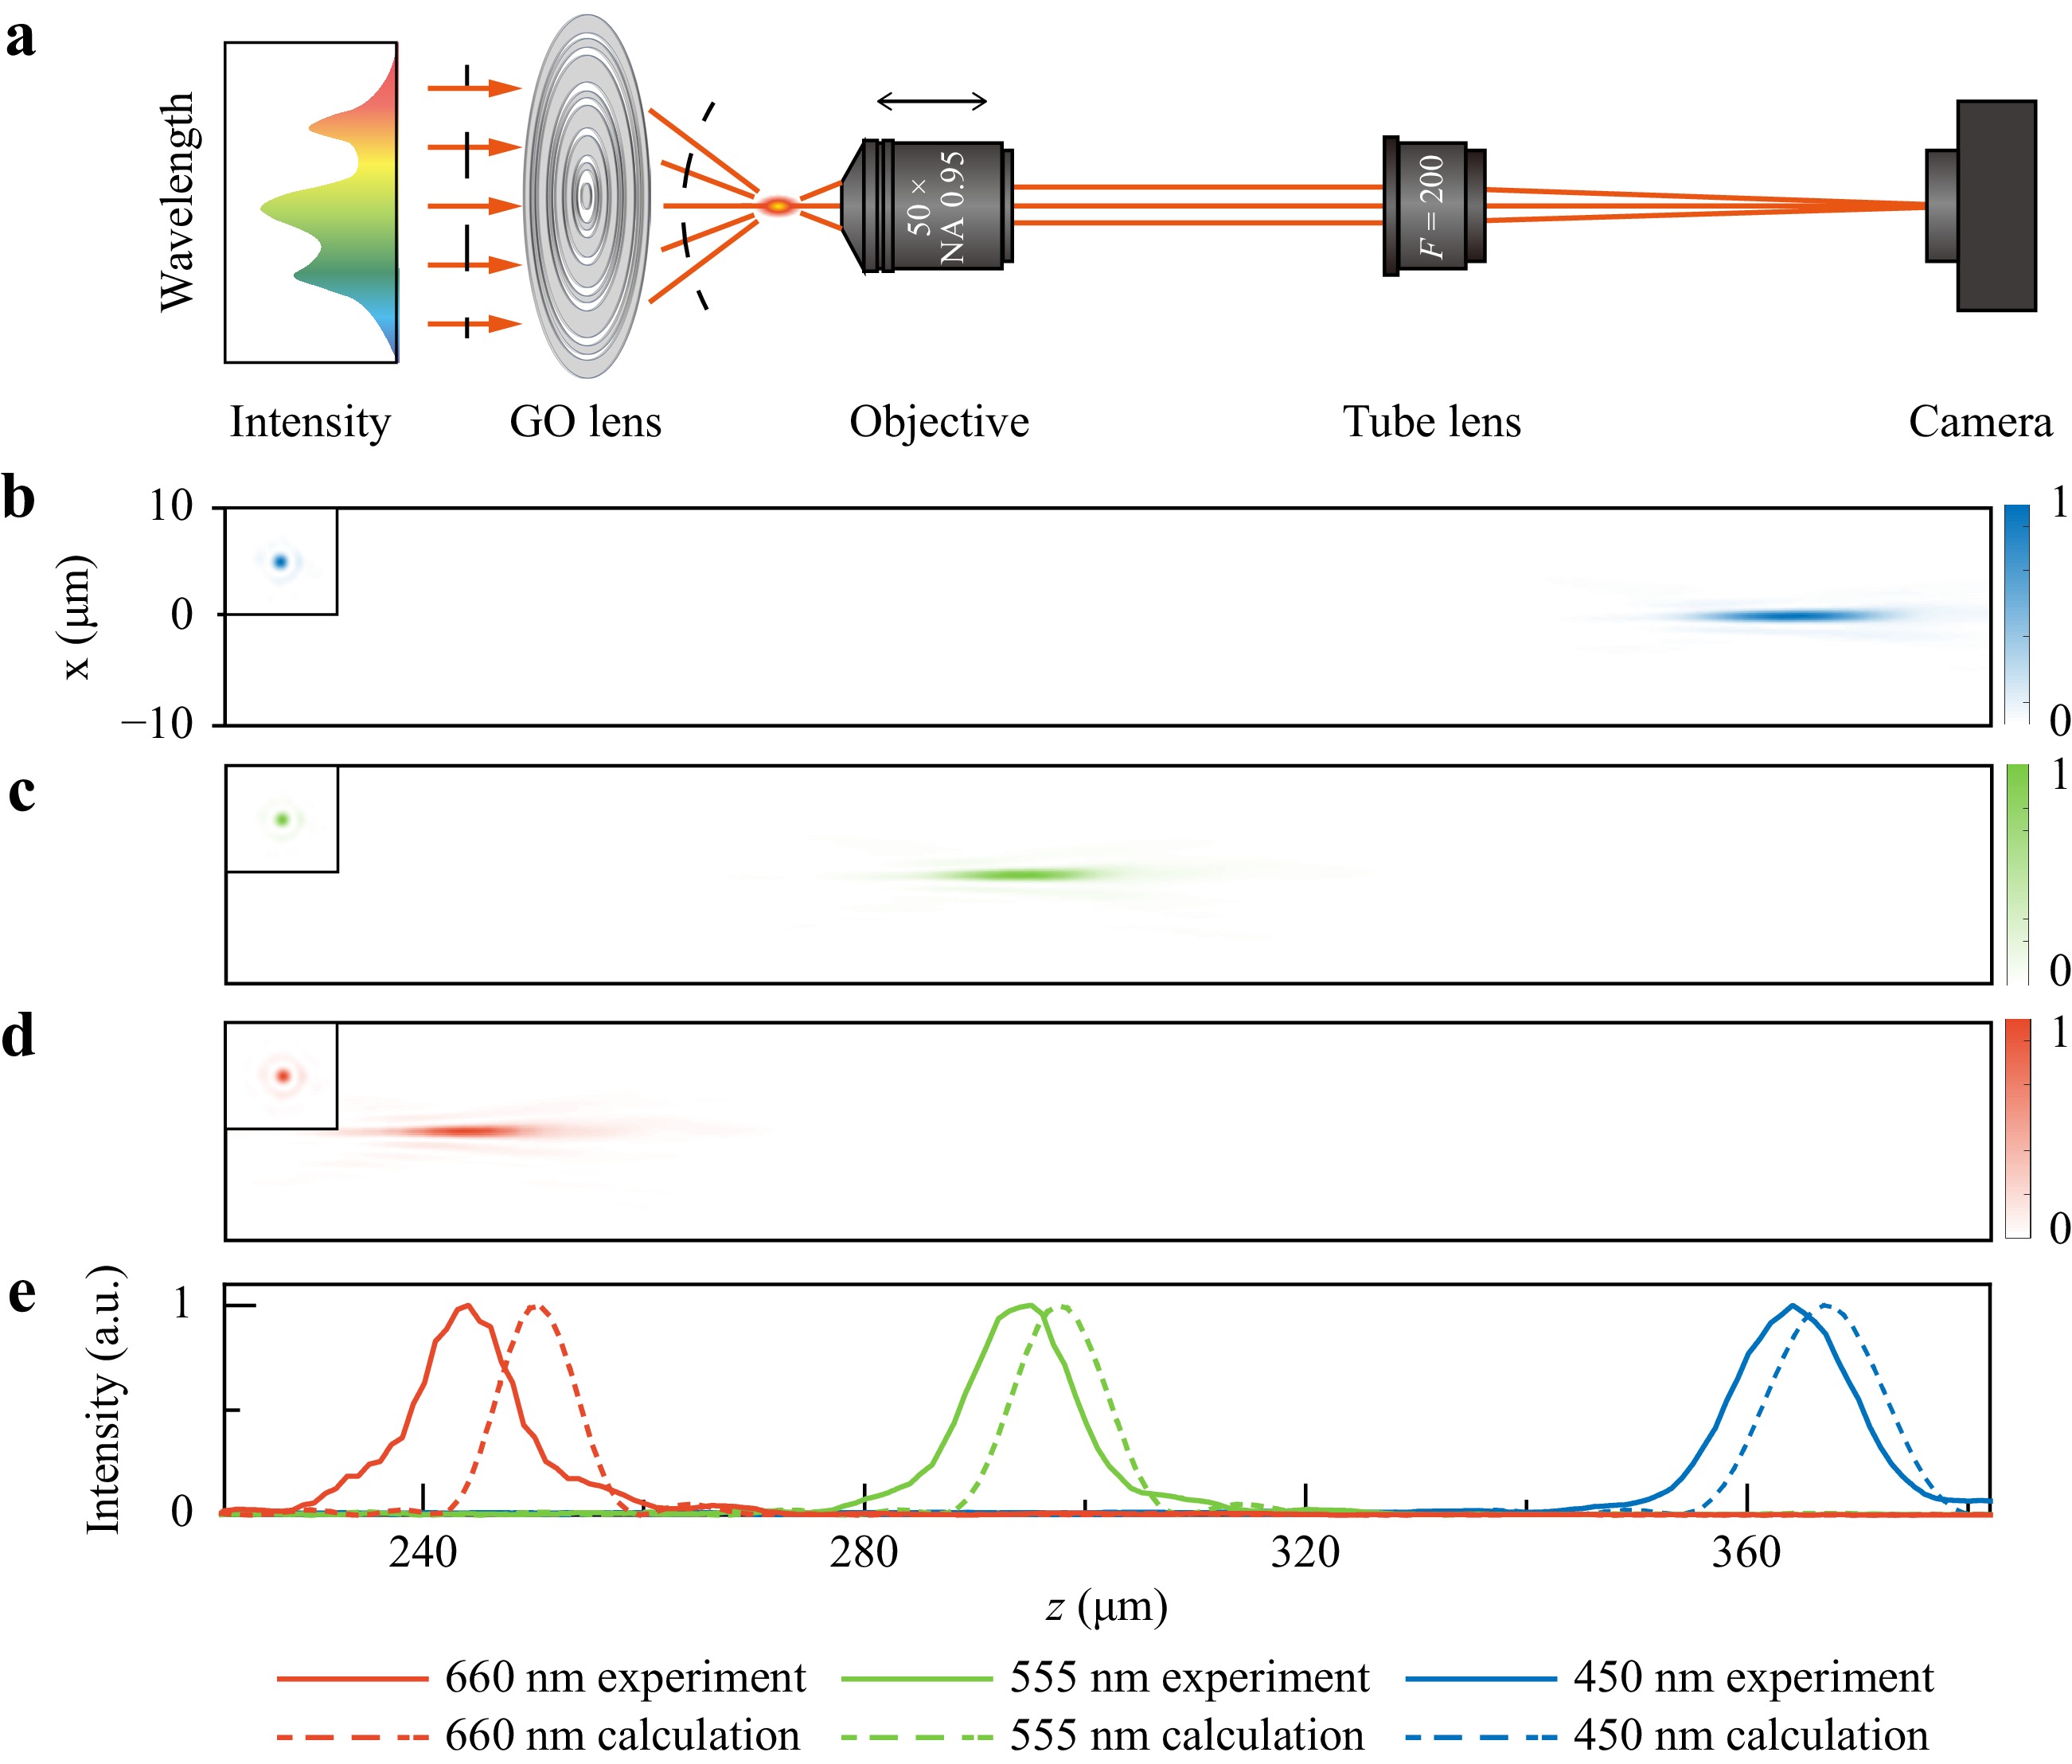
Fig. 4 Focal field distributions of the detour-phased lens for incident light at different wavelengths. a Experimental setup for characterizing the axial intensity distributions. b−d Experimentally measured longitudinal intensity distributions at 450 nm, 555 nm, and 660 nm incidence. Insets: experimentally measured lateral intensity distributions at the focal plane. e Axial intensity distribution along the optical axis. Solid line: experimental results; dotted line: calculation.
-
Before the spectrum reconstruction, single-wavelength responses of various spectrum components, i.e., mapping matrix H, were measured. A series of tunable calibration light was selected using the motorized variable filter from the supercontinuum with an interval of 15 nm and a bandwidth of 6 nm. As a result, the dimension of I(λ) is 23 × 1 with respect to the spectrum coverage of 420−750 nm. The input power of each calibration light was tuned separately to take advantage of the dynamic range of the camera, which does not affect the reconstruction because H is constant for a specific system regardless of the input power variance. The calibration coefficient of each spectrum component, i.e., each row of H, was then obtained by sequentially directing the calibration light into the characterization system (Supplementary Material Fig. S4). The corresponding axial intensity distributions for each calibration light are shown in Fig. 5a, where the values along the axial direction represent the distance from the lens plane. Fig. 5b shows focal length variances due to the axial chromatic dispersion of the detour-phased planar lens, where the solid blue line is from theory prediction according to Eq. 1 while the red squares are experimentally measured results. The experimental results were in good agreement with the theoretical calculations.

Fig. 5 Spectrum reconstruction results using the detour-phased computational micro-spectrometer. a Intensity distributions of the calibration beam with various wavelengths along the optical axis. b Focal point variation with different wavelengths due to strong axial chromatic dispersion of the detour-phased planar lens. Solid blue line: theory; red squares: experiment; c Intensity distributions of the supercontinuum after the detour-phased lens. Upper: 2D focal field intensity distributions; lower: axial intensity distribution along the optical axis. d Spectrum of the supercontinuum obtained using a commercial spectrometer and a detour-phased micro-spectrometer, respectively. e Intensity distribution of the supercontinuum filtered by two-notch filters. Upper: 2D focal field intensity distributions; lower: axial intensity distribution along the optical axis. f Spectrum obtained using a commercial spectrometer and the GO micro-spectrometer, respectively. All error bars were created by the standard deviations of datapoints under multiple measurements.
The spectra obtained respectively from a commercial spectrometer (OCEAN-HDX-VIS-NIR,Ocean Insight) and our computational spectrometer were presented together to valid our method. Firstly, the spectrum of the supercontinuum source was chosen for illustration. The corresponding 2D axial focal field after the detour-phased lens is presented in Fig. 5c, and the intensity distribution along the optical axis is also shown. The focal fields of the broadband spectrum with different wavelength components are superimposed in the longitudinal direction. The measured input spectrum matches the reconstruction result, as shown in Fig. 5d, where the solid blue line is measured by the commercial spectrometer, and the reconstructed spectrum is illustrated by the dotted red line. We then inserted two notch filters (ZT594/680rpc and ZET532NF, Chroma Technology Corp.) in front of the detour-phased lens to create a different spectrum. The spectrum measured by the commercial spectrometer and the reconstructed spectrum are shown in Fig. 5f, and the corresponding focal field is depicted in Fig. 5e. The slight intensity discrepancy between the measured and the reconstructed results may be caused by the comparably wide bandwidth (6 nm) of the calibration light filtered from the supercontinuum light source. Light intensity at some reconstruction points could not reach zero is due to the large calibrating wavelength interval of 15 nm. This can be improved by using a smaller calibrating interval.
The minimum achievable wavelength interval was mainly limited by the motorized variable filter as it can only attain a minimum bandwidth of 6 nm and is time-consuming to tune to the desired wavelengths due to its poor tunability, especially for larger quantities of spectrum components. By utilizing a piece of more robust and precise filter equipment, the resolvable wavelength can be further enhanced. Although the demonstrated wavelength interval in this work is 15 nm, it nevertheless suppresses the limit of 24.75 nm set by diffraction (as discussed in Supplementary materials note 3).
The micro-spectrometer using detour-phased GO lens can be designed to implement in relatively large bandwidth as the GO material possesses nearly uniform optical properties across a relatively wide band from 400 nm to 1700 nm where both refractive index and extinction coefficient are almost maintained32. Spectrum reconstruction accuracy shows similar tendency from 900 to 1500 nm as it is in Fig. 2d except for the minimum wavelength interval that can be distinguished moving to 18 nm (Supplementary Material Note 4).
-
In this work, we proposed and demonstrated a detour-phased planar lens-based computational micro-spectrometer. On-axis aberration-free chromatic intensity distributions from the detour phase design enables broadband high-quality focusing across entire visible range with a lens thickness of 250 nm and a lens radius of 100 μm. Spectrum reconstruction were demonstrated experimentally and theoretically and the results were compared with a commercial product. A 5-time improvement compared with the traditional approach without using computational methods was also proved. Two different spectra reconstructions at a wavelength interval of 15 nm were demonstrated, and both show good agreement with the results measured by a commercial spectrometer. Because all the intensity-related wavelength-dependent factors, such as the transmittance, absorption, diffraction efficiency, and response of the detector can be incorporated into the mapping matrix H, the reconstruction of the input spectrum only requires measuring the intensity distribution along the optical axis, which greatly simplified the spectrum measurement process. Furthermore, the scanning step in real-world applications can be accomplished using mature MEMS or piezo devices (Supplementary material Fig. S5). A single-pixel detector can replace the one-channel detector. The micro-spectrometer can be integrated into a footprint of about 200 μm by 200 μm by 1 mm, which will significantly accelerate its application in portable, handheld, and wearable devices.
-
This work was funded by National Key Research and Development Program of China (2022YFF0712500, 2022YFC3401100), Guangdong Major Project of Basic and Applied Basic Research No. 2020B0301030009, the National Natural Science Foundation of China (12004012, 92150301, 91750203, 12041602, 91850111, and 12004013) and the China Postdoctoral Science Foundation (2020M680230, 2020M680220). The author would like to thank the High-performance Computing Platform of Peking University. This work was also supported by Australia Research Council (Grant No. DP220100603, FT210100806, FT220100559) and Industrial Transformation Training Centres scheme (Grant No. IC180100005), and Linkage Project scheme (LP210200345).
Ultracompact computational spectroscopy with a detour-phased planar lens
-
Wenkai Yang1, 2,
 ,
, - Zijian Wang1, 2,
- Jian Xu1, 2,
- Dashan Dong1, 2,
- Guiyuan Cao4,
- Han Lin4,
- Baohua Jia4,
-
Lige Liu1, 2, *, ,
,
-
Kebin Shi1, 2, 3, *, ,
- Light: Advanced Manufacturing 5, Article number: 44 (2024)
- Received: 26 January 2024
- Revised: 06 August 2024
- Accepted: 09 August 2024 Published online: 30 September 2024
doi: https://doi.org/10.37188/lam.2024.044
Abstract: Compact micro-spectrometers have gained significant attention due to their ease of integration and real-time spectrum measurement capabilities. However, size reduction often compromises performance, particularly in resolution and measurable wavelength range. This work proposes a computational micro-spectrometer based on an ultra-thin (~250 nm) detour-phased graphene oxide planar lens with a sub-millimeter footprint, utilizing a spectral-to-spatial mapping method. The varying intensity pattern along the focal axis of the lens acts as a measurement signal, simplifying the system and enabling real-time spectrum acquisition. Combined with computational retrieval method, an input spectrum is reconstructed with a wavelength interval down to 5 nm, representing a 5-time improvement compared with the result when not using computational method. In an optical compartment of 200 μm by 200 μm by 450 μm from lens profile to the detector surface, the ultracompact spectrometer achieves broad spectrum measurement covering the visible range (420−750 nm) with a wavelength interval of 15 nm. Our compact computational micro-spectrometer paves the way for integration into portable, handheld, and wearable devices, holding promise for diverse real-time applications like in-situ health monitoring (e.g., tracking blood glucose levels), food quality assessment, and portable counterfeit detection.
Research Summary
Micro-spectrometers: Miniaturized footprint with Improved Resolution Aided by Computational Spectroscopy
Optical spectrometers are powerful instruments utilized to decompose complex optical spectra and quantify the intensity of their various wavelength components. Traditional spectrometers often tend to be cumbersome, which is contrary to the need for portable and handheld spectral analysis devices, such as lab-on-chip systems, smartphones. However, size reduction often compromises performance, particularly in resolution and measurable wavelength range. This work proposes a computational micro-spectrometer based on an ultra-thin (~250 nm) planar lens with a sub-millimeter footprint. Combined with computational retrieval method, an input spectrum is reconstructed with a wavelength interval down to 5 nm covering the visible range, representing a 5-time improvement to the traditional method with the same structure. The compact computational micro-spectrometer holds promise in diverse real-time applications like in-situ health monitoring, food quality assessment, and portable counterfeit detection.
Rights and permissions
Open Access This article is licensed under a Creative Commons Attribution 4.0 International License, which permits use, sharing, adaptation, distribution and reproduction in any medium or format, as long as you give appropriate credit to the original author(s) and the source, provide a link to the Creative Commons license, and indicate if changes were made. The images or other third party material in this article are included in the article′s Creative Commons license, unless indicated otherwise in a credit line to the material. If material is not included in the article′s Creative Commons license and your intended use is not permitted by statutory regulation or exceeds the permitted use, you will need to obtain permission directly from the copyright holder. To view a copy of this license, visit http://creativecommons.org/licenses/by/4.0/.

 DownLoad: