


-
The invention of scanning probe microscopy (SPM) techniques, including scanning tunnelling microscopy (STM) and atomic force microscopy (AFM), has led to a paradigm shift in the visualisation and understanding of surface structures and related properties at the atomic scale1-4. In most imaging cases, the SPM tip only acts as a perfect probe to characterise the intrinsic properties of the surfaces and adsorbed molecules, and the influence of the tip is usually ignored. On the other hand, the SPM tip is also known to be capable of manipulating single molecules on surfaces5-7. In this case, the tip−molecule interaction is in action, and in some cases, the approaching tip can push a molecule away. However, the detailed physico-chemical mechanism of how this happens remains elusive due to the challenge of tracking the structural variations at the single-chemical-bond level during the tip approaching process.
Here, by adopting carbon monoxide (CO) molecules adsorbed on Cu(100) as a model system, we used tip-enhanced Raman spectroscopy (TERS) to explore the tip-induced bond weakening, tilting, and hopping of a single molecule on the surface. Vibrational frequencies can provide structural and strength information about chemical bonds, and this has been elegantly demonstrated by STM-based inelastic electron tunnelling spectroscopy (IETS) at the single-molecule level8. Nevertheless, IETS is usually sensitive to vibrational modes close to the Fermi level, and the C−O stretching vibration energy approaches the detection limit9. Indeed, most gap-distance-dependent IETS studies on CO molecules have focused on the frustrated rotation (FR) and frustrated translational (FT) modes in the low-frequency region10-12. However, these low-frequency modes are associated with in-plane vibrations parallel to the surface12 and cannot directly reveal the changes in the bond length and tilting angle of the adsorbed CO molecule.
In contrast, TERS is a technique with both sensitive chemical specificity and high spatial resolution13-21, and can provide rich vibrational information over a wide range of vibrational frequencies. Recent advances in TERS not only demonstrated its powerful chemical mapping capabilities at the single-molecule level22,23, but also pushed the spatial resolution further down to the Ångstrom scale24-27, allowing probing of the bond breaking and making processes, as well as highly localised surface chemistry at the single-bond level28-30. This ability makes it possible to directly monitor the strength variations of single chemical bonds under different tip−molecule interaction conditions. In fact, previous TERS studies have indicated that the C−O stretching vibration of a CO molecule attached at the tip apex is highly sensitive to the variations of local electrostatic fields31,32.
In this study, we used a TERS-active silver (Ag) tip to directly probe the tip-induced changes in the local C−O bonding of a CO molecule adsorbed on a Cu(100) substrate. We focused more on the tip−molecule interaction associated with the acting force field from the tip, going beyond the influence of the static electric field. A continuous red-shift of the C−O stretching vibrational frequency was observed as the tip approached, revealing tip-induced weakening of the C−O bond. Further analyses based on both the Stark effect and TERS spatial imaging suggest a delicate tilting phenomenon of the adsorbed CO molecule, which may eventually lead to lateral hopping of the molecule upon further tip approaching because the rotation or tilting process is believed to assist the diffusion process of CO molecules on surfaces33. We also estimated the tilting angle of the adsorbed CO molecule and its orientation toward the hollow site along the [110] direction of the Cu(100) surface by TERS imaging. However, the hopping event is more likely to proceed via a bridge site to the nearest Cu neighbour along the [100] or [010] direction rather than through the hollow site. Our results provide deep insights into tip−molecule interactions and tip-induced molecular motions on surfaces at the single-bond level, which is beneficial for studying the mechanisms of surface reactions and catalysis.
-
TERS experiments were performed on a custom optical-STM system operating under ultrahigh vacuum (UHV) and liquid-helium cryogenic conditions. Electrochemically etched Ag tips were used for both STM and TERS measurements, which were cleaned by Ar+ ion sputtering and annealing, followed by further atomistic modification through tip indentation to a clean Ag(100) surface to achieve TERS-active status for efficient light coupling34-36. The Cu(100) substrate was prepared by cycles of Ar+ ion sputtering and annealing, and CO molecules were introduced through a variable leak valve into the UHV chamber and adsorbed onto the metal substrate maintained at 7 K. The Raman measurements were performed using the setup shown in Fig.1. A single-longitude-mode diode-pumped laser at 532 nm with a free-space output was used for light excitation. A round, continuously variable metallic neutral-density filter was used to adjust the laser output power. A half-wave plate was used to achieve the desired p-polarisation of the incident laser. A BragGrate bandpass filter (BPF) was used to remove plasma lines from the laser. After optical alignment by reflective mirrors and long-pass nano-edge filters, a collimated laser beam was introduced into the UHV chamber via a quartz viewport and refocused by an aspheric lens (fb = 12.4 mm, NA = 0.46) into the tip−substrate junction at an angle of 60° from the surface normal. The diameter of the laser spot on the sample surface was ~30 µm. The Raman scattered light was filtered by two nano-edge filters to remove residual laser light, and finally fibre-coupled to a spectrometer using a slit size of 100 μm. In addition, a beam splitter was used to monitor the focusing of the laser beam into the tunnel junction with a video camera, which was removed during the Raman measurements. Raman spectral mapping was carried out using a synchronisation function between the STM controller and the spectrometer, acquiring a spectrum at each pixel during scanning.
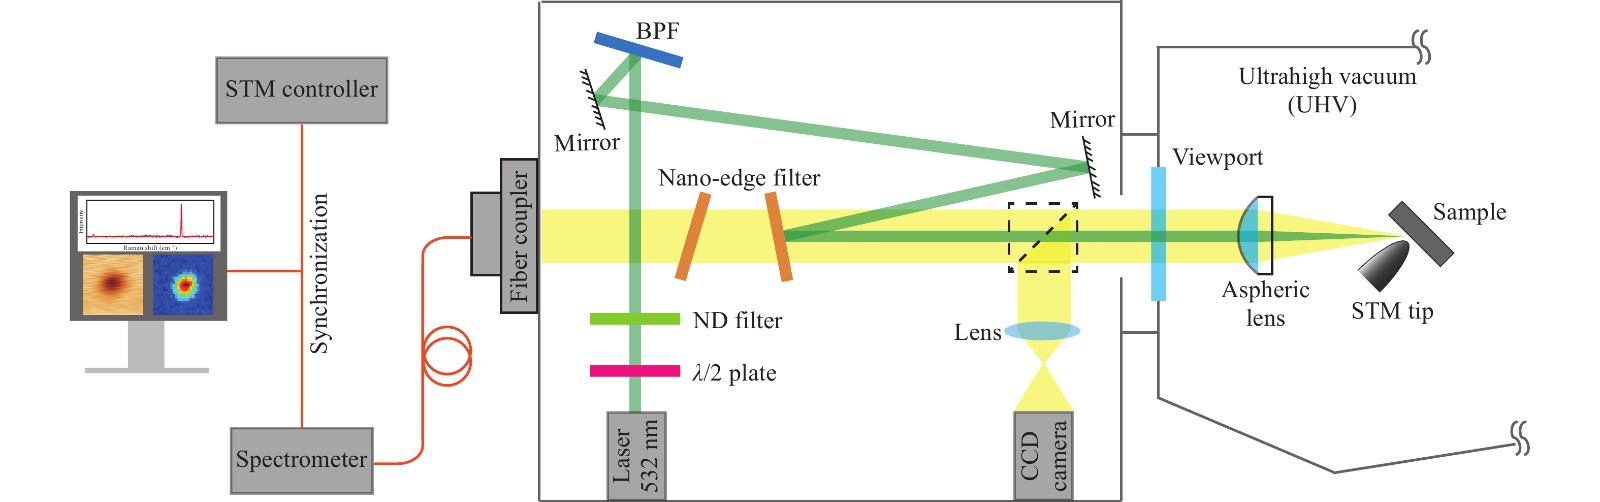
Fig. 1 Schematic drawing of the experimental setup for TERS measurements. This setup composed of four subsystems: a laser source for light excitation, a dark box for optical filtering, polarization control and alignment, a low-temperature UHV-STM with a built-in lens for sample preparation and characterization, and a spectrometer equipped with a highly sensitive CCD detector for TERS spectral measurements.
Fig. 2a shows a schematic of the TERS measurement of a single CO molecule adsorbed on the Cu(100) surface. The STM topography of the sample shown in Fig. 2b reveals dispersive adsorption of the CO molecules on Cu(100), appearing as isolated dark circular spots. Further high-resolution STM imaging using a functionalized CO-terminated tip revealed a bright spot on the top of the Cu atom, suggesting an upright adsorption configuration for the CO molecule on Cu(100). TERS measurements over individual CO molecules provide further justification for such an adsorption configuration owing to the TERS selection rule, which favours the axial enhancement of out-of-plane vibrational modes perpendicular to the surface. Indeed, as shown in Fig. 2c, only two Raman modes are clearly observed: one is directly associated with the C−O stretching vibration at ~2063 cm−1, and the other is related to the Cu−CO stretching at ~332 cm−1, whereas the low-frequency in-plane FR (at ~32 cm−1) and FT (at ~288 cm−1) modes vibrating along the surface9 are completely absent (see Supplementary Fig. S1 for more details).
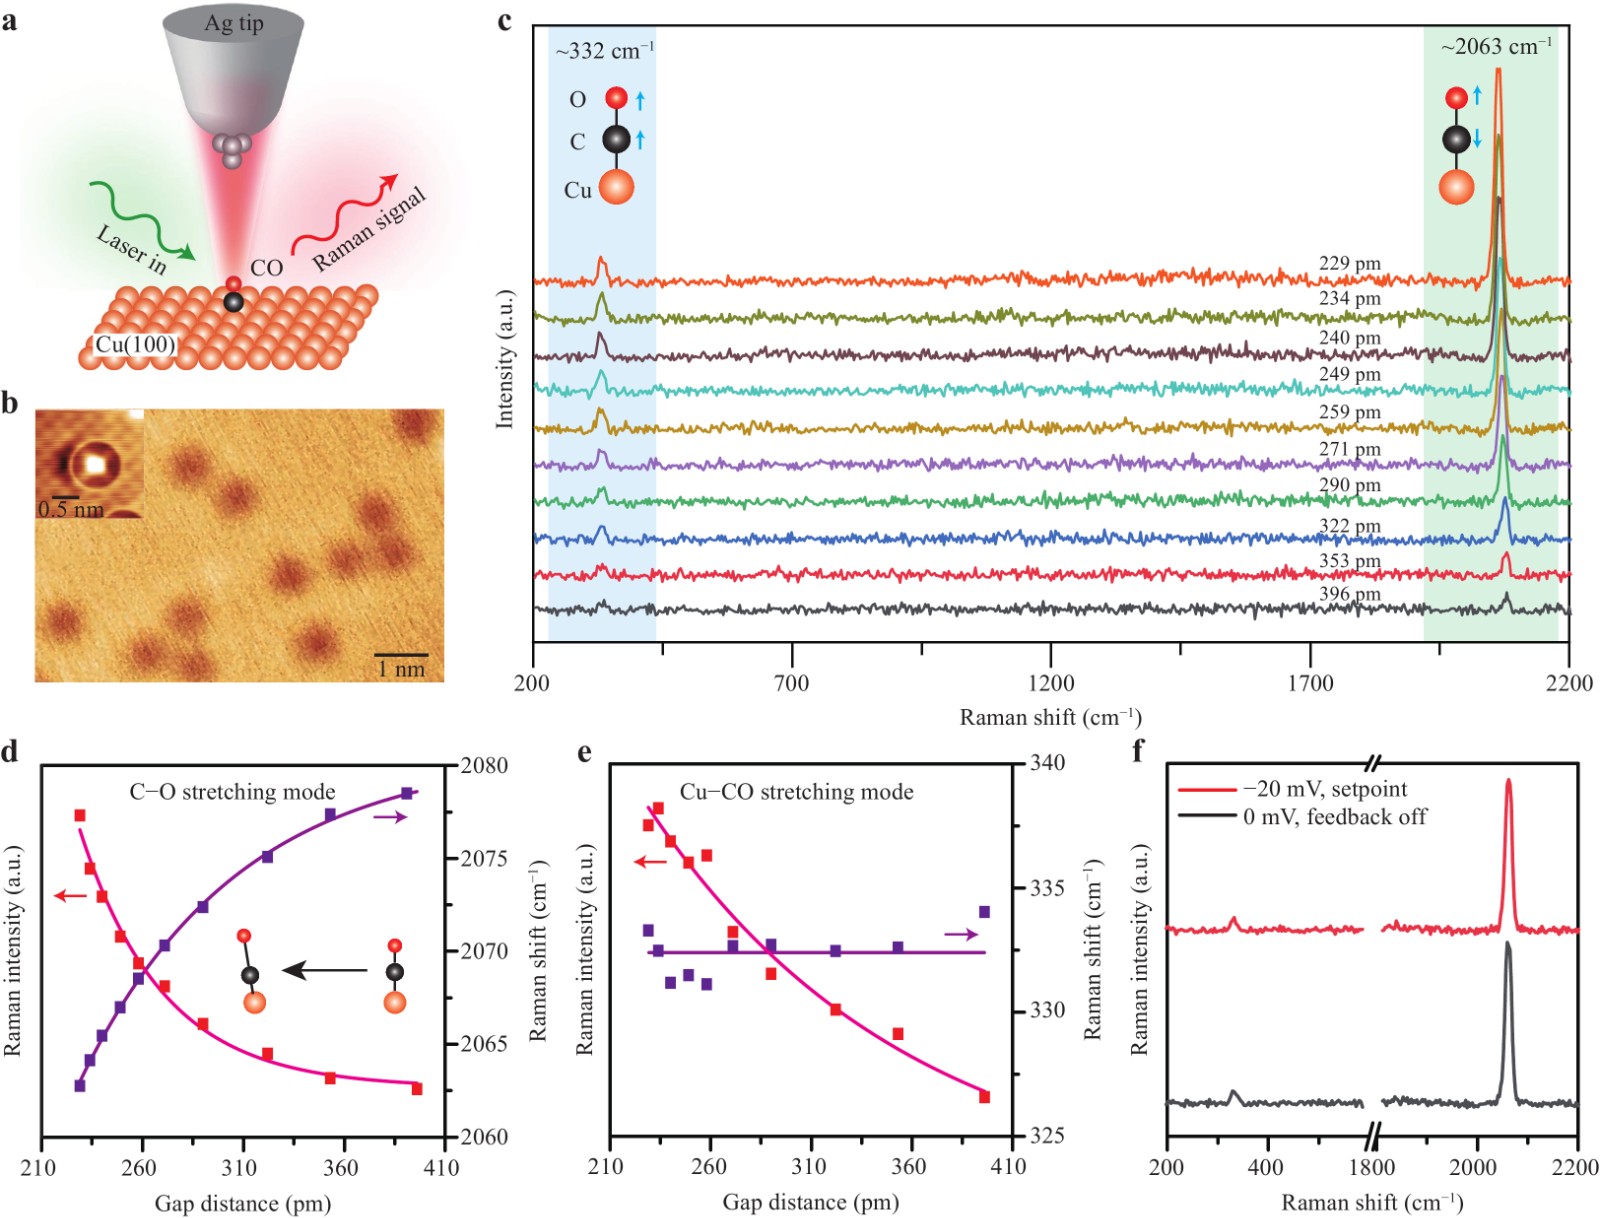
Fig. 2 Evolution of Cu−CO and C−O stretching vibrations during tip approach. a Schematic TERS setup. b STM topograph for a CO molecule on Cu(100) (−1 V, 2 pA). The inset shows a high-resolution image by a CO-terminated tip (−0.02 V, 1 nA). c TERS spectra acquired above the CO molecule on Cu(100) at different gap distances (−0.02 V, 180 s). The zero point of the gap distance (d) is defined as the position when the tip makes a contact to the metal substrate with the conductance reaching the conductance quantum G0. d, e Evolution of peak intensities and Raman shifts on the gap distance for the C−O stretching mode at 2063 cm−1 (d) and the Cu−CO stretching mode at ~332 cm−1 (e), respectively. The peak intensities and their exponentially fitted curve via
$ {I_{TERS}} = a{e^{ - d/k}} + b $ are shown in red, while the Raman shifts and fitted curve are shown in purple. f TERS spectra at a fixed gap distance of 229 pm for bias voltages of −20 mV and 0 mV, with the tip height defined by the setpoint of −20 mV and 8 nA.Notably, as the tip approached the molecule by reducing the gap distance between the tip apex and the metal substrate (e.g. from 396 pm to 229 pm, see Supplementary Figs. S2 and S3 for gap-distance determinations), the Raman peak for the C−O stretching mode was not only dramatically enhanced but also redshifted (Fig. 2d). In contrast, the Raman peak position for the Cu−CO stretching mode remained nearly unchanged, although it was also enhanced during the tip approach (Fig. 2e). As shown in Fig. 2d, e, the decay constant (k) of the Raman intensities for the C−O stretching mode (0.41 (4) Å) is much smaller than that for the Cu−CO stretching mode (1.3 (5) Å). This difference is consistent with the adsorption configuration, with the C−O bond being closer to the tip apex because the local electromagnetic field is known to be highly confined around the tip apex and thus decays more rapidly in close proximity. That is, the smaller the decay constant value, the faster the decay in both the local fields and Raman intensities, and thus, the closer the bond position to the tip apex.
On the other hand, there are two factors that could cause peak shifts during tip approach. One is the tip−molecule interaction and the other is the Stark effect caused by the influence of local electric fields. However, we believe that the evident redshifts of the C−O stretching mode from 2078 cm−1 at a gap distance of 396 pm to 2063 cm−1 at 229 pm are mainly due to the tip−molecule interaction. This is because the TERS data in Fig. 2c were acquired at a very low bias voltage of −20 mV, and the influence of the local electrostatic field on the chemical bond could thus be ignored. To justify this argument on the Stark effect, we performed a controlled experiment for a fixed gap distance of 229 pm by switching off the feedback and resetting the bias from −20 mV to 0 V simultaneously. As shown in Fig. 2f, the Raman peak position for the C−O stretching mode was found to change only by ~0.6 cm−1 under a bias of −20 mV, which is practically negligible compared to the large redshift of ~15 cm−1 during tip approach (Fig. 2d). The peak redshift for the C−O stretching mode is a clear indication of tip-induced C−O bond weakening, which arises mainly from the increasing force field from the approaching tip. Intriguingly, such tip−molecule interactions appear to have a greater effect on the stiffer C−O bond, rather than the softer Cu−CO bond, as the frequencies of the latter bond stretching hardly change during tip approach (see Supplementary Fig. S4 for more details).
Although the Stark effect at a very small bias has a negligible influence on the Raman peak shift, such influences at relatively large biases can become comparable to the shifts induced by tip approach. These shifts could be used to explore the microscopic mechanism of C−O bond weakening upon tip approach, owing to the sensitivity of the vibrational Stark effect on the molecular dipole orientation and field-induced charge redistribution (Fig. 3a). Fig. 3b shows the evolution of field-induced peak shifts of the C−O stretching mode at three different gap distances when the external electric field is varied by tuning the bias voltage from −0.6 V to 0.6 V [negative (positive) electric fields correspond to negative (positive) bias]. The vibrational Stark shifts resulting from the electric field were found to be larger than 10 cm−1, and the shifting direction strongly depends on the polarity of the applied bias. Positive biases always result in a blueshift of the C−O stretching mode, while negative biases lead to a redshift of this mode to lower wavenumbers. Therefore, a positive slope of the Raman shift versus electric field (E = V/d) was obtained for each gap distance. Such Stark effect-induced behaviour can be understood in terms of electric-field-induced charge redistributions between the CO molecule and the Cu substrate37. For example, at negative biases, the field promotes the transfer of electrons from the s-electrons of Cu to the antibonding 2π* orbitals of CO38, resulting in the weakening of the C−O bond and thus the redshift of the corresponding stretching vibrational frequencies. More precisely, the linear dependence of vibrational energy on the applied electric field observed in Fig. 3b can be expressed as31,39,40
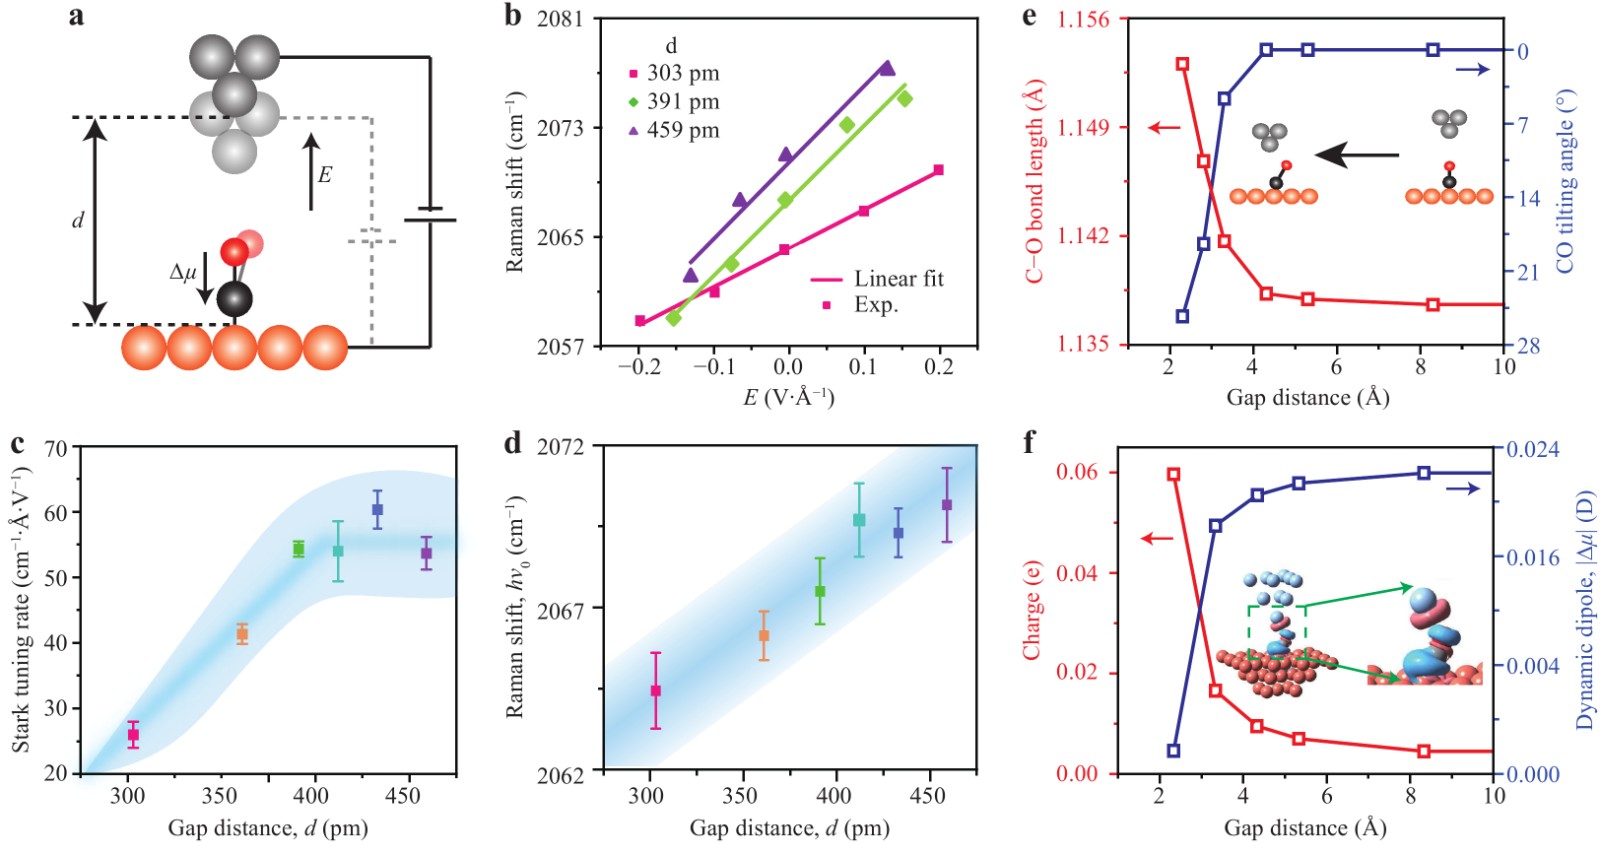
Fig. 3 Vibrational Stark effect of the C−O stretching mode at different gap distances. a Schematic junction geometry highlighting the direction of the external field and dynamic dipole moment. b Electric-field dependence of Raman shifts for the C−O stretching mode at three gap distances of 303, 391 and 459 pm. c Gap-distance dependence of the Stark tuning rate. d Gap-distance dependence of field-free Raman shifts (hν0) obtained by extrapolating the bias voltage to zero. e Calculated gap-distance dependence of the C−O bond length and CO tilting angle. The inset shows the schematic of structural changes of the adsorbed CO due to tip approaching. f Calculated gap-distance dependence of charge and dynamic dipole for CO adsorbed on Cu(100). The inset shows the isosurface of the electronic density difference with the value ρiso = ±0.001 e/Å3 for the gap distance d = 2 Å, in which the red and blue colors represent electron depletion and accumulation, respectively.
$$ h\nu = h{\nu _0} - \Delta {\boldsymbol\mu} \cdot {\mathbf{E}} $$ (1) where h is the Planck constant, E is the electric field, ν0 is the C−O stretching vibrational frequency at E = 0, and Δμ represents the dynamic dipole moment (i.e. the change in dipole moment) of the adsorbed CO corresponding to the stretching mode, whose amplitude is also known as the Stark tuning rate. Under the harmonic oscillator approximation, the value of Δμ can be expressed as follows to correlate with the molecular vibrations39:
$$ \Delta \boldsymbol\mu = - \frac{h}{{4{\pi ^2}{\nu _0}m}}{\mu ''_2} $$ (2) where m is the reduced mass corresponding to the C−O stretching mode and
$ {\mu ''_2} $ is the second-order derivative of the molecular dipole for normal coordinates. Therefore, the positive values of the slopes in Fig. 3b yield a negative value for the CO dynamic dipole moment Δμ, which indicates that its orientation is directed from O to C (Fig. 3a), in contrast to the static dipole moment μ0 of CO with a negative pole on the C atom41. In other words, the vibrational Stark effect probed by TERS (Fig. 3b) verifies experimentally that the C atom of CO is bonded to the surface Cu atom, with the O atom directed outwards.Notably, as shown in Fig. 3b, c, the dependence of the slope (or Stark tuning rate) on the gap distance can be classified into two regions. For gap distances larger than ~390 pm (3.9 Å), the stark tuning rates are almost unchanged, with an approximate value of ~55 cm−1·Å·V−1, yielding a dynamic dipole with a magnitude (|Δμ|) of ~0.03 Debye (D). The invariance of the Stark tuning rate implies that the orientation of the C−O bond, along with the direction of Δμ, remains unchanged provided that the gap distance is sufficiently large. Nevertheless, even in this region, the C−O bond length is still influenced by the force imposed by the tip, as demonstrated by the continuous redshift of the field-free Raman peak for the C−O stretching vibration (hν0) as the tip approaches (Fig. 3d). The field-free Raman shifts were obtained by extrapolating the bias to zero to exclude the influence of the field-induced Stark effect on the redshifts.
However, when the gap distances are smaller than ~390 pm, the Stark tuning rates are found to decrease rapidly, which implies that either the orientation or magnitude of the dynamic dipole, or both, is likely to change significantly due to the ever-approaching tip. To help understand the structural changes in the adsorbed CO molecule due to the interaction with the tip, we performed theoretical simulations based on density functional theory (DFT) (see Supplementary Fig. S5 for details). Fig. 3e shows the dependence of the C−O bond length and the CO tilting angle on the gap distance between the tip and the substrate. For gap distances larger than ~500 pm, the tilting angles of the CO molecule with respect to the surface normal were negligibly small, while the bond lengths remained nearly constant. However, when the gap distance decreased from 500 pm to ~400 pm, the molecule still remained essentially un-tilted, but the bond length became slightly elongated. As the gap distance further decreased below ~400 pm, the molecule started to tilt and the bond length became elongated more rapidly.
It is worth pointing out that the gap distance of ~3.9 Å observed for the turning point of the Stark tuning rates in Fig. 3c does not seem to be accidental. This distance corresponds to an interatomic distance of ~3.6 Å between the Ag atom at the tip apex and the O atom of the CO molecule, which is very close to the Ag···O van der Waals distance of ~3.65 Å42. That is, for gap distances above 390 pm, the force between the tip and the CO molecule is mainly an attractive van der Waals interaction, which pulls the C−O bond slightly longer but naturally maintains the adsorbed CO molecule in the vertical configuration without tilting. However, when the gap distance is smaller than 390 pm, beyond the Ag···O van der Waals contact, the Pauli repulsive force between the tip and the CO molecule starts to dominate, causing the CO molecule to tilt away from the upright configuration. According to the theoretical simulations shown in Fig. 3e, f, such tilting could lead to more overlap of the electronic densities of CO with the surface Cu atoms, and thus, more charge transfer from the substrate (see Supplementary Figs. S6–S7). As a result, the antibonding 2π* orbitals of CO could become more occupied upon tip approach, which leads to the elongation of the C−O bond and the resultant continuous redshift of the C−O stretching vibration mode. Moreover, the magnitude of the dynamic dipole moment also decreases, particularly when the tip is very close (d < 390 pm), as shown in Fig. 3c and 3f. Therefore, the observed decrease in the slope of the Raman peak shifts against gap distances can be attributed to the reduction in the value of Δμ·E, arising from both the tilting and decrease in the dynamic dipole Δμ as the tip approaches.
To further examine the tilting of the adsorbed CO molecule on the Cu(100) surface, we measured the spatial TERS mapping images for the C−O stretching mode at different gap distances (i.e. tip heights). Fig. 4a shows an STM topograph of a single CO molecule adsorbed on top of a Cu atom, with the schematic in Fig. 4b illustrating the corresponding atomic structure in the same area. By scanning the tip over the adsorbed CO molecule in the constant-height mode and acquiring a TERS spectrum at each pixel during scanning, we can simultaneously obtain spatial mapping images of TERS intensities and Raman peak shifts for the C−O stretching mode, as shown in Fig. 4c–f for a fixed gap distance of 230 pm or 185 pm, respectively. While the spatial distribution of the TERS intensities was almost symmetric, the Raman peak shifts appeared to distribute their minima toward the hollow site along the [110] direction, which is consistent with the optimised structure of the adsorbed CO molecule with an approaching tip (see Supplementary Fig. S5 for details). To analyse these differences in detail, we compared the line profiles of the TERS intensities and peak shifts along the [110] direction (dashed line in Fig. 4b), as shown in Fig. 4g. In principle, for a fixed chemical bond on the surface, a closer tip would provide better spatial resolution in TERS mapping because of the more localised plasmonic field in the nanocavity. However, the observed line profiles of the TERS intensities show a similar full width at half maximum (FWHM) of approximately 5.6 Å for gap distances of 230 and 185 pm, with the shorter one even appearing slightly larger (Fig. 4g). Notably, such a FWHM value, while clearly demonstrating a spatial resolution down to sub-nanometre scales, is much larger than the spatial resolution previously demonstrated for a single chemical bond (~1.5 Å) under similar gap distances24,25. Therefore, the adsorbed CO molecule appears unstable during TERS mapping and is likely to tilt differently, depending on the degree of tip−molecule interactions during scanning.
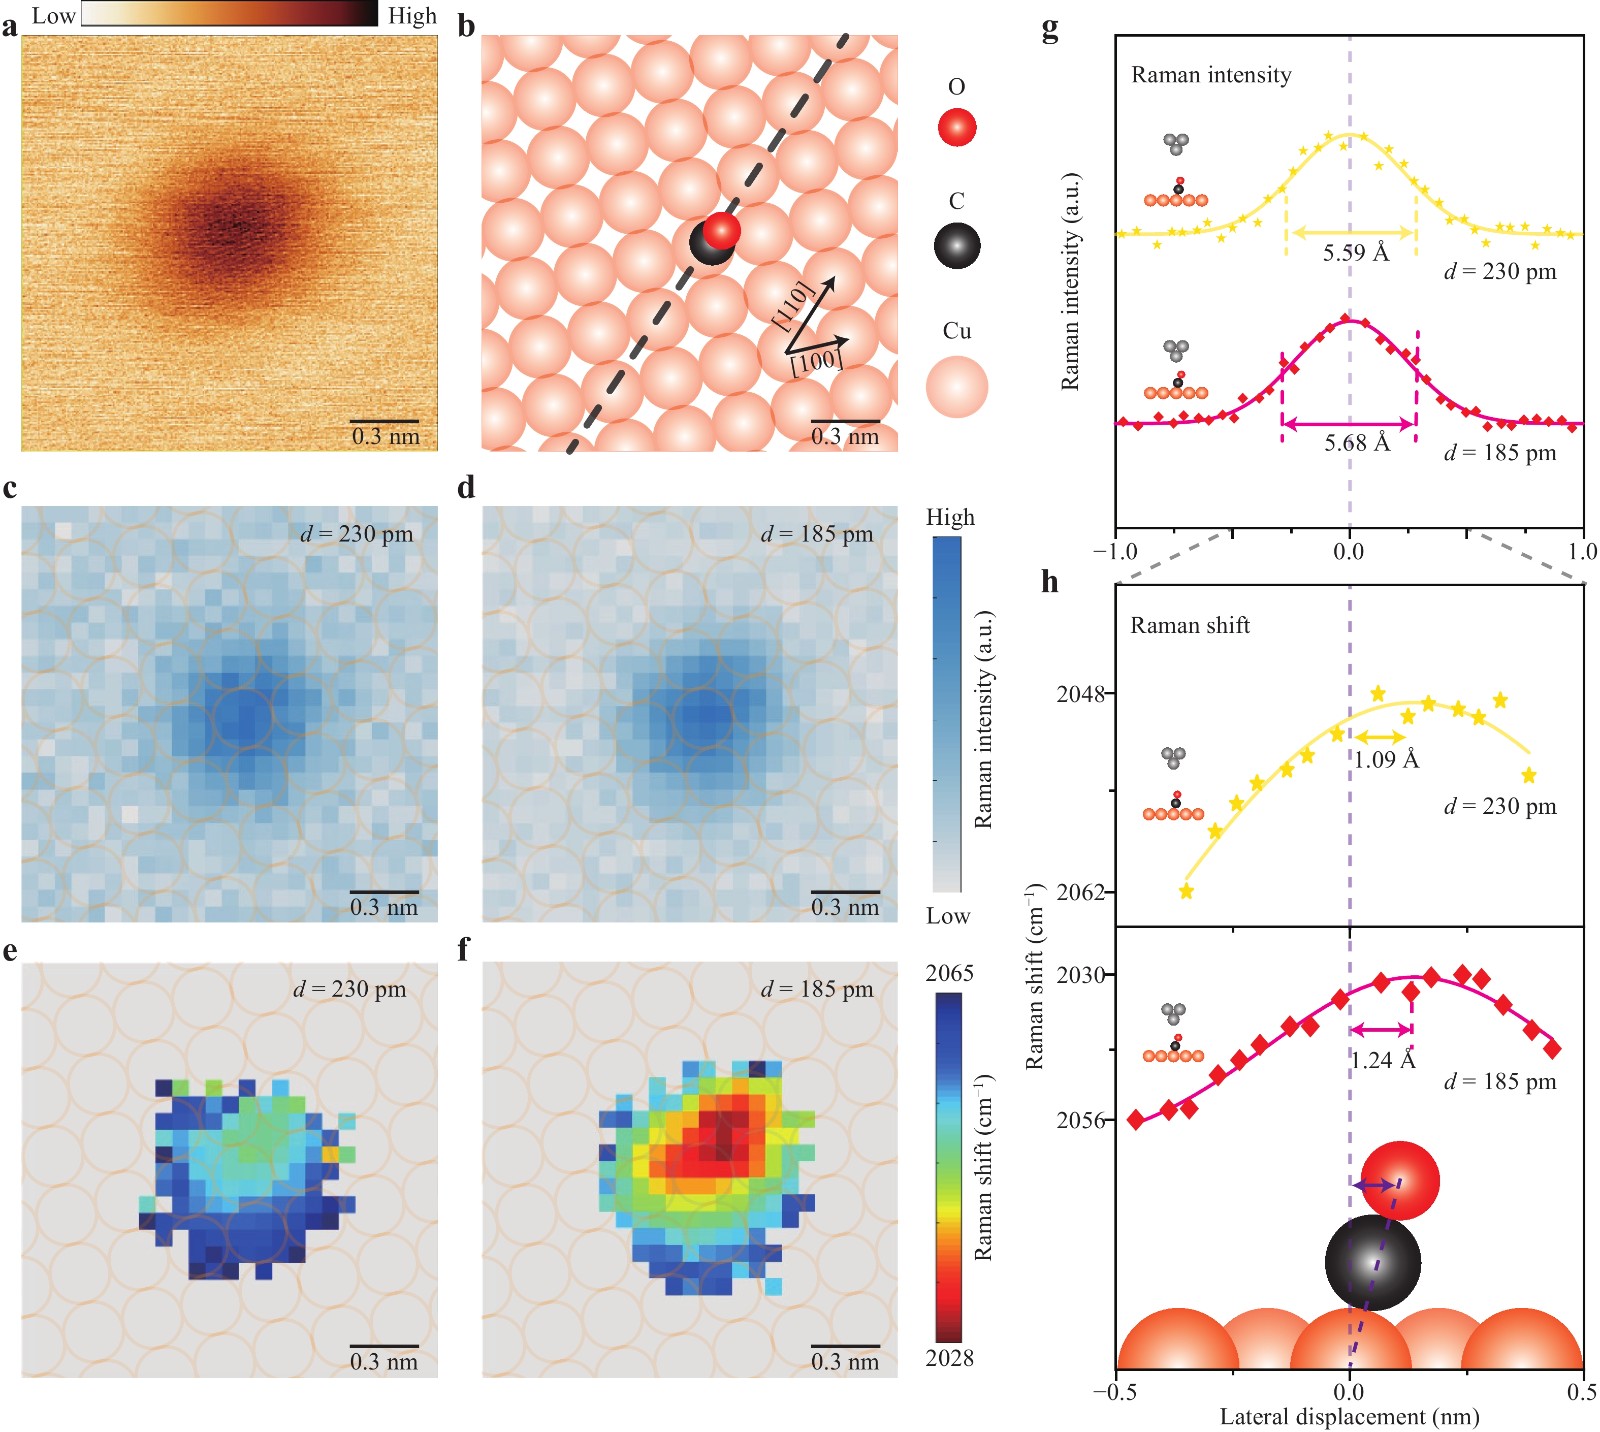
Fig. 4 Revealing the sway direction of the CO molecule by TERS mapping. a STM image of a single CO molecule on the Cu(100) surface (18 Å×18 Å, −0.02 V, 2 pA). b Schematic illustrating the sway direction of the CO molecule. The dashed line-trace is used for all the line-profile analyses in this figure. c, d Raman intensity maps for the C−O stretching mode obtained from the experimental spectroscopic image in the constant-height mode (25×25 pixels, 18 Å×18 Å, 5 s per pixel). The gap distance is 230 pm in c and 185 pm in d. e, f Spatial distribution of Raman peak shifts. The gap distance is 230 pm in e and 185 pm in f. g, h Line-profile analyses of Raman intensities (g) and peak shifts (h) for the same dashed line trace shown in b.
Such tilting details are shown more clearly by the spatial distribution of the peak shifts, as shown in Fig. 4h. Considering the symmetric pattern of the TERS intensity mapping images at different gap distances, we can view their centre as the top site above the Cu atom (indicated by the dashed lines in Fig. 4g, h). Then, for the tip distance of 230 pm, the minimum of the Raman peak shifts is displaced by ~1.09 Å along the [110] direction toward the hollow site. As the tip gets closer (185 pm), the displacement increases to ~1.24 Å. Assuming that the minimum position in the peak-shift distribution corresponds to the position of the O atom at the top (see Supplementary Fig. S8 for details), and considering that the distance between the O atom of the CO molecule and the adsorbed Cu atom is 3.04 Å (see Supplementary Fig. S5 for details)41, we estimated the largest tilting angle of the adsorbed CO molecule to be ~21° for the gap distance at 230 pm and ~24° for the gap distance at 185 pm. These tilting values are qualitatively consistent with the predicted tilted structure of the CO molecule at smaller gap distances based on the theoretical simulations and dynamic dipole analysis in Fig. 3. Further reducing the tip height (i.e. gap distance) would induce increased tilting of the CO molecule and eventually lead to a lateral hopping motion of the adsorbed CO molecule (Fig. 5a−c). Fig. 5a, b show an example of observed CO molecular manipulation when the gap distance is decreased from 216 pm to 86 pm (Fig. 5c), with the molecule appearing to “move” to adsorb on the diagonal Cu atom in the [110] direction. During the tip approaching process, the Raman shifts of the TERS spectra jumped twice, first when the gap distance was decreased to 146 pm and then further decreased to 96 pm. Such abrupt changes can also be observed in the simultaneously recorded tunnelling currents (right of Fig. 5c). For each jump in the Raman shifts, there is always a current jump for a given tip height, which suggests a sudden change in the molecular junction structure, likely with the molecule moving away.
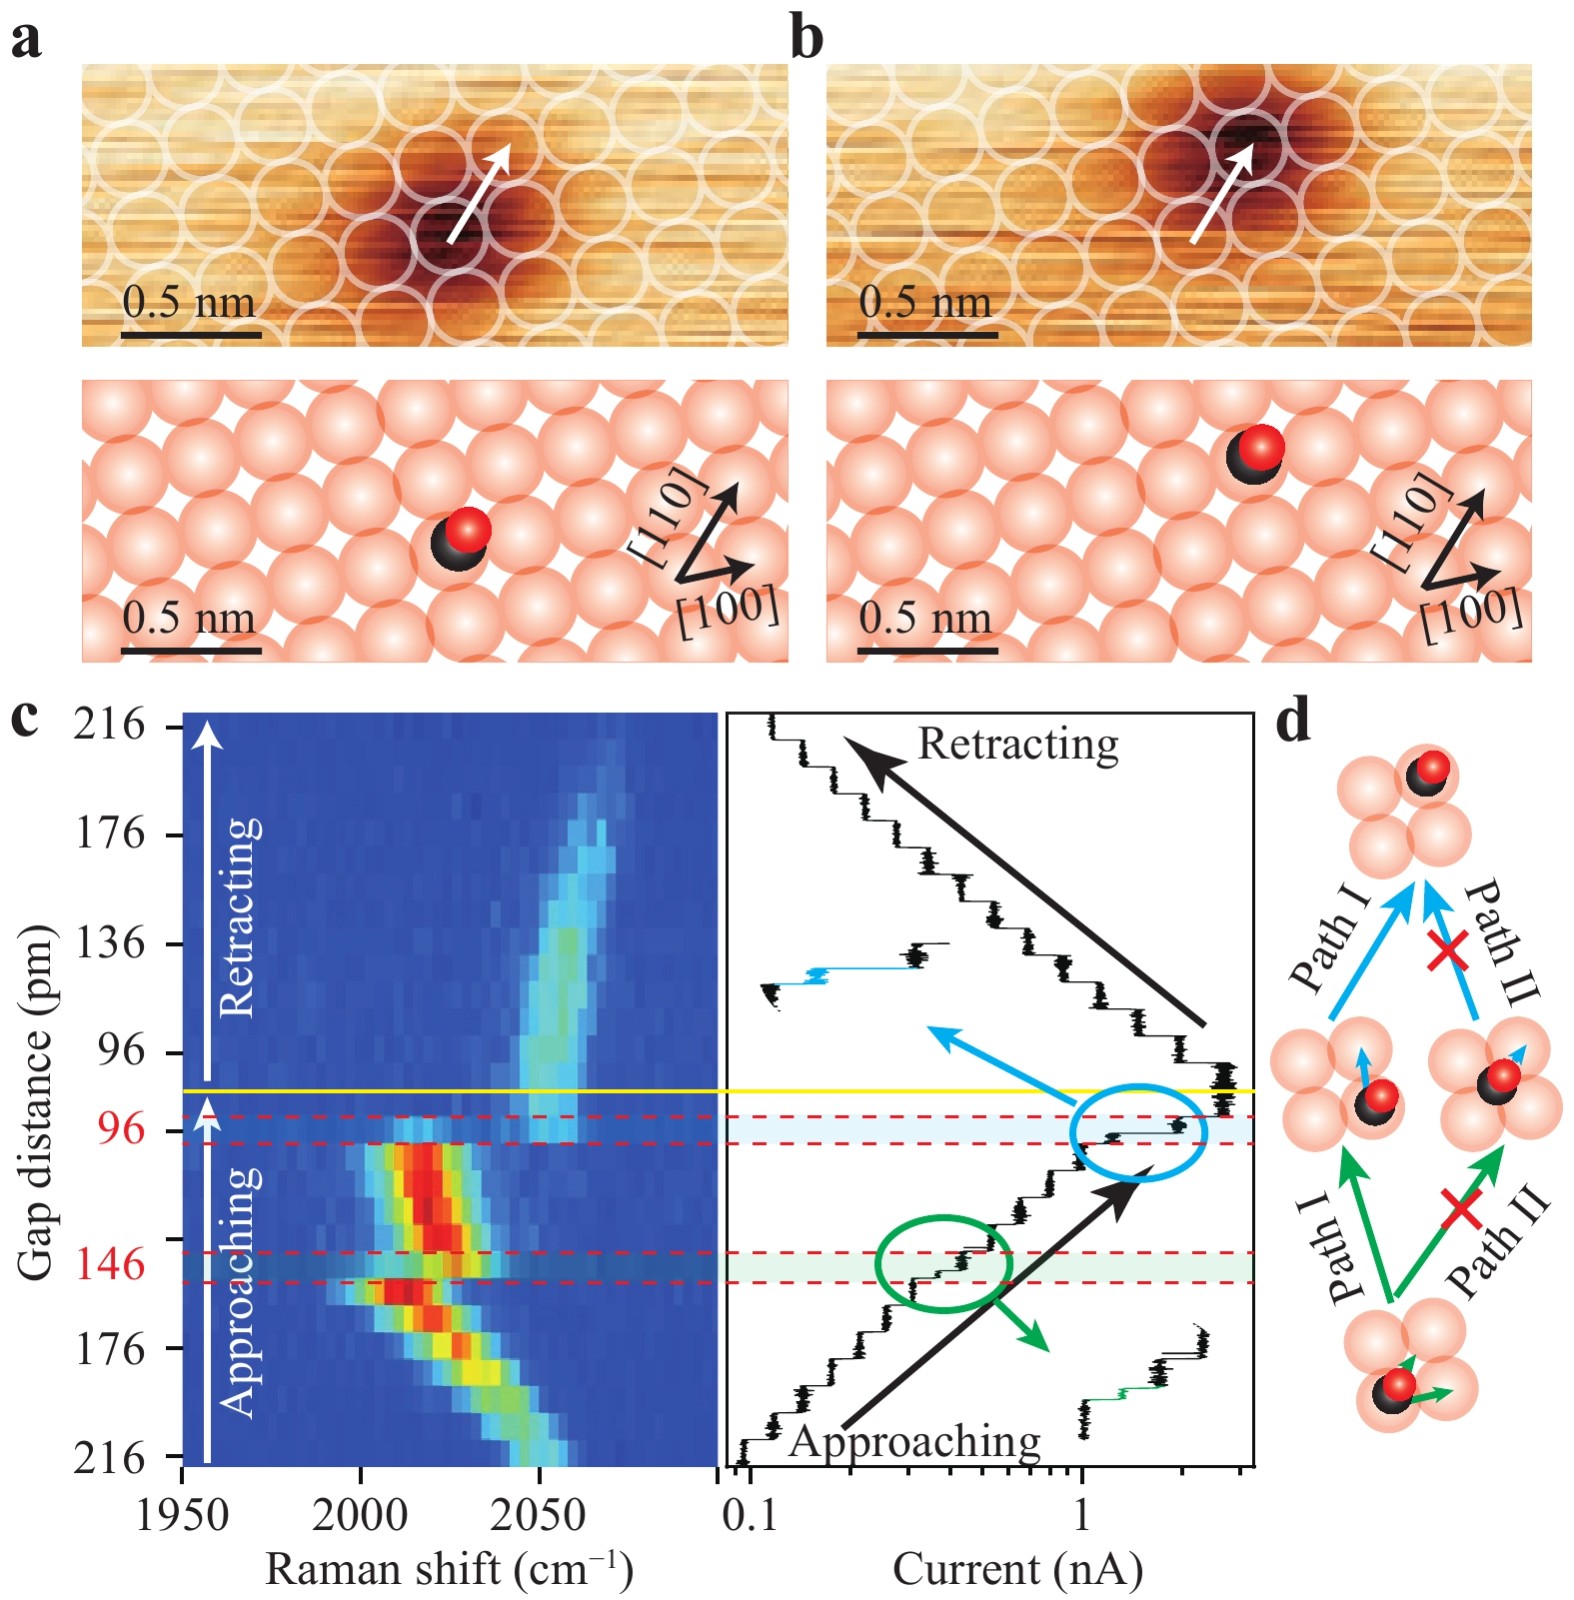
Fig. 5 Tip-induced hopping of CO on Cu(100). a,b Initial (a) and final (b) STM image (top) and schematic of the corresponding adsorption position (bottom) for a single CO molecule on the Cu(100) surface before and after the tip manipulation described in c. c Left: waterfall plot of TERS spectra for different gap distances (initial set-point condition: −0.02 V, 10 nA; vertical step distance: 10 pm; integration time per spectrum: 5 s). Right: Simultaneously recorded variations in the tunneling current during tip approaching and retraction, with two circles highlighting the current jump at the gap distances of 146 and 96 pm. d Schematic showing two possible pathways for the hopping process of a single CO molecule on the Cu(100) surface.
There are two possible pathways for the CO motion on metal surfaces43,44. As shown in Fig. 5d, one pathway (Path I) follows a two-step consecutive hopping process via the bridge site, first along the [100] direction and then along the [010] direction (or the sequence is reversed). The other pathway (Path II) proceeds via the hollow site along the [110] direction. Based on previous studies43,44, the hollow site possesses a very shallow minimum for the adsorbed CO molecule; therefore, it is impossible for the CO molecule to stay at the hollow site for a substantial amount of time. Indeed, we did not observe CO molecules adsorbed at the hollow sites of Cu(100). In other words, the stable Raman signals detected after the first jump for the gap distance from 146 to 106 pm over several tens of seconds cannot originate from a CO molecule adsorbed at the hollow site. Consequently, the clear two-step process revealed by the two jumps in the Raman shifts in Fig. 5c strongly suggests that Path I is the pathway responsible for the CO motion observed in Fig. 5a, b (see Supplementary Fig. S9).
Specifically, when the gap distance was decreased from 216 to 156 pm, the CO molecule was driven to tilt significantly (~30°), as revealed by the dramatic Raman redshifts from 2047 cm−1 to 2010 cm−1. While such a large tilting weakens the C−O bond (and probably the Cu−CO bond too), it causes enhanced interactions with the nearest-neighbour Cu atom. Thus, further decreasing the gap distance to 146 pm induced the first hopping process via the bridge site. Nevertheless, the upright CO molecule adsorbed on the nearest-neighbour Cu atom is still influenced by the tip at such a small gap distance of 146 pm. This is evidenced by the Raman redshift of 2023 cm−1 which is smaller than 2010 cm−1, as expected, but still quite large compared to ~2078 cm−1 for CO molecules with negligible tip influence. A further decrease in the gap distance to 96 pm causes the molecule to tilt more with a weakened C−O bond (revealed by the redshift of 2015 cm−1) and thus induces second hopping. In fact, the TERS spectrum at a gap distance of 96 pm contains dynamic information that the CO molecule adsorbed at the nearest-neighbour Cu atom quickly hops to the diagonal Cu atom via the bridge site because two Raman shifts (i.e. 2015 cm−1 and 2051 cm−1) for both structures are observed. Because the CO molecule adsorbed at the diagonal Cu atom is slightly farther from the tip in the lateral direction, its Raman intensity is weaker, and its Raman redshift is much smaller, which also suggests a smaller tilting angle of the CO molecule. Naturally, as the tip retracts, the tip−molecule interaction is further weakened, leading to ever-decreasing tilting angles and Raman redshifts. Eventually, at a gap distance of 216 pm, the Raman peak is still slightly red-shifted to ~2067 cm−1, which reveals that tip−molecule interactions still exist, with the CO molecule likely still in a tilted configuration.
-
In this work, we used sub-nanometre-resolved TERS not only to help determine the adsorption configuration of a prototypical surface science molecule such as CO on Cu(100), but also to investigate the microscopic mechanisms of tip-induced bond weakening, tilting, and hopping on the surface. Specifically, the vibrational frequency of the C−O stretching mode is always redshifted as the tip moves closer to the top O atom of the upright CO molecule, which signifies the weakening of the C−O bond owing to tip−molecule interactions. Further investigations on the vibrational Stark effect at different gap distances, together with theoretical simulations of the optimised CO adsorption configurations, indicate that such tip−molecule interactions can be classified into two regions, depending on whether the tip–molecule distance is smaller or larger than the van der Waals separation of ~3.65 Å between the Ag atom at the tip apex and the O atom of the CO molecule.
For tip–molecule distance above ~3.65 Å, the bond weakening is attributed to the attractive van der Waals interaction which pulls the bond slightly longer. For tip–molecule distances below ~3.65 Å, the Pauli repulsive force starts to dominate, which drives the molecule to tilt. Such tilting leads to a greater overlap of the electronic densities of CO with the surface Cu atoms, and thus, more charge transfer from the substrate. As a result, the antibonding 2π* orbitals of CO become more occupied, leading to elongation of the C−O bond and the resultant frequency redshift of the C−O stretching vibration. Further TERS spatial imaging indicated that the CO molecule was tilted toward the hollow site with tilting angles greater than 20° for gap distances below ~230 pm. When the gap distance was decreased to ~146 pm, the molecule was found to tilt ~30° and started to hop to the nearest-neighbour Cu atom via the bridge site. Further reduction of the gap distance to ~96 pm generates another hopping of the same molecule, because the molecule is again tilted by ~30°. Direct hopping of CO via the hollow site to the diagonal Cu atom is unlikely. Our results demonstrate that TERS can provide an insightful understanding of the chemical structure, tip−molecule interactions, and tip-induced molecular motions at the single-bond level, which opens up a promising route to explore the microscopic mechanisms of surface reactions and catalysis.
-
Our STM imaging and TERS experiments were performed on a custom-built optical-STM system operating under ultrahigh vacuum (~1.0×10⁻¹⁰ Torr) and liquid helium cryogenic conditions (~7 K). The Cu(100) substrate used in the present work was cleaned by argon-ion sputtering and annealing cycles. Ag tips were used in all the experiments.
-
This work was supported by the National Key R&D Program of China (Grant Nos. 2021YFA1500500 and 2016YFA0200600), National Natural Science Foundation of China (Grant No. 21790352), Strategic Priority Research Program of the Chinese Academy of Sciences (Grant No. XDB36000000), and the Anhui Initiative in Quantum Information Technologies (Grant No. AHY090000). B.Y. acknowledges the support from the China National Postdoctoral Program for Innovative Talents (No. BX2021282).
Tip-induced bond weakening, tilting, and hopping of a single CO molecule on Cu(100)
- Xiaoru Dong,
- Ben Yang,
- Rui Zhu,
- Ruipu Wang,
- Yang Zhang,
-
Yao Zhang*, ,
 ,
, -
Zhenchao Dong*, ,
- Light: Advanced Manufacturing 3, Article number: (2022)
- Received: 31 August 2022
- Revised: 16 November 2022
- Accepted: 16 November 2022 Published online: 01 December 2022
doi: https://doi.org/10.37188/lam.2022.052
Abstract: The interaction between a probing tip and an adsorbed molecule can significantly impact the molecular chemical structure and even induce its motion on the surface. In this study, the tip-induced bond weakening, tilting, and hopping processes of a single molecule were investigated by sub-nanometre resolved tip-enhanced Raman spectroscopy (TERS). We used single carbon monoxide (CO) molecules adsorbed on the Cu (100) surface as a model system for the investigation. The vibrational frequency of the C−O stretching mode is always redshifted as the tip approaches, revealing the weakening of the C−O bond owing to tip−molecule interactions. Further analyses of both the vibrational Stark effect and TERS imaging patterns suggest a delicate tilting phenomenon of the adsorbed CO molecule on Cu(100), which eventually leads to lateral hopping of the molecule. While a tilting orientation is found toward the hollow site along the [110] direction of the Cu(100) surface, the hopping event is more likely to proceed via the bridge site to the nearest Cu neighbour along the [100] or [010] direction. Our results provide deep insights into the microscopic mechanisms of tip−molecule interactions and tip-induced molecular motions on surfaces at the single-bond level.
Research Summary
Tracking a single bond: Ångstrom-resolved TERS
Probing tip-molecule interactions and tip-induced molecular motions on surfaces at the single-bond level can provide deep insights into the mechanisms of surface reactions and catalysis. Recent advancement in tip-enhanced Raman spectroscopy (TERS) has pushed the spatial resolution down to the Ångstrom scale with a single-bond sensitivity. Zhen-Chao Dong and colleagues from University of Science and Technology of China now report the use of such an Ångstrom-resolved TERS technique to track tip-induced bond weakening, tilting, and hopping processes of a single CO molecule on Cu(100). The vibrational frequency of the C−O stretching mode is found always redshifted as the tip approaches, revealing the weakening of the C−O bond due to tip-molecule interactions. Further TERS imaging suggests a tilting phenomenon of CO, which eventually leads to the lateral hopping of the molecule on the Cu(100) surface.


Rights and permissions
Open Access This article is licensed under a Creative Commons Attribution 4.0 International License, which permits use, sharing, adaptation, distribution and reproduction in any medium or format, as long as you give appropriate credit to the original author(s) and the source, provide a link to the Creative Commons license, and indicate if changes were made. The images or other third party material in this article are included in the article′s Creative Commons license, unless indicated otherwise in a credit line to the material. If material is not included in the article′s Creative Commons license and your intended use is not permitted by statutory regulation or exceeds the permitted use, you will need to obtain permission directly from the copyright holder. To view a copy of this license, visit http://creativecommons.org/licenses/by/4.0/.

 DownLoad: