


-
Optical measurement techniques collecting light intensity in the far-field such as conventional and confocal microscopy or coherence scanning interferometry (CSI) enable fast and contactless inspection of several types of specimens. Thus, optical measurement instruments are widespread in science and industry. Nonetheless, optical measurement instruments suffer from diffraction effects leading to a fundamental lateral resolution limitation given by the minimum resolvable period length of
$ l_{x,{\rm{Abbe}}}=\lambda/(2{\rm{NA}}) $ (Abbe-limit) depending on the illuminating wavelength$ \lambda $ and the numerical aperture (NA) of the objective lens1.In order to overcome the resolution limit, microspheres2, -cylinders3 and other microelements such as solid immersion lenses (SILs)4, in the following summarized as microspheres, can be applied in microscopic imaging and measurement. Microspheres placed close to the surface under investigation are shown to enable a local improvement of the lateral resolution and a magnification enhancement, still providing full- and far-field measurements and, thus, the measurement process remains fast and contactless2,5−8. For a comprehensive review of microsphere-assisted microscopy we refer to Darafsheh9.
Furthermore, microspheres can be combined with CSI to additionally obtain electromagnetic phase information and thus to achieve an outstanding axial resolution10−12. Since the improvement of the optical resolution is of great interest in many fields of application of microscopic imaging (for a comparison of existing methods see13), microsphere-enhanced measurements are part of many recent experimental and theoretical publications14−26.
Possible applications of microsphere-assisted microscopy and interferometry are for example related to the measurement of features of engineered surfaces with lateral dimensions beyond the resolution limit (see e.g.2,9). Since microspheres of high refractive index material can be combined with immersion objectives6 or embedded in elastomers27, microsphere-assisted measurements are also applicable to biological and medical objects such as viruses7, sub-cellular structures28 or for identification of blood-cells29. Therefore, microsphere-assisted measurements are used in a large range of applications and hence many theoretical studies are conducted to understand and analyze the phenomena leading to resolution-enhancement.
Sundaram and Wen16 present a finite element method (FEM) based simulation model of a complete microscopic imaging process. However, their model is restricted to small magnifications due to increasing computational effort with increasing magnification, since the lens system is included in the FEM modeling. Further, their model is not appropriate for simulating CSI measurement results in realistic computation time. In addition, spatially incoherent Köhler illumination usually employed in conventional microscopes and CSI is difficult to apply.
Hoang et al.30 present a full modeling of coherent 3D illumination and 3D imaging considering focusing and imaging by a microsphere approximating the scattering object to emit coherent multipole fields. The model is based on a previously published simulation of a microscopic system using SILs31.
Maslov and Astratov32−34 developed a model based on an analytical expansion in cylindrical eigenfunctions considering the imaging by an objective lens as a low pass filter. Simulations are performed to analyze the resolution studying 2D imaging of two spatially separated dipole sources considering simulations of huge magnifications35.
We present a simulation model considering the full imaging process of a microsphere-enhanced interference microscope working in reflection mode equipped with objective lenses of high numerical aperture using an FEM calculation of the near-field scattering process. In contrast to previous theoretical models, we consider full 3D conical Köhler illumination with incident waves as well as conical imaging of the scattered light field by the microsphere, whereby arbitrary shaped profiles of various materials can be included. Additionally, a depth-scan is implemented. As mentioned by Wang and Luk’yanchuk36 such a simulation model is missing in present literature. Therefore, such measurement results of microsphere-enhanced microscopes and interferometers in reflection mode are not reproduced by simulations till now.
Instead, possible causes of the resolution enhancement such as photonic nanojets (PNJs) (see e.g.2,37), whispering-gallery modes (WGMs) (see e.g.3,15,19,38) and evanescent waves (EWs) (see e.g.5,6,23,39) are speculatively discussed and studied in aforementioned publications, but not proved to be the crucial effects as complained by Wang and Luk’yanchuk36 and Darafsheh9. Further, recent studies show that a local enhancement of the numerical aperture by the sphere is a likely reason for resolution enhancement9. Maslov and Astratov34 demonstrate that the width of the point spread function (PSF) is a more reliable measure for resolution compared to the width of the PNJ, what is an additional evidence for the local enhancement of the NA, since the NA-enhancement is similarly to the PSF closely related to the imaging properties of the sphere.
Our model reliably reproduces measurement results as it is demonstrated for several surface topographies measured with CSI as well as confocal microscopy without microsphere support in previous studies40−42. A first quantitative comparison with measurement results of microsphere-assisted interferometry is given in43. Using the model, we present a way to qualify the resolution enhancement by a microsphere and demonstrate, that the relative improvement of the lateral resolution as well as the enhanced lateral magnification decrease, whereas the field of view increases for larger NA values of the microscope objective lens.
The paper is structured as follows. Since various definitions and different ways of quantifying resolution are applied in context with microsphere-assisted microscopy and interferometry (see for example44,45) we give a short introduction to common definitions of resolution first to put our results in a proper context. Thereafter, the modeling and the associated setup are explained. Results presents an approach to analyze the resolution enhanced by the microsphere with respect to the definition given in Common definitions of resolution and classification of this work. In Discussion the approach is applied to investigate the resolution enhancement with respect to its possible causes for various NA values of the objective lenses. Finally (Conclusion), the main results are summarized and possible future applications are given.
-
Due to diffraction, optical imaging and measurement instruments working in the far-field are subject to the fundamental lateral resolution limit. In practice, there are several resolution criteria applied, depending on different more or less arbitrary theories and fields of application. In this section, we briefly introduce common lateral resolution criteria applied to conventional microscopy, distinguish between 2D and 3D resolution for CSI and discuss our work in context with these definitions. For a detailed overview of resolution in microscopy we refer to1. Further, a more detailed description especially with respect to ‘super-resolution’ was published by Sheppard46. An overview in the context of microsphere-assisted microscopy can be found in9.
In general, all resolution criteria lead to a minimum distance
$ l_x=K\lambda/{\rm{NA}} $ between two surface features, at which the features can be distinguished in the microscopic image if no aberrations appear, with$ {\rm{NA}}=n\sin(\theta_{\rm{max}}) $ depending on the refractive index$ n $ of the surrounding medium and the maximum half-angle$ \theta_{\rm{max}} $ covered by the objective lens. Simply the factor$ K=0.5,\:0.609,\:0.473\: $ and$ \:0.515 $ differs according to Abbe, Rayleigh, Sparrow and Houston criterion, respectively9.Abbe’s fundamental resolution limit considers the imaging of an optical grating, which diffracts incident light in several diffraction orders with angular distances depending on the illuminating wavelength and the period length of the grating. According to Abbe, the period of the grating can be reconstructed from the image, if the 0th and either the 1st or the −1st order of diffraction are captured by the objective lens.
The latter three resolution criteria are based on the imaging of two spatially separated point objects, which need to be distinguished in image plane. These criteria are defined more or less arbitrarily to specify whether the point objects can be distinguished or not.
Therefore, if point-like objects are investigated as it is for example usually the case for biological objects, typically one of these three criteria is applied. In the context with microspheres, corresponding studies are performed by e.g. by Maslov and Astratov32−34.
On the other hand, if technical objects such as phase gratings are measured, usually the Abbe limit is considered. However, it should be mentioned that all of the named resolution criteria are related to 2D resolution in the image plane, since measured heights are not considered.
Having regard to 3D imaging, which is usually done in CSI, more complex definitions based on the modulation transfer function (MTF)1 or the instrument transfer function (ITF)47 describing the imaged intensity contrast nomalized by the maximum contrast or the measured height of a surface profile normalized by the nominal value depending on the spatial frequency, respectively, can be considered. An even more complex definition of the transfer characteristics is given by the 3D transfer function (3D TF)1,48−50, which considers the transfer characteristics in 3D spatial frequency domain and thus can be applied to conventional microscopy as well as CSI. It should be noted that integration of the 3D TF with respect to the coordinate along the optical axis leads to the conventional MTF50.
However, since we are mainly interested in the absolute resolution limit achieved through the use of a microsphere considering the imaging of phase gratings, we analyze the resolution enhancement with respect to the definition of Abbe in this study. Note that the resolution limit in this case is related to the period length, i.e. the spatial frequency of the grating and, therefore, the MTF, ITF and 3D TF are restricted by the fundamental resolution limit as well. For example, considering a blu-ray disk consisting of 100 nm wide stripes separated by 200 nm wide grooves the period length and therewith the achieved lateral resolution in our case would be at least 300 nm instead of 100 nm compared to the definition by Wang et al.2 as similarly complained by Lecler et al.21 and Darafsheh9.
Finally, it should be noted that interferograms presented in this study (see e.g. Results) are images obtained from an interferometer during a depth-scan. Since CSI measurements are based on the same microscopic imaging properties as conventional microscopes, the fundamental resolution limit is expected to be exactly the same in both in contrast to e.g. confocal microscopy, where the resolution enhancement is influenced by the confocal effect and, thus, cannot be solely attributed to the microsphere as complained by Darafsheh44. All spatial frequencies contributing to a microscopic image contribute to an interferogram as well. Especially the phase evaluation is performed for certain spatial frequency ranges of an object’s structure as explained by Lehmann et al.51. Hence, the resolution limit obtained by CSI in this study is applicable to conventional microscopy, too.
-
A microcylinder of radius
$ r=2.5 $ μm with refractive index$ n_{\rm{sphere}}=1.5 $ is placed on a silicon sinusoidal phase grating with peak-to-valley amplitude of 25 nm. The amplitude is chosen to be small in order to avoid phase jumps and significant influences of multiple scattering effects. On the other hand, the amplitude must not be chosen too small so that phase differences caused by the grating exceed numerical inaccuracies. Therefore, height changes in the range of 25 nm are large enough to affect the signals, though the maximum radius of surface curvature remains significantly smaller compared to wavelengths in the visible range and thus the surface profile can be approximately treated as a phase object51−53. The bottom of the microcylinder is placed 5 nm above the peak of the highest point of the surface in the middle of the geometry.The whole setup considering the microcylinder on the grating structure is assumed to be periodic with a period length of
$ L_x=13.2 $ μm. In many experimental studies microspheres are placed on the surface next to each other (see e.g.5,6,12,54). Hence, periodically arranged microspheres obviously do not disturb the resolution enhancement and the assumption is legitimate. Changing the period length between 10 μm and 20 μm does not affect the results apparently. Therefore, we confine our results to the given period length of$ L_x=13.2 $ μm. Note that in contrast, periodicity of the measurement object under the sphere affects the resolution as experimentally demonstrated by Zang et al.55 and discussed by Darafsheh44 and Allen et al.56,57.The surface profile is obtained using a Linnik interferometer as sketched in Fig. 1. In this study monochromatic spatially incoherent Köhler illumination is used (see blue lines in Fig. 1). The light source is chosen to be monochromatic since for objective lenses of high NA and narrow bandwidth light sources temporal coherence effects are usually negligible. The NA of the objective lenses and the monochromatic illumination wavelength are given by NA
$ =0.9 $ and$ \lambda=440 $ nm if no other values are explicitly mentioned, the magnification factor is 100, the pixel width is assumed by 3.5 μm oriented to the setup used by Hüser and Lehmann12. The refraction coefficient of the silicon grating is$ n=4.7911+0.17032{\rm{i}} $ for$ \lambda= 440 $ nm58. The reference mirror assumed is a plane aluminum mirror ($ n=0.59969+5.3328{\rm{i}} $ ). The incident light is chosen to be TM-polarized, as the image contrast was shown to be significantly higher for TM-polarized light in microscopy6 and a similar effect of polarization was found in phase modulation in interference signals of our CSI simulations and measurement results.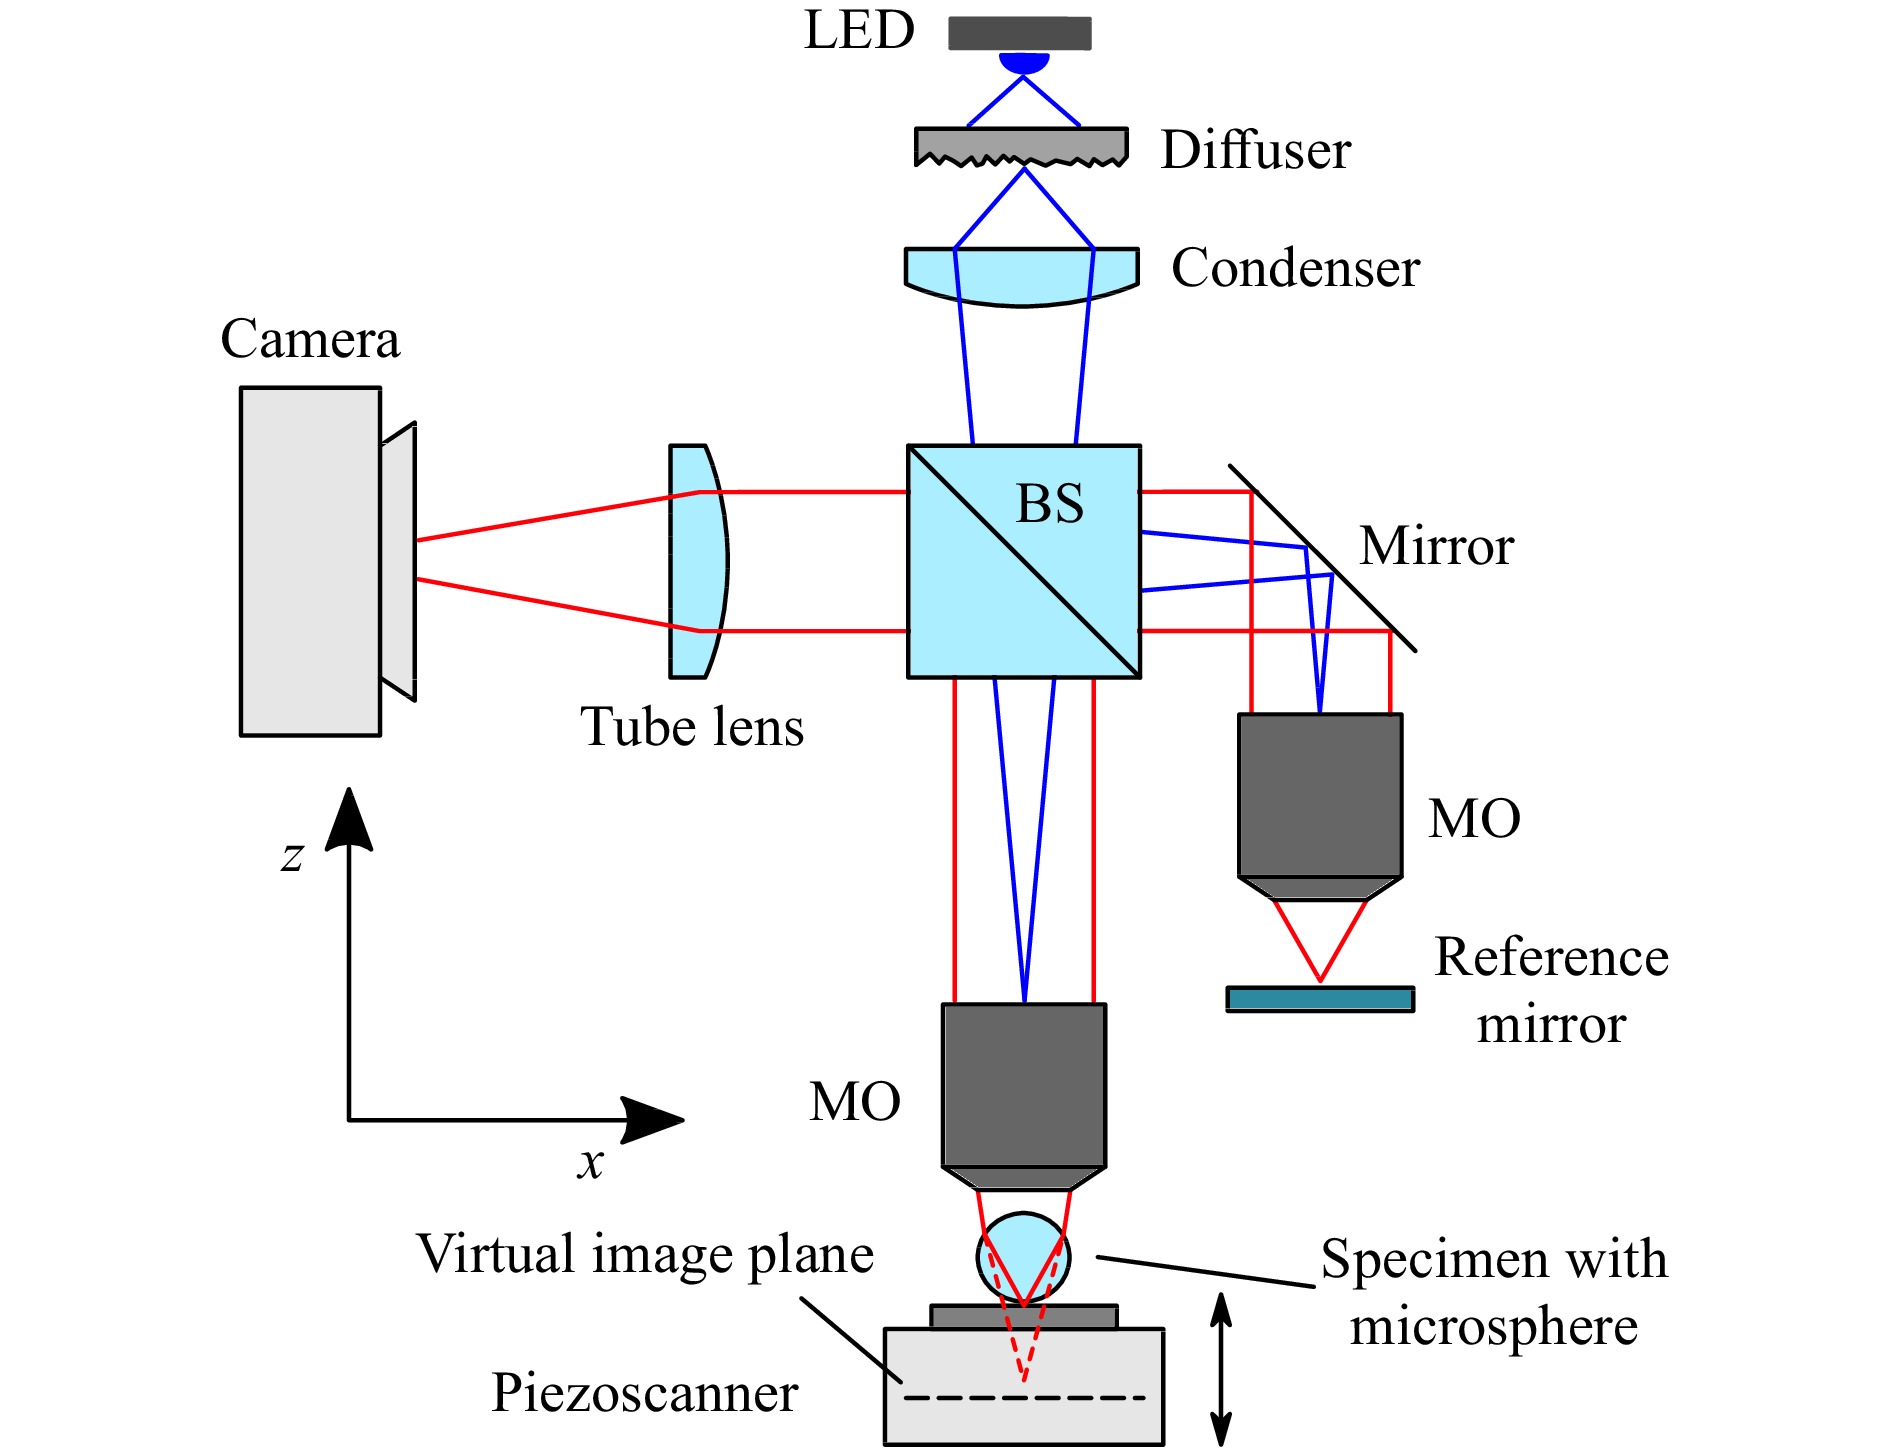
Fig. 1 Schematic representation of a microsphere-enhanced Linnik interferometer. The Köhler illumination beam path is marked by blue lines, the imaging ray path by red lines. BS denotes a beam splitter, MO a 100× microscope objective with NA
$ =0.9 $ .The scattering of an incident plane wave of electric field
$ {E}_{\rm{in}} $ at the surface structure including the microsphere is simulated with FEM. Fig. 2 illustrates the scattering geometry including the boundary conditions. The differential equation to be solved is the vector wave equation described in41. Since the setup is assumed to be periodic, quasi-periodic boundary conditions, composed of a periodic function multiplied by a phase term according to the incident wave, are applied. The top and bottom boundaries are extended by virtual damping layers called perfectly matched layers (PML) damping the scattered and transmitted parts of the electric field exponentially to zero avoiding reflections at the interfaces. The incident field is is introduced into the simulation domain by the Dirichlet boundary condition applied at the top of the upper PML and a source term defined inside the upper PML, since only the scattered field is affected by the PML. As the transmitted field is damped to zero in the bottom PML, the electric field is set to zero at the bottom boundary to reduce degrees of freedom. The boundary conditions used in this study are related to59,60.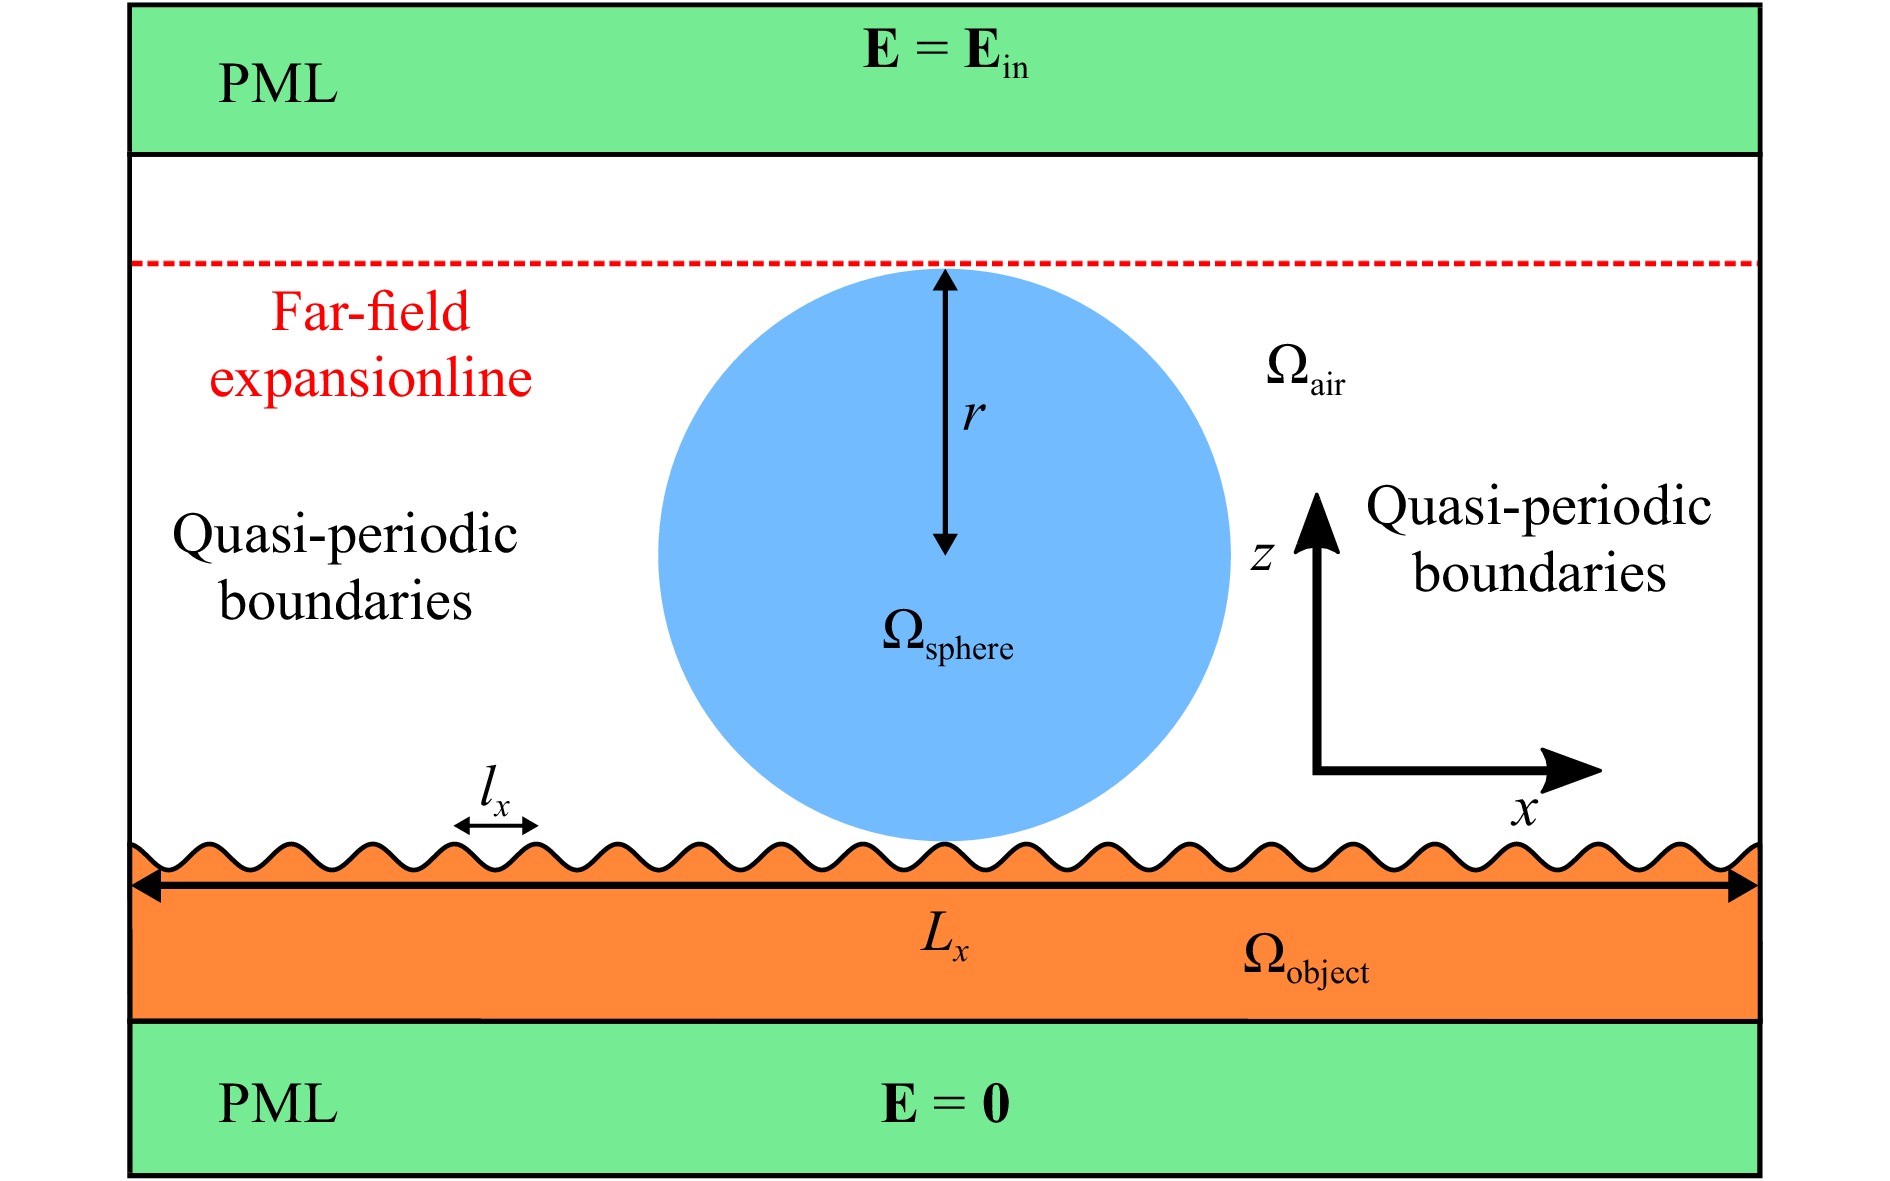
Fig. 2 Illustration of the FEM simulation domain consisting of two perfectly matched layers (PMLs), the microsphere (
$ \Omega_{\rm{sphere}} $ ) of radius$ r $ surrounded by air ($ \Omega_{\rm{air}} $ ) placed on the surface of the measurement object ($ \Omega_{\rm{object}} $ ), which is periodic with a period length of$ l_x $ . The left and the right boundaries are connected by quasi-periodic boundary conditions with the period length$ L_x $ , the top and bottom boundary conditions are given by$ {E}= {E}_{\rm{in}} $ at the top and$ {E}= {0} $ at the bottom as shown in the figure. The far-field is computed based on the field along the far-field expansion line marked by the red dashed line.A more detailed description of the FEM model can be found in41. Further, it should be noted that a 3D modeling of the illumination and scattering is implemented. Therefore, although a 2D geometry is discretized, also oblique out-of-plane angles of incidence are considered. In order to solve a 3D vector equation discretizing a 2D domain, the equation is split in parts parallel and vertical to the plane of the domain similar to the waveguide model described in61.
The resulting boundary-value problem described in41 is solved using the open-source software NGSolve62. For the parallel part of the electric field Nédélec elements of third order are used, the vertical part is approximated by Lagrange elements of the same order61.
The far-field is calculated along a line placed closely above the sphere (see red dashed line in Fig. 2). With respect to periodic structures, the far-field is calculated by Fourier series expansion of the electric field obtained along this line63.
Furthermore, the simulation is repeated for a discrete number of incidence angles representing a 3D cone of incident light rays restricted by the NA of the objective lenses. A detailed description of the modeling of the scattering as well as the imaging process in the interference microscope is given in a previous publication41.
It should be mentioned, that usually spheres are used for measurements2,6,7,10−12,64, since microcylinders generate resolution enhancement in one dimension only. On the other hand, the field of view of the area magnified by the cylinder is only restricted in one dimension. However, also microcylinders realized by chemically etched fibers3,65−67 or spider silk8 are shown to improve the lateral resolution capabilities of an optical microscope. In simulations commonly microcylinders are considered10,12,23,68−71, since the computational effort is drastically reduced for surface structures, which are invariant under translation in one direction (here
$ y $ -direction). Further, the general effects leading to resolution enhancement are expected to be the same for microspheres and -cylinders. This study shows CSI simulations, where FEM near-field calculations need to be repeated for discrete angles of incidence considered by the NA of the objective lenses41. Due to the incoherent illumination, the intensities related to different angles of incidence and not the electric fields superimpose and thus, the superimposition cannot be considered before the FEM calculation. Hence, the presented approach considers microcylinders, but is also applicable for 3D microspheres at the cost of an increased computational burden. In addition, the approach to study the resolution limit of microcylinders presented in the following is applicable to microspheres in the same manner although the obtained resolution criteria for microcylinders probably cannot be exactly applied to those of microspheres. -
Fig. 3 displays extracts of simulated fields in the range of the sphere obtained for vertically incident plane waves with wavelength
$ \lambda=440 $ nm (Fig. 3a, c, d) and$ \lambda=480.76 $ nm (Fig. 3b). In case of$ \lambda=480.76 $ nm the refractive index is assumed to be$ n=4.4172+0.086546{\rm{i}} $ for silicon and$ n=0.74206+5.8235{\rm{i}} $ for aluminum58. Fig. 3 shows the intensity$ I\sim| {E}|^2 $ of the total electric field$ {E}= {E}_{\rm{in}}+ {E}_{\rm{s}} $ , which is given by the sum of the incident field$ {E}_{\rm{in}} $ and the scattered field$ {E}_{\rm{s}} $ . The period length$ l_x $ of the sinusoidal silicon grating in Fig. 3a, b equals 300 nm. Besides slightly different wavelengths, Fig. 3a, b differ in the intensity distribution inside the microsphere. In contrast to an illuminating wavelength of$ \lambda=440 $ nm (Fig. 3a), a WGM occurs for$ \lambda=480.76 $ nm in Fig. 3b at the boundaries of the sphere19,72,73. Due to the WGM, also the fields close to the surface profile differ. Since WGMs are frequently mentioned as the reason of the super-resolution effect15,19,38, we compare results obtained for both of the presented wavelengths with respect to the observed resolution enhancement. It should be noted that the field inside the sphere is given by the superposition of the incident field and the field reflected or scattered by the surface. Hence, the WGM does not appear as significant as expected for an excitation by point-sources and it is further influenced by the interaction with the surface.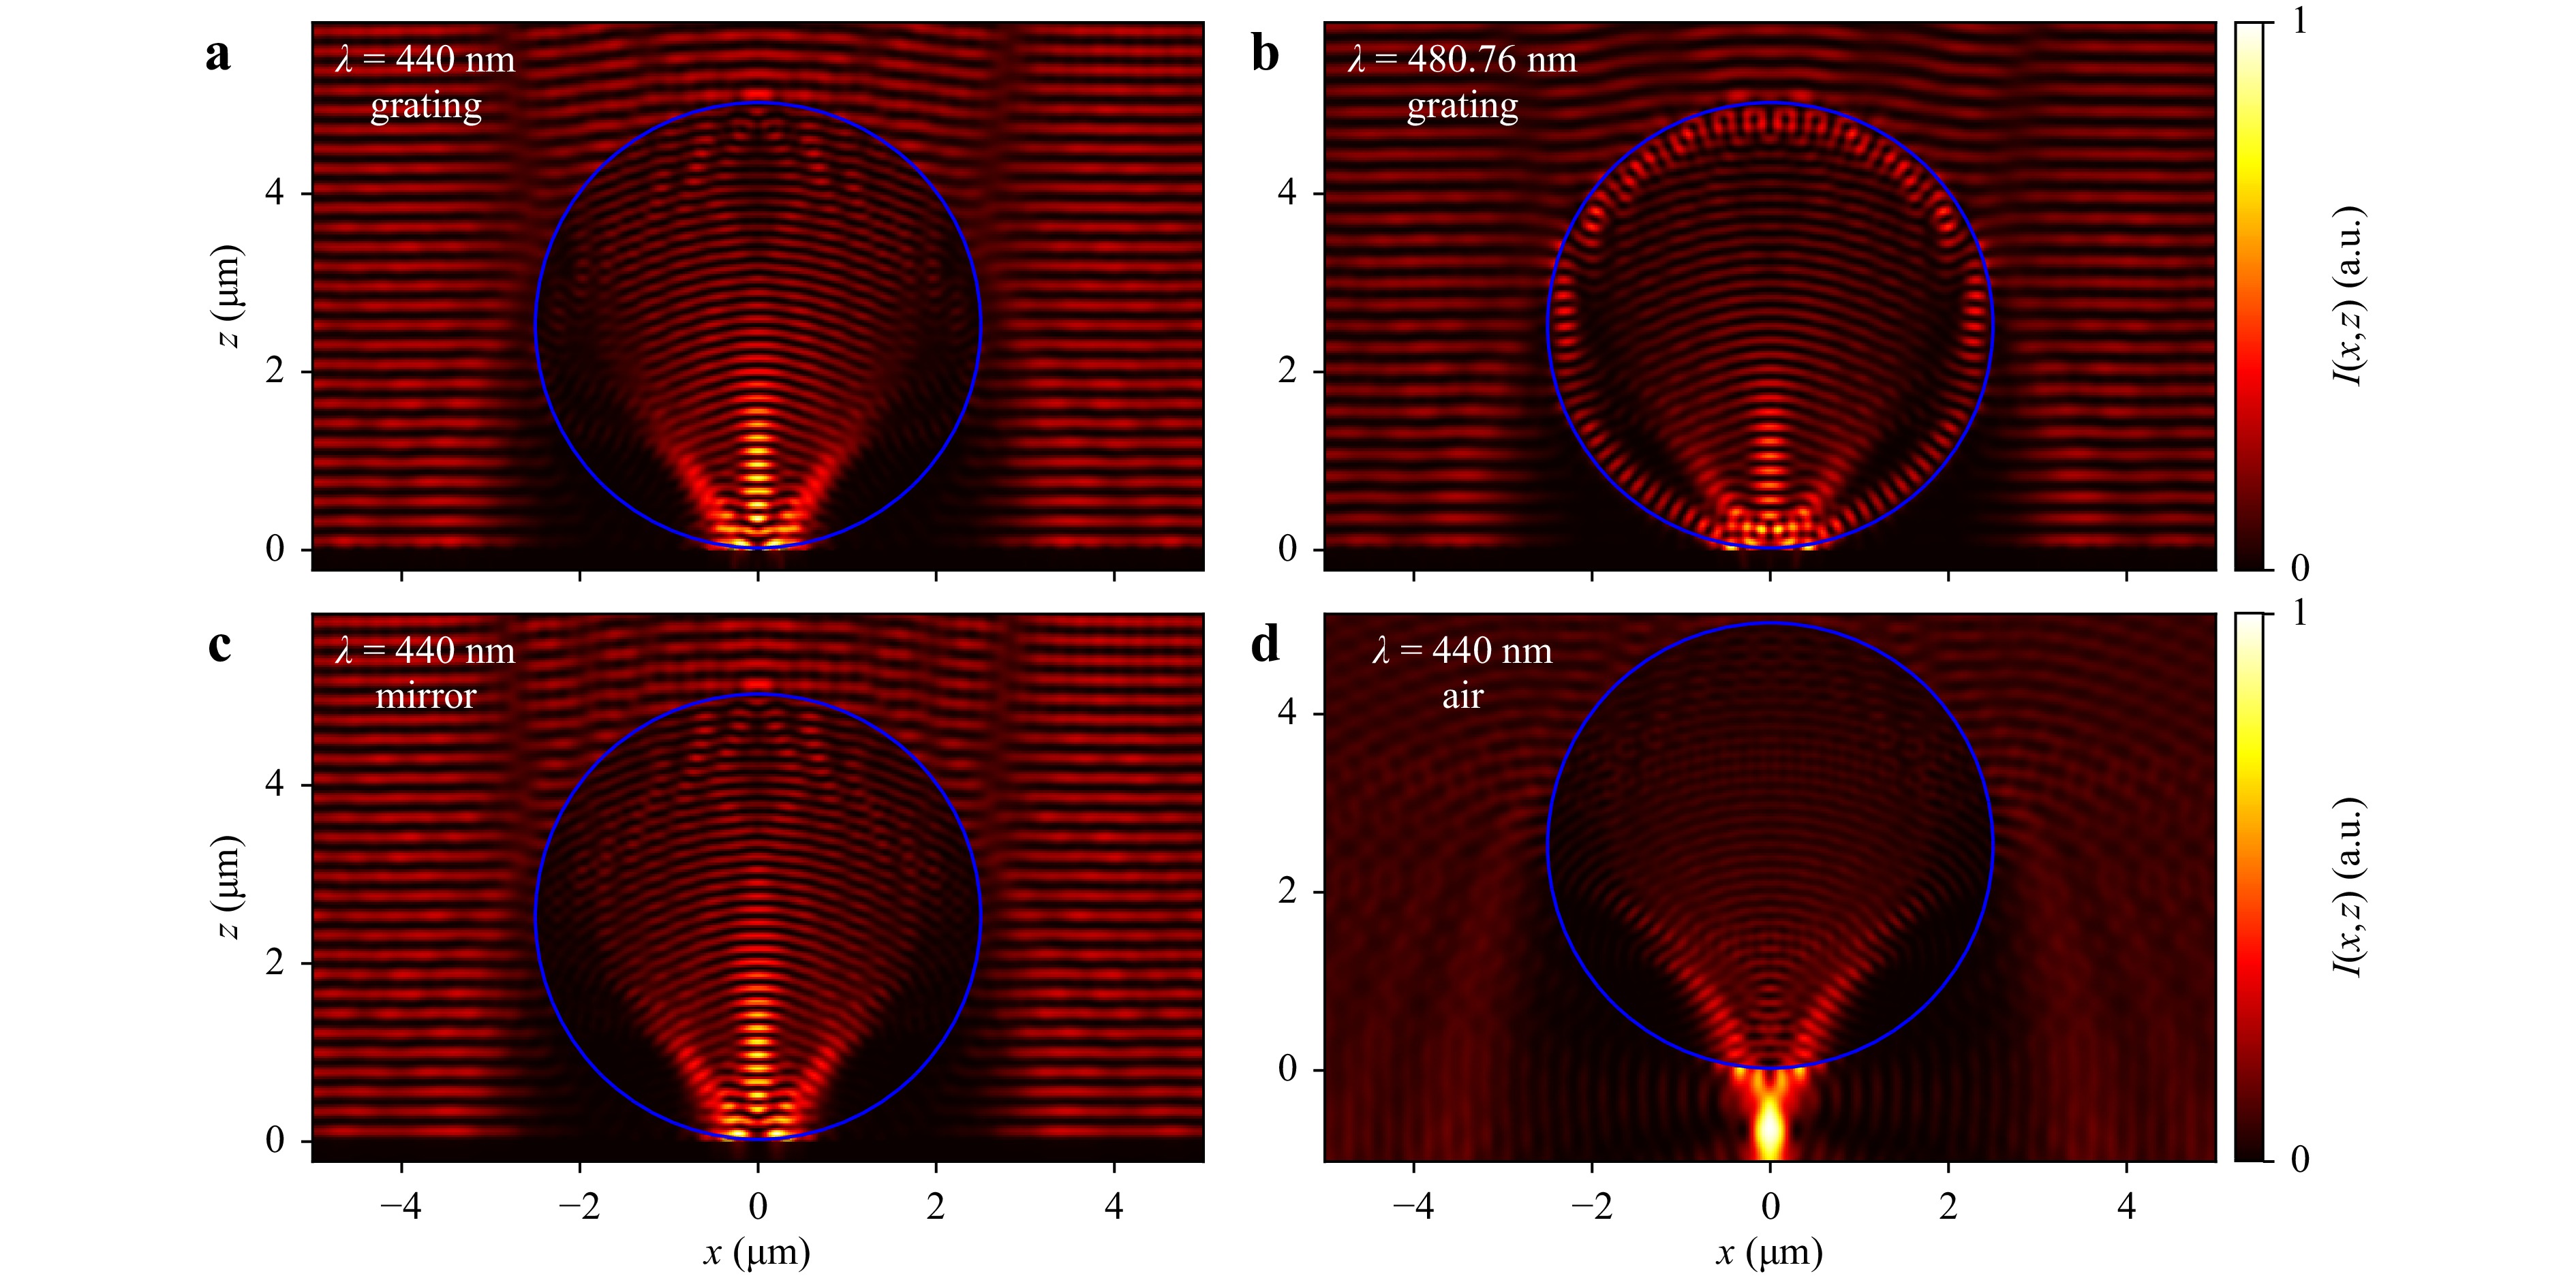
Fig. 3 Simulated intensities in the area in and around the sphere for a TM-polarized plane incident wave with wavelength
$ \lambda=440 $ nm (a, c, d) and$ \lambda=480.76 $ nm (b) assuming a microcylinder of$ r=2.5 $ μm with refractive index$ n=1.5 $ . The microcylinder marked by the blue circle is placed on a sinusoidal grating with period length$ l_x=300 $ nm and peak-to-valley amplitude of$ h=25 $ nm (a, b), a plane dielectric surface (mirror) (c) and floating in air (d). The plot shows the intensity of the total field, which is given by the sum of the incident field and the scattered field. The configuration is assumed to be periodic with a period length of 13.2 μm. For$ \lambda=480.76 $ nm a WGM appears. In air a photonic nanojet occurs under the microcylinder.Fig. 3c presents the intensity obtained from a plane dielectric surface of the same material (for simplicity marked as ‘mirror’ in the figure) for
$ \lambda=440 $ nm. Comparing Figs. 3a, c no significant differences are apparent leading to the conclusion that the conversion of evanescent to propagating waves is negligible as expected, due to the small amplitude of the grating profile. If the propagation of evanescent waves generated by the grating would be enhanced by the microsphere, a more significant difference in the intensity distribution is to be expected. In both figures, three intensity maxima under different angles are visible. Since Fig. 3c is related to a plane dielectric surface, these maxima are not due to the grating structure.Fig. 3d shows the intensity obtained from a sphere floating in air. Here, the two outer of the aforementioned three intensity maxima still occur. Hence, these maxima follow from illumination and internal reflection at the sphere and not from reflection at the object under the sphere. Furthermore, an intensity maximum known as photonic nanojet14 appears under the sphere. A recent review of photonic nanojets and their applications can be found in74. Since the PNJ occurs approximately 1 μm below the bottom of the sphere for given parameters, it will not exist anymore if the sphere is placed directly on the object’s surface.
Computing scattered fields similar to those shown in Fig. 3 for discrete angles of incidence within a cone limited by
$ 0\leq \varphi_{\rm{in}}\leq 2\pi $ and$ 0\leq\theta_{\rm{in}}\leq \arcsin({\rm{NA}}) $ , where 57 discrete azimuth angles$ \varphi_{\rm{in}} $ and 29 discrete polar angles$ \theta_{\rm{in}} $ with respect to the optical axis are used, and simulating the imaging process in a Linnik interferometer according to41, interference signals also known as interferograms, which are similar to those detected by a camera in reality, result.Fig. 4 shows extracts of simulated interferograms obtained from a plane dielectric surface (Fig. 4a), a sinusoidal grating with
$ l_x=300 $ nm (Fig. 4b) and an inverted sinusoidal grating of the same period (Fig. 4c). It should be noted that the interference component of the intensity is shown and, thus, negative intensity values occur. In all three cases, the focal plane of the sphere, i.e. the plane where the maximum interference contrast appears, is shifted in positive$ z $ -direction by approximately$ 2.5 $ -$ 3 $ μm compared to the virtual image plane sketched in Fig. 1 and marked by the black dashed line in Fig. 4a. It is a well known effect that the virtual image plane differs from the object plane shifted by the sphere11,12. The interference signals show an envelope, which occurs due to the high NA of the objective lenses (also known as longitudinal spatial coherence75). In general, the simulated interferograms show good agreement with measured signals published by Hüser et al.43,76.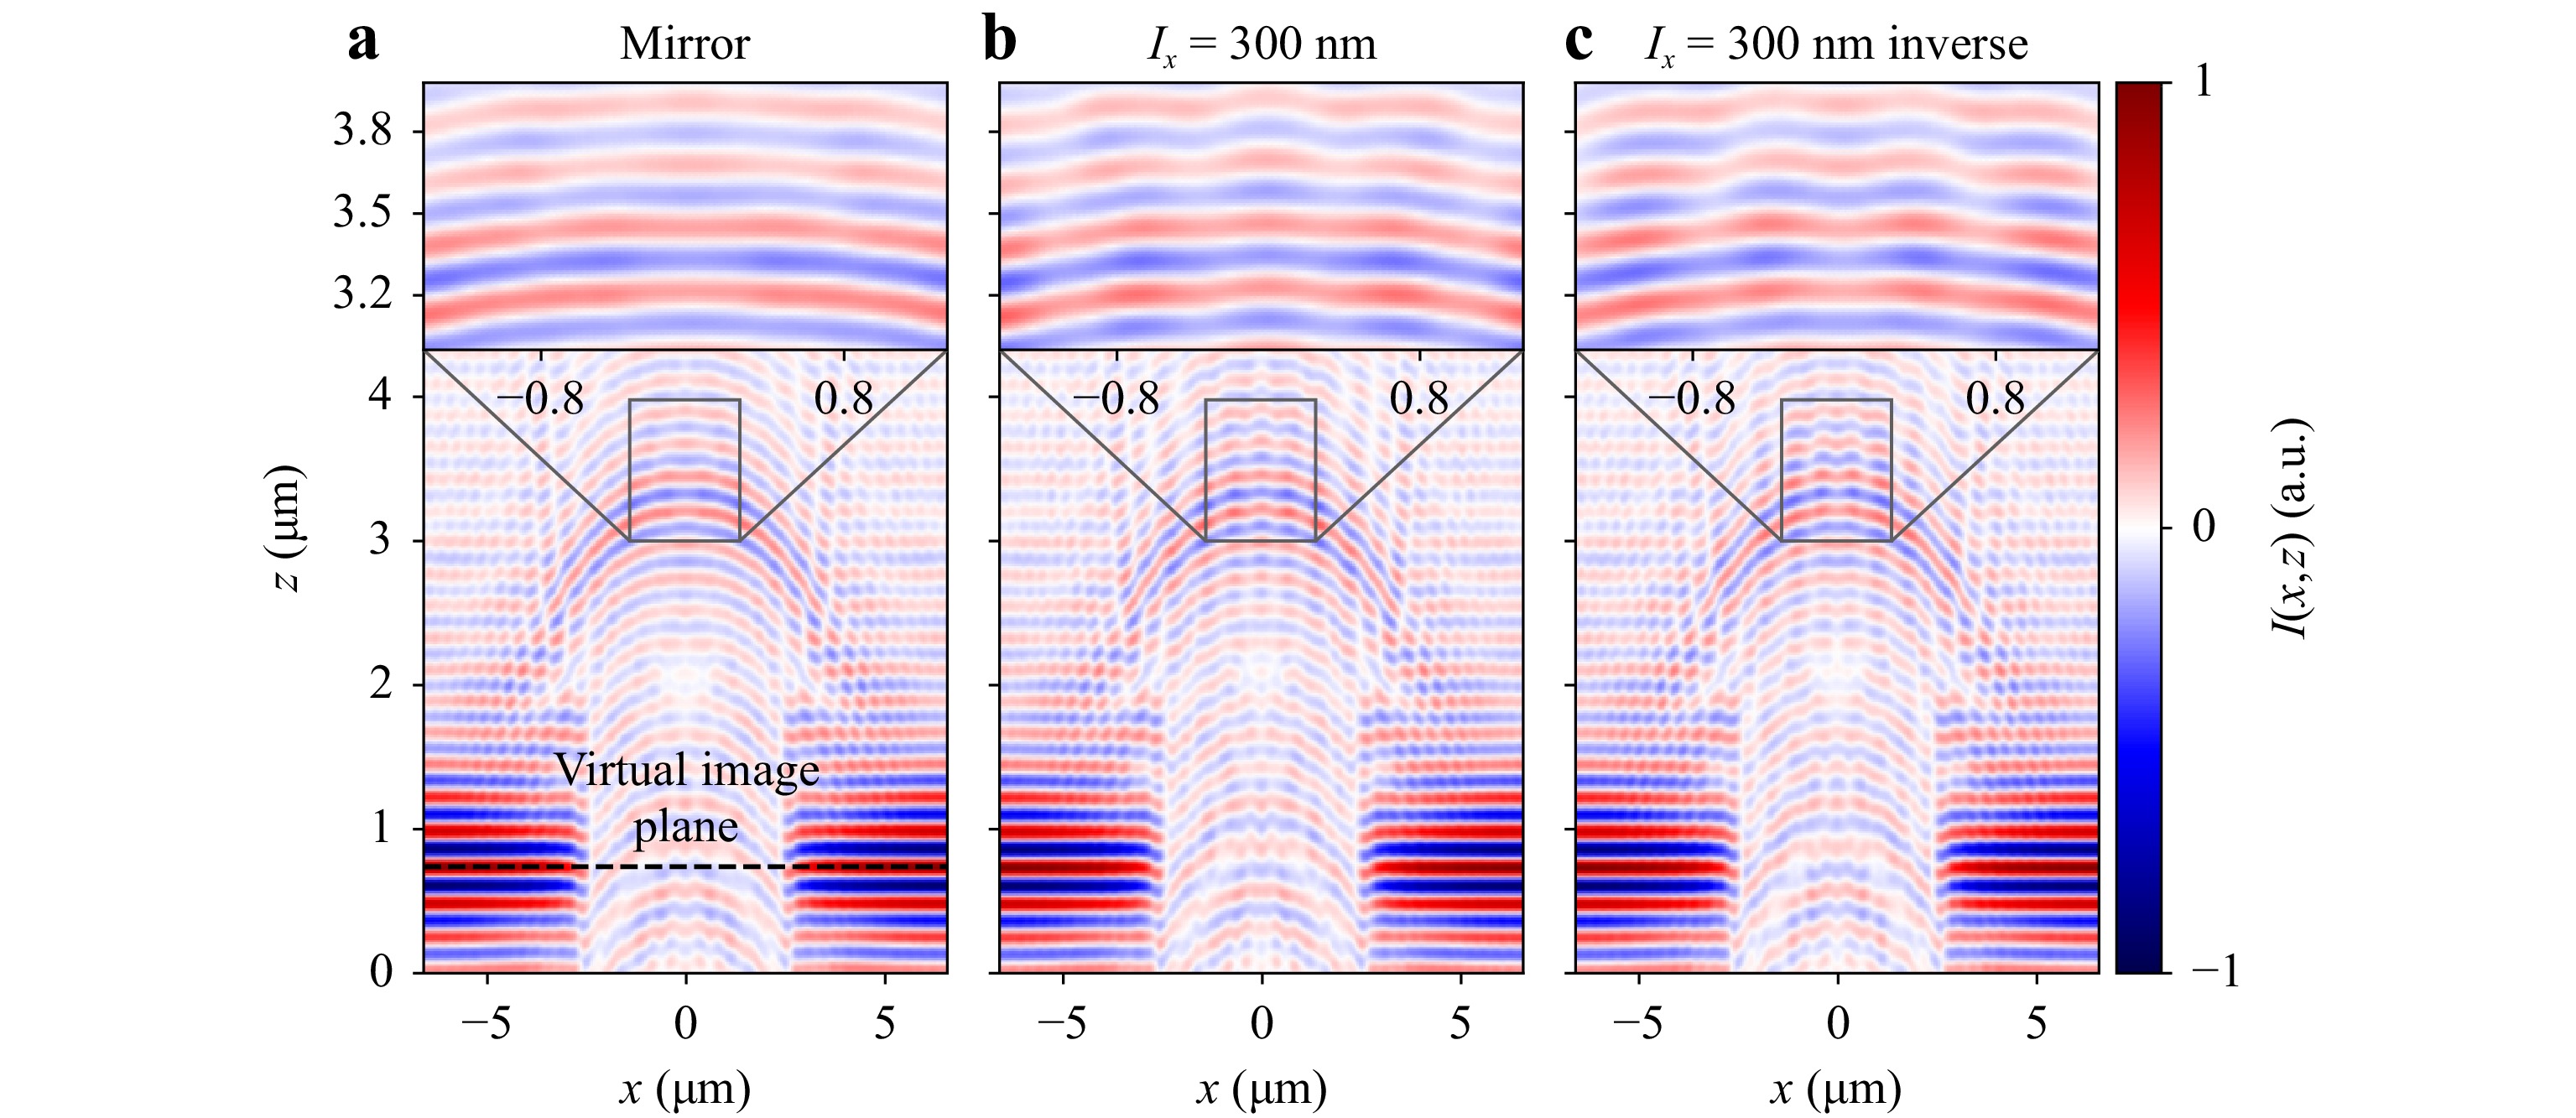
Fig. 4 Extract of interferograms obtained from (a) a plane dielectric surface (mirror), (b) a sinusoidal grating with period length
$ l_x=300 $ nm and (c) the same grating structure of (b) laterally shifted by$ l_x/2 $ corresponding to an inversion. The interferograms are simulated for TM-polarized light of wavelength$ \lambda=440 $ nm and NA=0.9. The black dashed line in (a) indicates the virtual image plane.In the magnified area in Fig. 4b, c, the grating structure can be seen as a phase modulation of the interference signals. Comparing the two subfigures, the phase modulation seems to be inverted (shifted by
$ \pi $ ) in Fig. 4c in contrast to Fig. 4b. Therefore, the phase changes in the interferograms from the surface section under the sphere result from the grating profile. The simulated interferograms can be evaluated by conventional CSI signal processing. In our case, height values are found by envelope and phase detection77,78. In the following a numerical approach to analyze the lateral resolution capabilities of microsphere-assisted interferometer is explained.Fig. 5a presents an interferogram obtained for an NA of 0.52, an illumination wavelength of
$ \lambda=440 $ nm and$ l_x=300 $ nm. Compared to Fig. 4 the envelope of the interferogram is broadened and shows clearer side lobes in$ z $ -direction in the areas besides the sphere. This effect can be simply explained by the lower NA value compared to$ {\rm{NA}}=0.9 $ in Fig. 4. The evaluation is performed over an area under the sphere centered around the focal plane of the sphere as marked by the rectangle in Fig. 5a.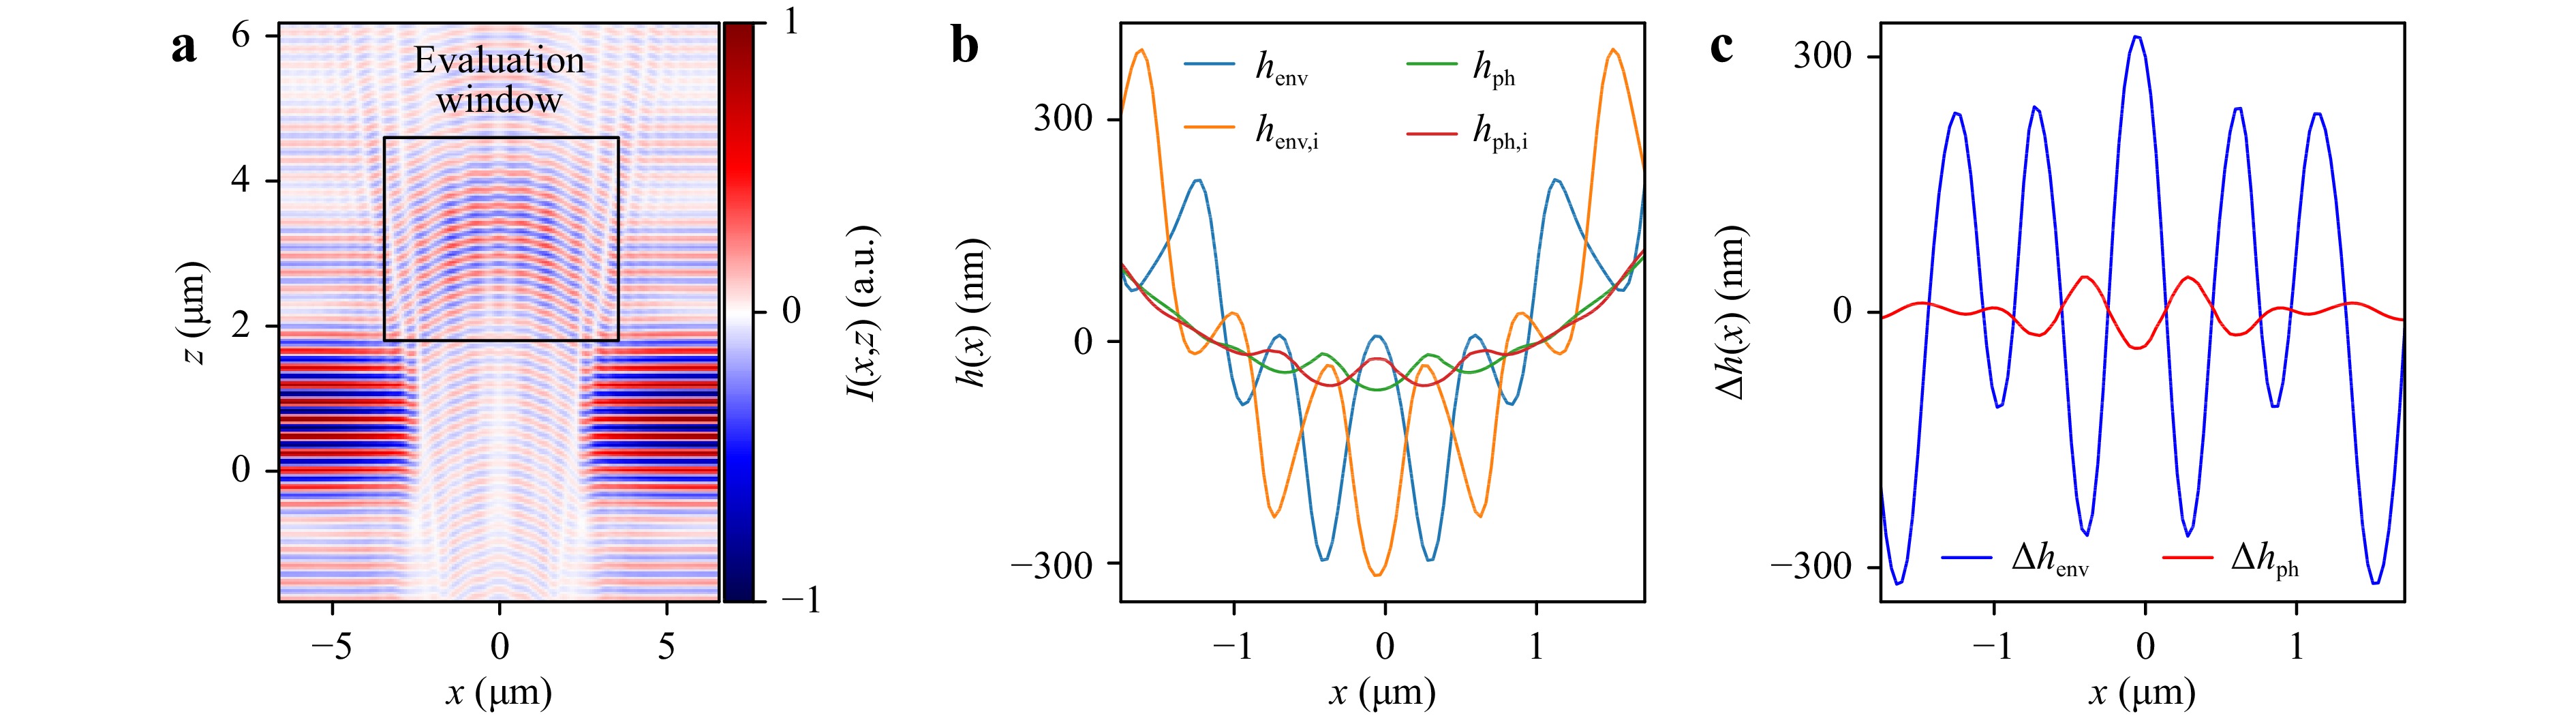
Fig. 5 Extract of an interferogram simulated with
$ l_x=300 $ nm,$ {\rm{NA}}=0.52 $ and$ \lambda=440 $ nm (a). The area, which is evaluated by envelope (env) and phase (ph) evaluation is marked by the black rectangle. Phase and envelope profiles obtained from the presented interferogram as well as an interferogram of the inverted grating (indicated by i) are displayed in (b). The differences$ \Delta h $ between the profiles according to (b) are presented in (c). The standard deviation of$ \Delta h $ is used in order to analyze the resolution limit.In order to find an evidence that profiles are resolved according to the Abbe limit as described in Common definitions of resolution and classification of this work, interference patterns are calculated for a sinusoidal grating profile and its inverse similar to Fig. 4b, c. Envelope and phase evaluation of the interferograms of the grating and the inverted grating structure result in the profiles displayed in Fig. 5b. In the following the result of envelope evaluation is named envelope profile
$ h_{\rm{env}} $ , the phase evaluation result is called phase profile$ h_{\rm{ph}} $ .In both, the envelope and the phase profiles, the grating profile under the sphere is clearly resolved, although
$ l_x=300 $ nm is well below the maximum resolvable period length$ l_{x,{\rm{Abbe}}}> 423 $ nm according to the Abbe resolution limit calculated for the NA value of 0.52 considering air as the surrounding medium. Hence, the microcylinder enhances the lateral resolution.It should be noted that in case of SILs4 the maximum achievable resolution would be improved to
$ \lambda/2n $ considering the refractive index$ n $ of the SIL. Hence, the resolution limit using an ideal SIL should be well below 300 nm. Nonetheless, in case of SILs, which are based on evanescent wave coupling, the SIL must be pressed on the objects surface, what is only given for a negligible small area under the sphere in our setup and for phase objects generally hard to implement. Furthermore, as it is shown in Fig. 6b in the next section, the resolution is still enhanced for a distance of 500 nm between the sphere and the objects surface. Additionally, simulation results show that the observed lateral resolution limit is not significantly influenced changing the refractive index of the sphere between$ n=1.4 $ and$ n=1.6 $ . Therefore, a microsphere cannot be considered similar to an SIL and thus we analyze the resolution enhancement with respect to the resolution limit with air as the surrounding medium for$ n=1.5 $ . A comparison between SILs and microspheres is given by Darafsheh et al.79.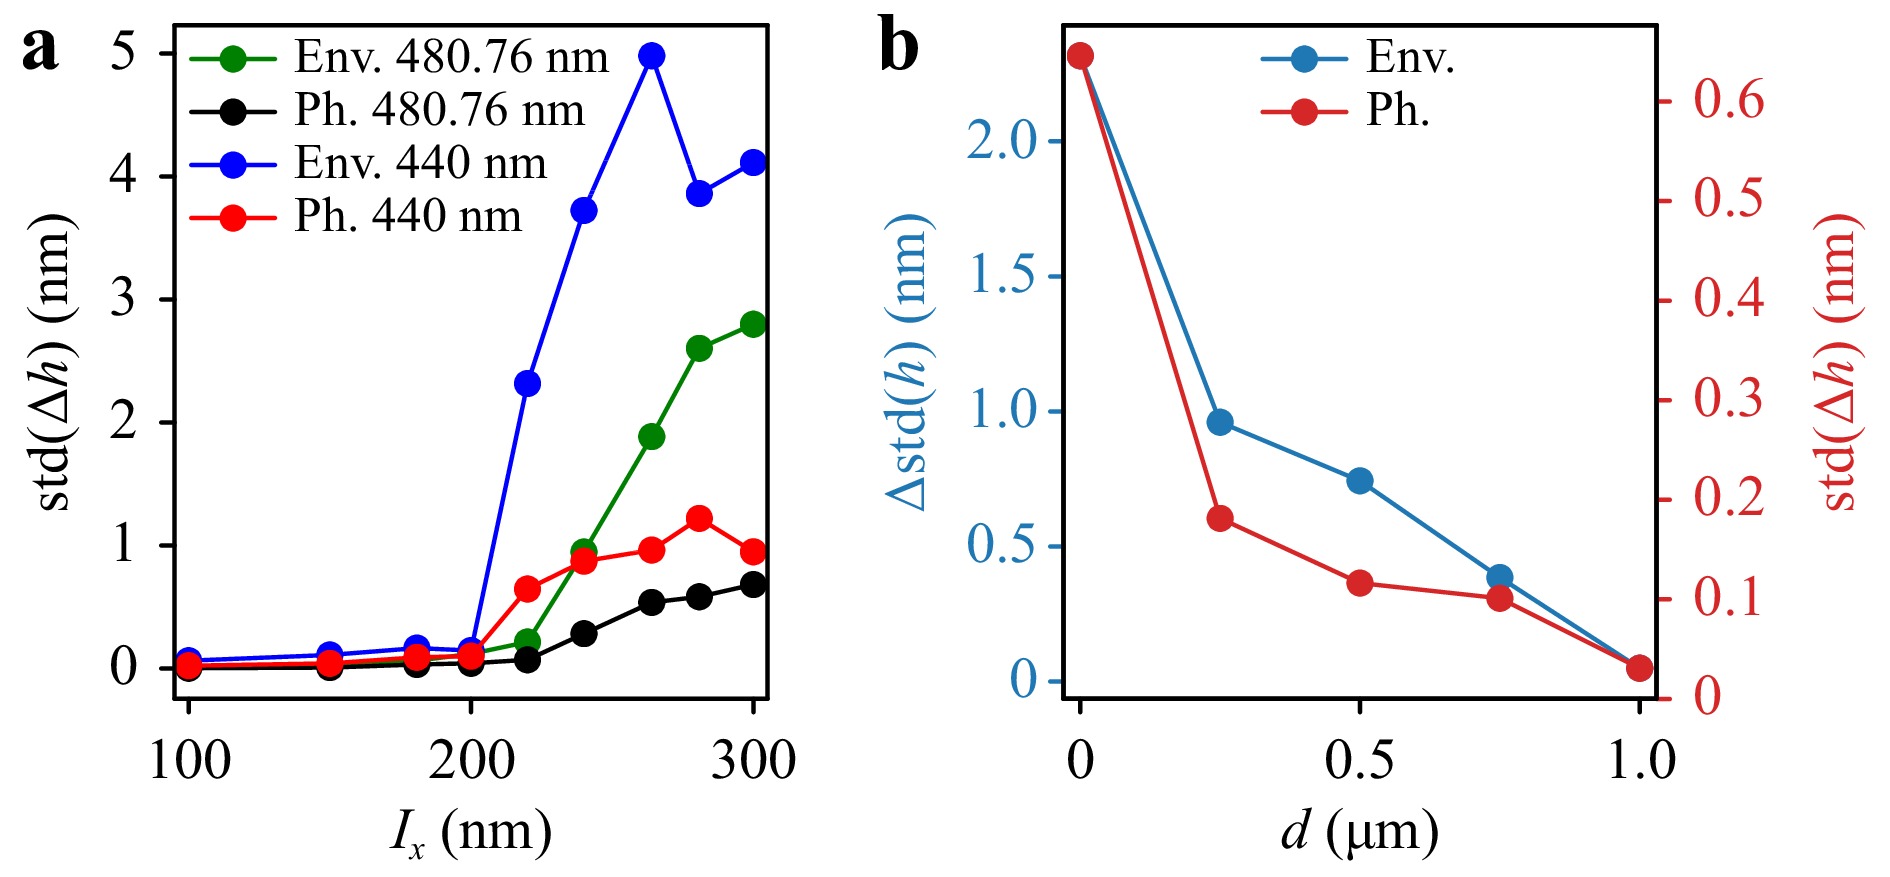
Fig. 6 Standard deviation of
$ \Delta h $ (exemplary shown in Fig. 5c) as a function of the period length$ l_x $ for two different wavelengths$ \lambda=440 $ nm and$ \lambda=480.76 $ nm, hence with and without WGM (a). std is calculated from envelope (Env.) as well as phase (Ph.) analysis. For phase analysis the evaluation wavelengths$ \lambda_{\rm{eval}}=650 $ nm and$ \lambda_{\rm{eval}}=690 $ nm, respectively, are used. The axial distance$ d $ between the sphere and the highest point of the profile is varied for$ \lambda=440 $ nm and$ l_x=220 $ nm in (b).Further, the period length is magnified by a factor of approximately two. The amplitude of the envelope profiles in the area under the sphere significantly increases by a factor larger than 10 compared to the real profile, the height of the phase profile approximately corresponds to the nominal height of 25 nm (see Fig. 5b). Such an increased amplitude in the envelope profile can be observed for sinusoidal shaped profiles in other CSI measurements and simulations without microspheres, too41. In addition, in Fig. 5b the envelope and the phase profiles are inverted with respect to each other. This behavior can be explained by the transfer characteristics of the measurement instrument (in this case including the sphere) as shown for standard CSI measurements by Lehmann et al.49.
The height profiles
$ h(x) $ ,$ h_{\rm{i}}(x) $ of the grating and the inverse grating are subtracted from each other and depicted in Fig. 5c after the constant offset was subtracted. Thus, the difference$ \Delta h(x)=h(x)-h_{\rm{i}}(x) $ of the height profiles is mainly influenced by the grating structure and hence, the standard deviation$$ {\rm{std}}=\frac{1}{N-1}\sum\limits_{j=1}^{N}\Delta h(x_j) $$ (1) is used as a quantity for the resolution, where
$ N $ is the number of evaluated pixels and$ x_j $ the$ x $ -value assigned to the$ j $ th pixel. If the grating is not resolved by the interferometer system,$ \Delta h(x)=0 $ and hence$ {\rm{std}}=0 $ is expected. In the following this approach is used in order to analyze the influence of the wavelength, the distance between sphere and surface as well as the NA on the resolution enhancement. -
Fig. 6a shows the standard deviation std
$ (\Delta h) $ of the differences$ \Delta h(x) $ according to Eq. (1) of calculated height values obtained from a grating and its inverse (see Fig. 5c) as a function of the period length$ l_x $ . Therefore, each point shown in Fig. 6a is computed by the approach presented in Fig. 5.$ {\rm{std}}(\Delta h) $ is calculated from envelope and phase profiles for the wavelengths$ \lambda=440 $ nm and$ \lambda=480.76 $ nm, respectively. Thus, results are obtained for one wavelength exciting a WGM and another, which does not, as shown exemplary in Fig. 3. In both cases, the envelope profile shows higher amplitudes compared to the phase profile, what is consistent to the result shown in Fig. 5b, c. As expected,$ {\rm{std}}(\Delta h(x)) $ decreases with smaller period length for both wavelengths and evaluation methods. If no information about the grating profile is captured by the objective lens, the results for a grating and its inverse do not differ and thus$ {\rm{std}}(\Delta h)=0 $ . Hence, the grating can be seen as resolved with regard to the Abbe limit for$ {\rm{std}}(\Delta h)>0 $ .For longer period lengths and
$ \lambda=440 $ nm the std value does not continuously decrease with decreasing period length. This can be explained with regard to Fig. 5c. For every period length the std is calculated considering the same$ x $ -range and thus a varying number of periods. Further, the observed amplitude changes along the$ x $ -axis. Therefore, the determined std value is affected by the chosen$ x $ -range depending on the period length and light wavelength. However, we are not interested in the amount of the std value but in the resolution limit, which is independent of the$ x $ -range.Comparing the results for
$ \lambda=440 $ nm and$ \lambda=480.76 $ nm, the curves, and therewith the lateral resolution limits, are shifted by approximately 20 nm, what corresponds to half the difference of the wavelengths. Therefore, the resolution limit is not considerably improved using incident light exciting a WGM in this case leading to the conclusion that WGMs are not the major effect responsible for the resolution enhancement as proposed in previous speculative discussions3,15,19,38. Nonetheless, for both wavelengths the resolution limit seems to be significantly better compared to the lateral Abbe resolution limit calculated for the corresponding wavelength. In case of$ \lambda=440 $ nm, the obtained lateral resolution limit is somewhere in the range of$ l_x=200 $ nm. For comparison, the lateral resolution limit according to Abbe would be given by$ l_x=244 $ nm for$ \lambda=440 $ nm and$ {\rm{NA}}=0.9 $ .It should be mentioned that only a case study is presented and the lateral resolution probably could be further improved if optimal parameters (radius and refractive index) of the sphere and immersed high-index microspheres are being used as shown experimentally in several studies (see e.g.6,28). As a further example, Hao et al.5 show that partially immersed microspheres enhance the contrast and comparatively decrease the magnification in microscopic imaging. However, finding an ideal parameter setup is not topic of this study and the parameters used are obviously sufficient to analyze the resolution enhancement effect. Further, simulation results show that changing the radius of the sphere between 5 μm and 7 μm as well as the refractive index between 1.4 and 1.6 does not significantly affect the obtained resolution limit. Hence, in the following only the wavelength
$ \lambda=440 $ nm and the parameters given in previous sections are considered for further analyzes.Fig. 6b displays
$ {\rm{std}}(\Delta h) $ depending on the axial distance$ d $ between the highest point of the surface and the lowest point of the sphere for$ l_x=220 $ nm, which is resolved in Fig. 6a for$ d=0 $ . Thus, the distance between sphere and surface is increased with larger values of$ d $ . According to the Abbe resolution limit$ l_x=220 $ nm should not be resolved in air. In agreement to measurement results obtained by Allen et al.56 the std values decrease with increasing distance$ d $ in the envelope and phase profiles. This observation is an indicator for evanescent waves or an enhancement of the numerical aperture as the main reason for the resolution enhancement.Fig. 7 shows results similar to Fig. 6a for various numerical apertures of
$ {\rm{NA}}=0.9 $ (Fig. 7a),$ {\rm{NA}}=0.69 $ (Fig. 7b),$ {\rm{NA}}=0.52 $ (Fig. 7c),$ {\rm{NA}}=0.31 $ (Fig. 7d),$ {\rm{NA}}=0.12 $ (Fig. 7e) and$ {\rm{NA}}=0.04 $ (Fig. 7f). Hence, Fig. 7a depicts the same result shown in Fig. 6a. The bottom row of Fig. 7 only displays the phase results, as the constriction of the envelope for small NA values with monochromatic illumination is too weak to detect a maximum intensity value reliably. Note that the evaluation wavelength$ \lambda_{\rm{eval}} $ used for the phase evaluation is adjusted with respect to the numerical aperture to$ \lambda_{\rm{eval}}=650 $ nm ($ {\rm{NA}}=0.9 $ ),$ \lambda_{\rm{eval}}=600 $ nm ($ {\rm{NA}}=0.69 $ ),$ \lambda_{\rm{eval}}=550 $ nm ($ {\rm{NA}}=0.52 $ ),$ \lambda_{\rm{eval}}=520 $ nm ($ {\rm{NA}}=0.31 $ ),$ \lambda_{\rm{eval}}=500 $ nm ($ {\rm{NA}}=0.12 $ ) and$ \lambda_{\rm{eval}}=450 $ nm ($ {\rm{NA}}=0.04 $ ) since the central wavelength of interference signals increases with increasing NA values51. Comparing Fig. 7a-f, the resolution seems to be independent of the numerical aperture. Therefore, the relative resolution gain with respect to the Abbe limit clearly increases with decreasing NA values. This observation is in good agreement with experimental results obtained by Darafsheh et al.79 comparing microscopic pictures imaged by objective lenses with$ {\rm{NA}}=0.9 $ and$ {\rm{NA}}=0.4 $ . Nonetheless, especially for extremely small NA values the resolution would be expected to decrease, since the$ \pm $ 1st diffraction order needs to be captured by the objective lenses in order to resolve a grating structure.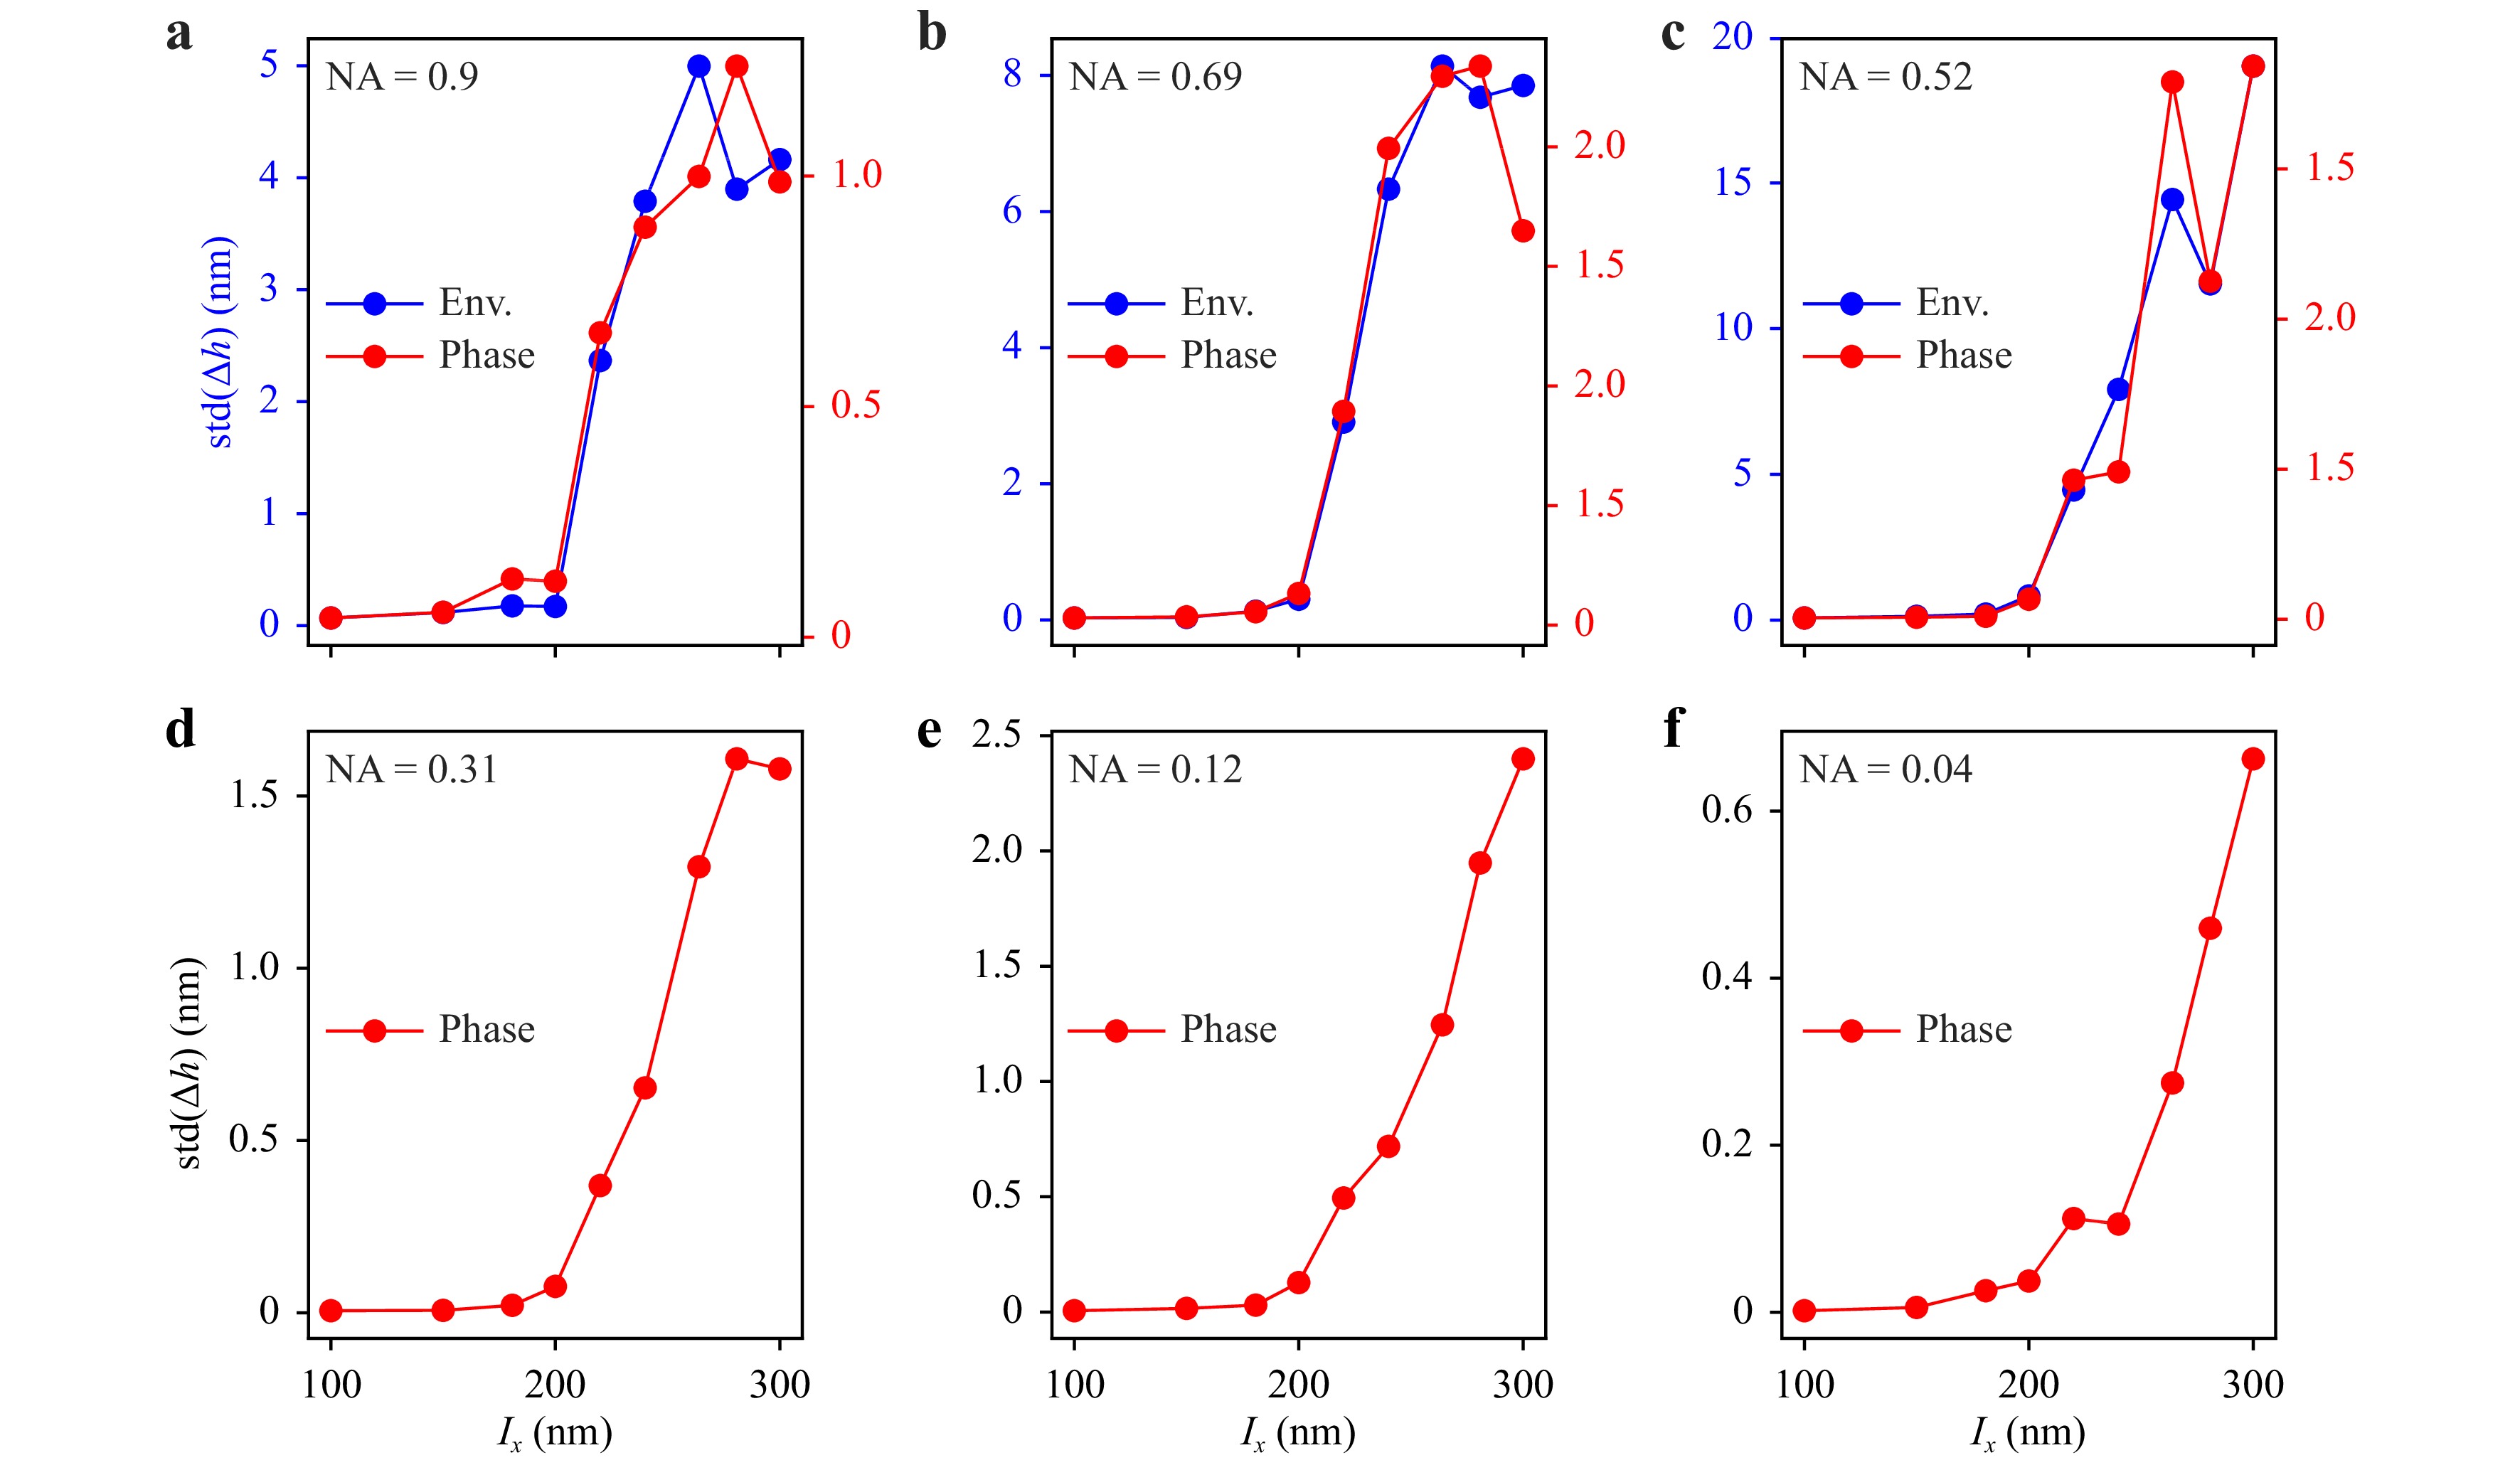
Fig. 7 Standard deviation of
$ \Delta h $ (exemplary shown in Fig. 5c) as a function of the period length$ l_x $ for NA$ =0.9 $ (a), NA$ =0.69 $ (b), NA$ =0.52 $ (c), NA$ =0.31 $ (d), NA$ =0.12 $ (e), NA$ =0.04 $ (f) and an illumination wavelength of$ \lambda=440 $ nm. The upper row (a-c) displays results for envelope (Env.) and phase profiles, the lower row (d-f) only the phase result, since the envelope is too weak to detect a maximum intensity value reliably.To investigate the unexpected small resolution limits obtained for small NA values, Fig. 8 shows the corresponding differences
$ \Delta I $ of the interference intensity signals of the 300 nm grating and the corresponding inverted grating as well as the differences of$ \Delta h $ obtained by phase evaluation for different numerical apertures. The height profiles are only considered with an$ x $ -range of$ 3.5 $ μm under the sphere as explained in Fig. 5.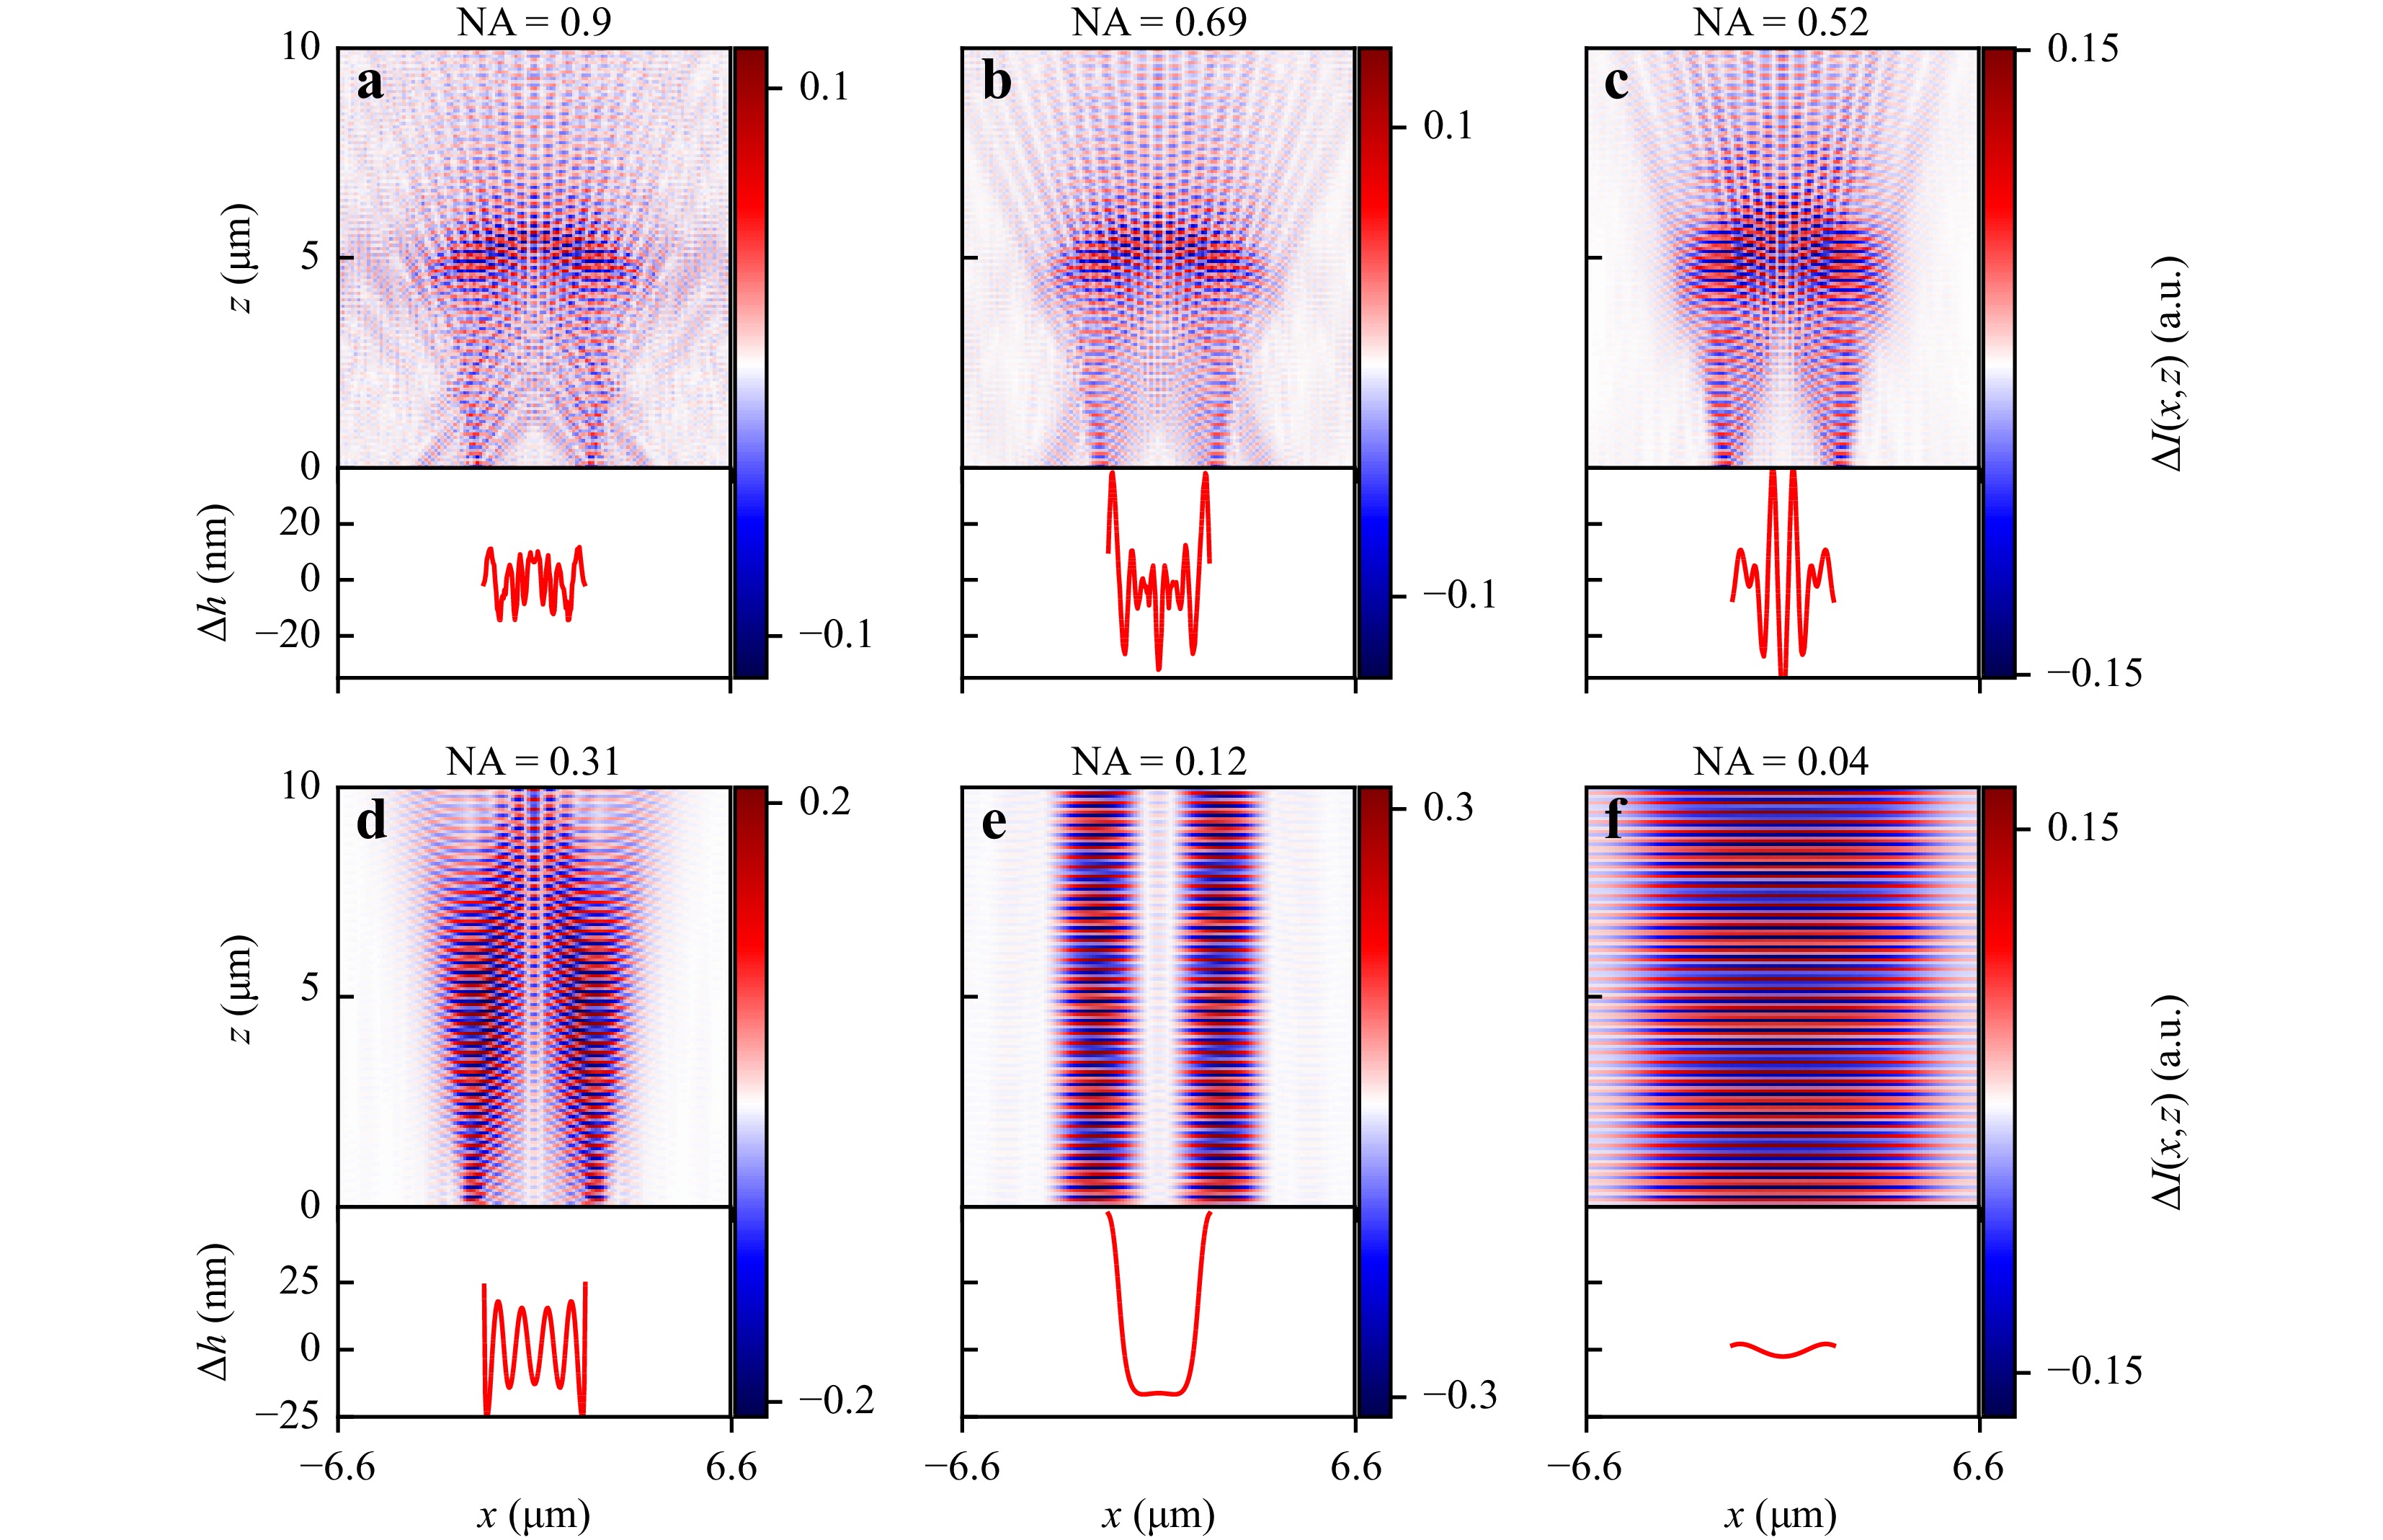
Fig. 8 Extract of the difference
$ \Delta I=I-I_{\rm{i}} $ between interferograms$ I, \;I_{\rm{i}} $ obtained from a sinusoidal grating with period length$ l_x=300 $ nm and an inverted sinusoidal grating with same period for$ {\rm{NA}}=0.9 $ (a),$ {\rm{NA}}=0.69 $ (b),$ {\rm{NA}}=0.52 $ (c),$ {\rm{NA}}=0.31 $ (d),$ {\rm{NA}}=0.12 $ (e),$ {\rm{NA}}=0.04 $ (f) and an illumination wavelength of 440 nm. Below each color plot height differences obtained by phase evaluation of extracts of$ I $ and$ I_{\rm{i}} $ are plotted. The profiles are obtained from a reduced section under the sphere as shown in Fig. 5.Obviously, the lateral magnification of the grating profile significantly increases for small NA values, what can be observed by the number of imaged grating periods in
$ \Delta I $ as well as$ \Delta h $ . Note that the considered magnification is not solely related to the imaging capabilities as for example defined by Astratov et al.35, but simply corresponds to the number of periods imaged by the whole imaging system including the microsphere, and is hence inverse to the width of the field of view.With regard to the height profiles, the observed amplitude of the grating varies significantly with the lateral position
$ x $ . Similar results can be observed for a wavelength of$ \lambda=480.76 $ nm. Thus, the results are not limited to a single wavelength, but represent a general phenomenon in microsphere-assisted measurements. Considering the height and shape of the profiles in Fig. 8,$ {\rm{NA}}=0.31 $ seems to provide the best result. The NA dependent magnification can be explained with respect to Fig. 3, where simulated fields are shown for light incident vertically. Due to the focusing effect of the sphere only a small area of the grating structure is illuminated. For higher numerical apertures the sphere is also illuminated by oblique angles of incidence leading to a lateral shift of the focal area and thus a lateral scanning of the grating structure. Therefore, for higher numerical apertures more periods are imaged compared to smaller numerical apertures resulting in a larger field of view and therewith an NA dependent magnification.The observed results lead to the conclusion, that microspheres act as additional lenses placed in the near-field increasing the effective numerical aperture locally independent of the initial NA of the objective lens. The obtained resolution limit seems to be slightly below the Sparrow limit1 which results in 207 nm for
$ \lambda=440 $ nm and$ {\rm{NA}}=1.0 $ . Since only a small area of the surface is illuminated by the sphere instead of the whole grating, the Sparrow limit can be considered in this case. Due to the small illuminated surface sections, the scattered light components belonging to the$ \pm $ 1st diffraction orders are broadened. Therefore, light related to these diffraction orders is detected although a sharp peak would not be captured. Further, the magnification strongly depends on the initial NA value of the objective lens as the illuminating spot is laterally shifted considering oblique angles of incidence, which occur for higher NA values.Although the lens effect of the microsphere and the PNJ have the same physical origin, the observed resolution enhancement is not due to PNJs since the PNJ does not appear for the analyzed parameters of the sphere and the incident wave if the surface is placed directly below the sphere as demonstrated in Fig. 3. Nevertheless, Yang et al.37 show that the imaging capability of the microsphere is related to the waist of the PNJ, although no nanojet occurs due to the object’s surface since the same optical paths are involved imaging the reflected light. However, it should be noted that the PSF is shown to be a more reliable indicator for the imaging capabilities of microspheres as resported in34.
Converting evanescent waves to propagating waves cannot be excluded completely with respect to the resolution enhancement. However, the sinusoidal phase gratings considered in this study show small amplitudes and hence the impact of evanescent waves is expected to be negligibly small. In addition, in Fig. 3 no significant difference between results obtained from a grating and a plane dielectric surface, which could indicate the detection of evanescent waves, is observed.
Therefore, a local enhancement of the numerical aperture leading to a shift of the ±1st diffraction orders to smaller spatial frequencies as explained by Hüser et al.43 seems to be the most likely effect for resolution enhancement. This assumption is in agreement with the observed resolution limit slightly below the Abbe and Sparrow limits for
$ {{\rm{NA}}=1.0} $ . -
This study presents an FEM-based numerical modeling of microsphere-enhanced CSI. Consideration of full conical illumination, focusing of 3D incident light by the microsphere, the scattering process at the surface under the microsphere as well as the propagation of the scattered field through the microsphere and the microscopic setup fills a gap in theoretical investigation of microsphere-assisted measurements. Using this model, the following major results are obtained.
● Comparing results obtained with and without WGM, WGMs cannot be attributed to resolution enhancement. The resolution is enhanced in both cases.
● The resolution limit is demonstrated to be independent of the NA of the objective lenses. Thus, with respect to the Abbe resolution limit, which decreases for larger NA values, the relative resolution enhancement increases with smaller numerical apertures.
● The lateral magnification corresponding to the number of imaged periods depends on the numerical aperture of the objective lenses. For smaller NA values the magnification increases leading to a decrease of the field of view on the other hand.
● Converting evanescent waves into propagating waves cannot be excluded from contributing to the resolution enhancement. However, propagating waves belonging to the 0th and
$ \pm $ 1st diffraction orders seem to be more likely. Thus, our results indicate that the resolution enhancement is primarily due to NA enhancement by the microsphere, which is closely related to the effect of PNJ occurring in the absence of the specimen.Furthermore, the presented approach enables to analyze parameter influences and find the most appropriate experimental setup depending on the shape, size and material of the microelement as well as surrounding material in order to improve the resolution and profile fidelity of CSI. In this work only a case study is presented to demonstrate how to analyze the fundamental resolution limit numerically and first parameter influences are investigated. Detailed parameter studies will be performed in future work.
In addition, the model can be extended to conventional microscopy, confocal microscopy and other optical profilers without great effort. Therefore, the presented model can significantly contribute to a better understanding of microsphere-assisted measurement systems and additionally improve their imaging capabilities by parameter studies.
-
The authors gratefully acknowledge the financial support of this research work by the DFG (German Research Foundation) [Grant no. LE 992/14-1, LE 992/15-1].
FEM-based modeling of microsphere-enhanced interferometry
- Light: Advanced Manufacturing 3, Article number: (2022)
- Received: 01 June 2022
- Revised: 14 October 2022
- Accepted: 15 October 2022 Published online: 28 October 2022
doi: https://doi.org/10.37188/lam.2022.049
Abstract: To improve the lateral resolution in microscopic imaging, microspheres are placed close to the object’ s surface in order to support the imaging process by optical near-field information. Although microsphere-assisted measurements are part of various recent studies, no generally accepted explanation for the effect of microspheres exists. Photonic nanojets, enhancement of the numerical aperture, whispering-gallery modes and evanescent waves are usually named reasons in context with microspheres, though none of these effects is proven to be decisive for the resolution enhancement. We present a simulation model of the complete microscopic imaging process of microsphere-enhanced interference microscopy including a rigorous treatment of the light scattering process at the surface of the specimen. The model consideres objective lenses of high numerical aperture providing 3D conical illumination and imaging. The enhanced resolution and magnification by the microsphere is analyzed with respect to the numerical aperture of the objective lenses. Further, we give a criterion for the achievable resolution and demonstrate that a local enhancement of the numerical aperture is the most likely reason for the resolution enhancement.
Research Summary
Microsphere-assisted microscopy: enhancing the lateral resolution using micro elements
In order to improve the imaging capabilities of microscopic arrangements, microelements such as microspheres and microcylinders are placed on the measurement object’s surface to increase lateral resolution. Although microelement-enhanced microscopic measurements are part of various recent studies, reasons for the resolution enhancement are mainly speculatively discussed and no generally accepted explanation exists. The authors developed a virtual microcylinder-assisted interference microscope considering the conical illumination of the microscope, the interaction of light with the microcylinder and the object’s surface as well as the imaging properties and thus reproducing measurement results reliably. Using the virtual measurement instrument a way to quantify the resolution enhancement and analyze the resolution limit is demonstrated. As a result, the local enhancement of the numerical aperture is shown to be the most realistic reason for resolution enhancement.


Rights and permissions
Open Access This article is licensed under a Creative Commons Attribution 4.0 International License, which permits use, sharing, adaptation, distribution and reproduction in any medium or format, as long as you give appropriate credit to the original author(s) and the source, provide a link to the Creative Commons license, and indicate if changes were made. The images or other third party material in this article are included in the article′s Creative Commons license, unless indicated otherwise in a credit line to the material. If material is not included in the article′s Creative Commons license and your intended use is not permitted by statutory regulation or exceeds the permitted use, you will need to obtain permission directly from the copyright holder. To view a copy of this license, visit http://creativecommons.org/licenses/by/4.0/.

 DownLoad: