


-
In order to push the performance of optical systems aspheric- and freeform surfaces with their significantly greater design flexibility are used in current state of the art optic design for correcting aberrations1-3. The production of these complex shaped surfaces requires to measure the surface deviation from the nominal design4. There are a lot of optical measurement methods, such as pointwise methods5-7, stitching methods e.g. using Fizeau interferometry8 or coherence scanning interferometric microstitching (CSIM)9 and also zonal scanning methods10-12, but the fastest methods are full-field interferometric methods. Other solutions don’t measure topography but determine the surface gradient such as shearing based measurement systems13. Direct, fast topography measurements with high precision are possible with full-field interferometric methods. They contain a reference and a measurement wavefront which interfere on a camera chip. From the phase difference between the two wavefronts the surface deviation can be calculated. Due to different beam paths vibrations and temporal environmental effects like temperature or air fluctuations have a strong influence on the uncertainty of the measurements. These effects are inherently reduced in common path interferometers14 such as the widely used Fizeau type interferometer.
Compensation optics such as computer generated holograms (CGH) are state of the art for the measurement of non-spherical optics15-19, but they require a new compensation element for each new type of surface under test (SUT). When measuring surfaces with large deviations from the reference shape, interference fringes with high fringe densities and subsequently retrace errors occur. If the deviation becomes too high, vignetting of the measurement light produces unmeasurable areas of the surface under test. This is a fundamental limit of non-nulltesting methods such as the early sub-Nyquist interferometry20 or current non-nulltesting approaches using high resolution cameras. All these effects limit the classical Fizeau interferometer when complex shaped surfaces are measured. The Tilted Wave Interferometer (TWI) was invented at the University of Stuttgart21-28 to overcome these issues. It uses a grid array of light sources for off-axis illumination of the SUT. The different sources and the common reference wavefront generate multiple sub-interferograms on the camera chip. The tilt angles of the tilted wavefronts locally compensate the effect of the gradient of the SUT. Therefore the effects of vignetting and high fringe densities can be overcome. For the treatment of retrace errors a sophisticated volume calibration and evaluation method is used to numerically subtract systematic errors29,30. One aspect of current investigation is the traceability of this flexible measurement method31.
The combination of the TWI principle with the Fizeau common path interferometer is not straight forward32. Every off axis illumination source is generating a reference wave reflected from the Fizeau surface. This leads to multiple overlapping wavefronts on the detector which basically makes the evaluation of the interferograms impossible. Up to now there is no realization of a Fizeau TWI system with multiple off axis illumination wavefronts generated by an array of light sources. There is a fiber switch based Fizeau type interferometer with switchable off-axis illumination in33, but no analysis of the influence of the multiple interference effects between sub-interferograms have been reported yet.
The realization of the new common-path Tilted Wave Fizeau Interferometer which overcomes the reference wave problem is the main contribution in this paper. It combines the robust, well established Fizeau interferometer technique with the greatly enhanced flexibility and short measurement time of tilted wave interferometry. The result is a new tool that addresses the urgent metrology needs for advanced optics fabrication.
A glimpse of the idea has been presented by Baer et al.32 and Beisswanger et al.25. Here, we carry the early idea to a thorough discussion of the new approach. This includes a detailed description of the multiple beam interference problem in the next section, followed by the mathematical description of the new calibration algorithm. In the results section a benchmark and comparison to the classical Twyman-Green TWI regarding optics tolerances and defects using numerical simulations is presented and experimental results for the measurement of a freeform and two aspheric surfaces with a comparison in phase stability and repeatability are shown. An overview over the achieved results and a discussion concludes the paper.
-
Fig. 1 compares the double-path TWI (top) to the novel TWI in common-path Fizeau configuration (bottom). In both setups the beam of a laser is expanded by a telescope (expander) to illuminate a point source array (PSA). The PSA is a monolithic, passive optical component that contains diffractive microlenses on its front side that focus the incoming light onto a pinhole array on the backside. Thus it converts the incoming plane wave into a grid of spherical wavefronts. These are collimated at the collimation lens (CL).
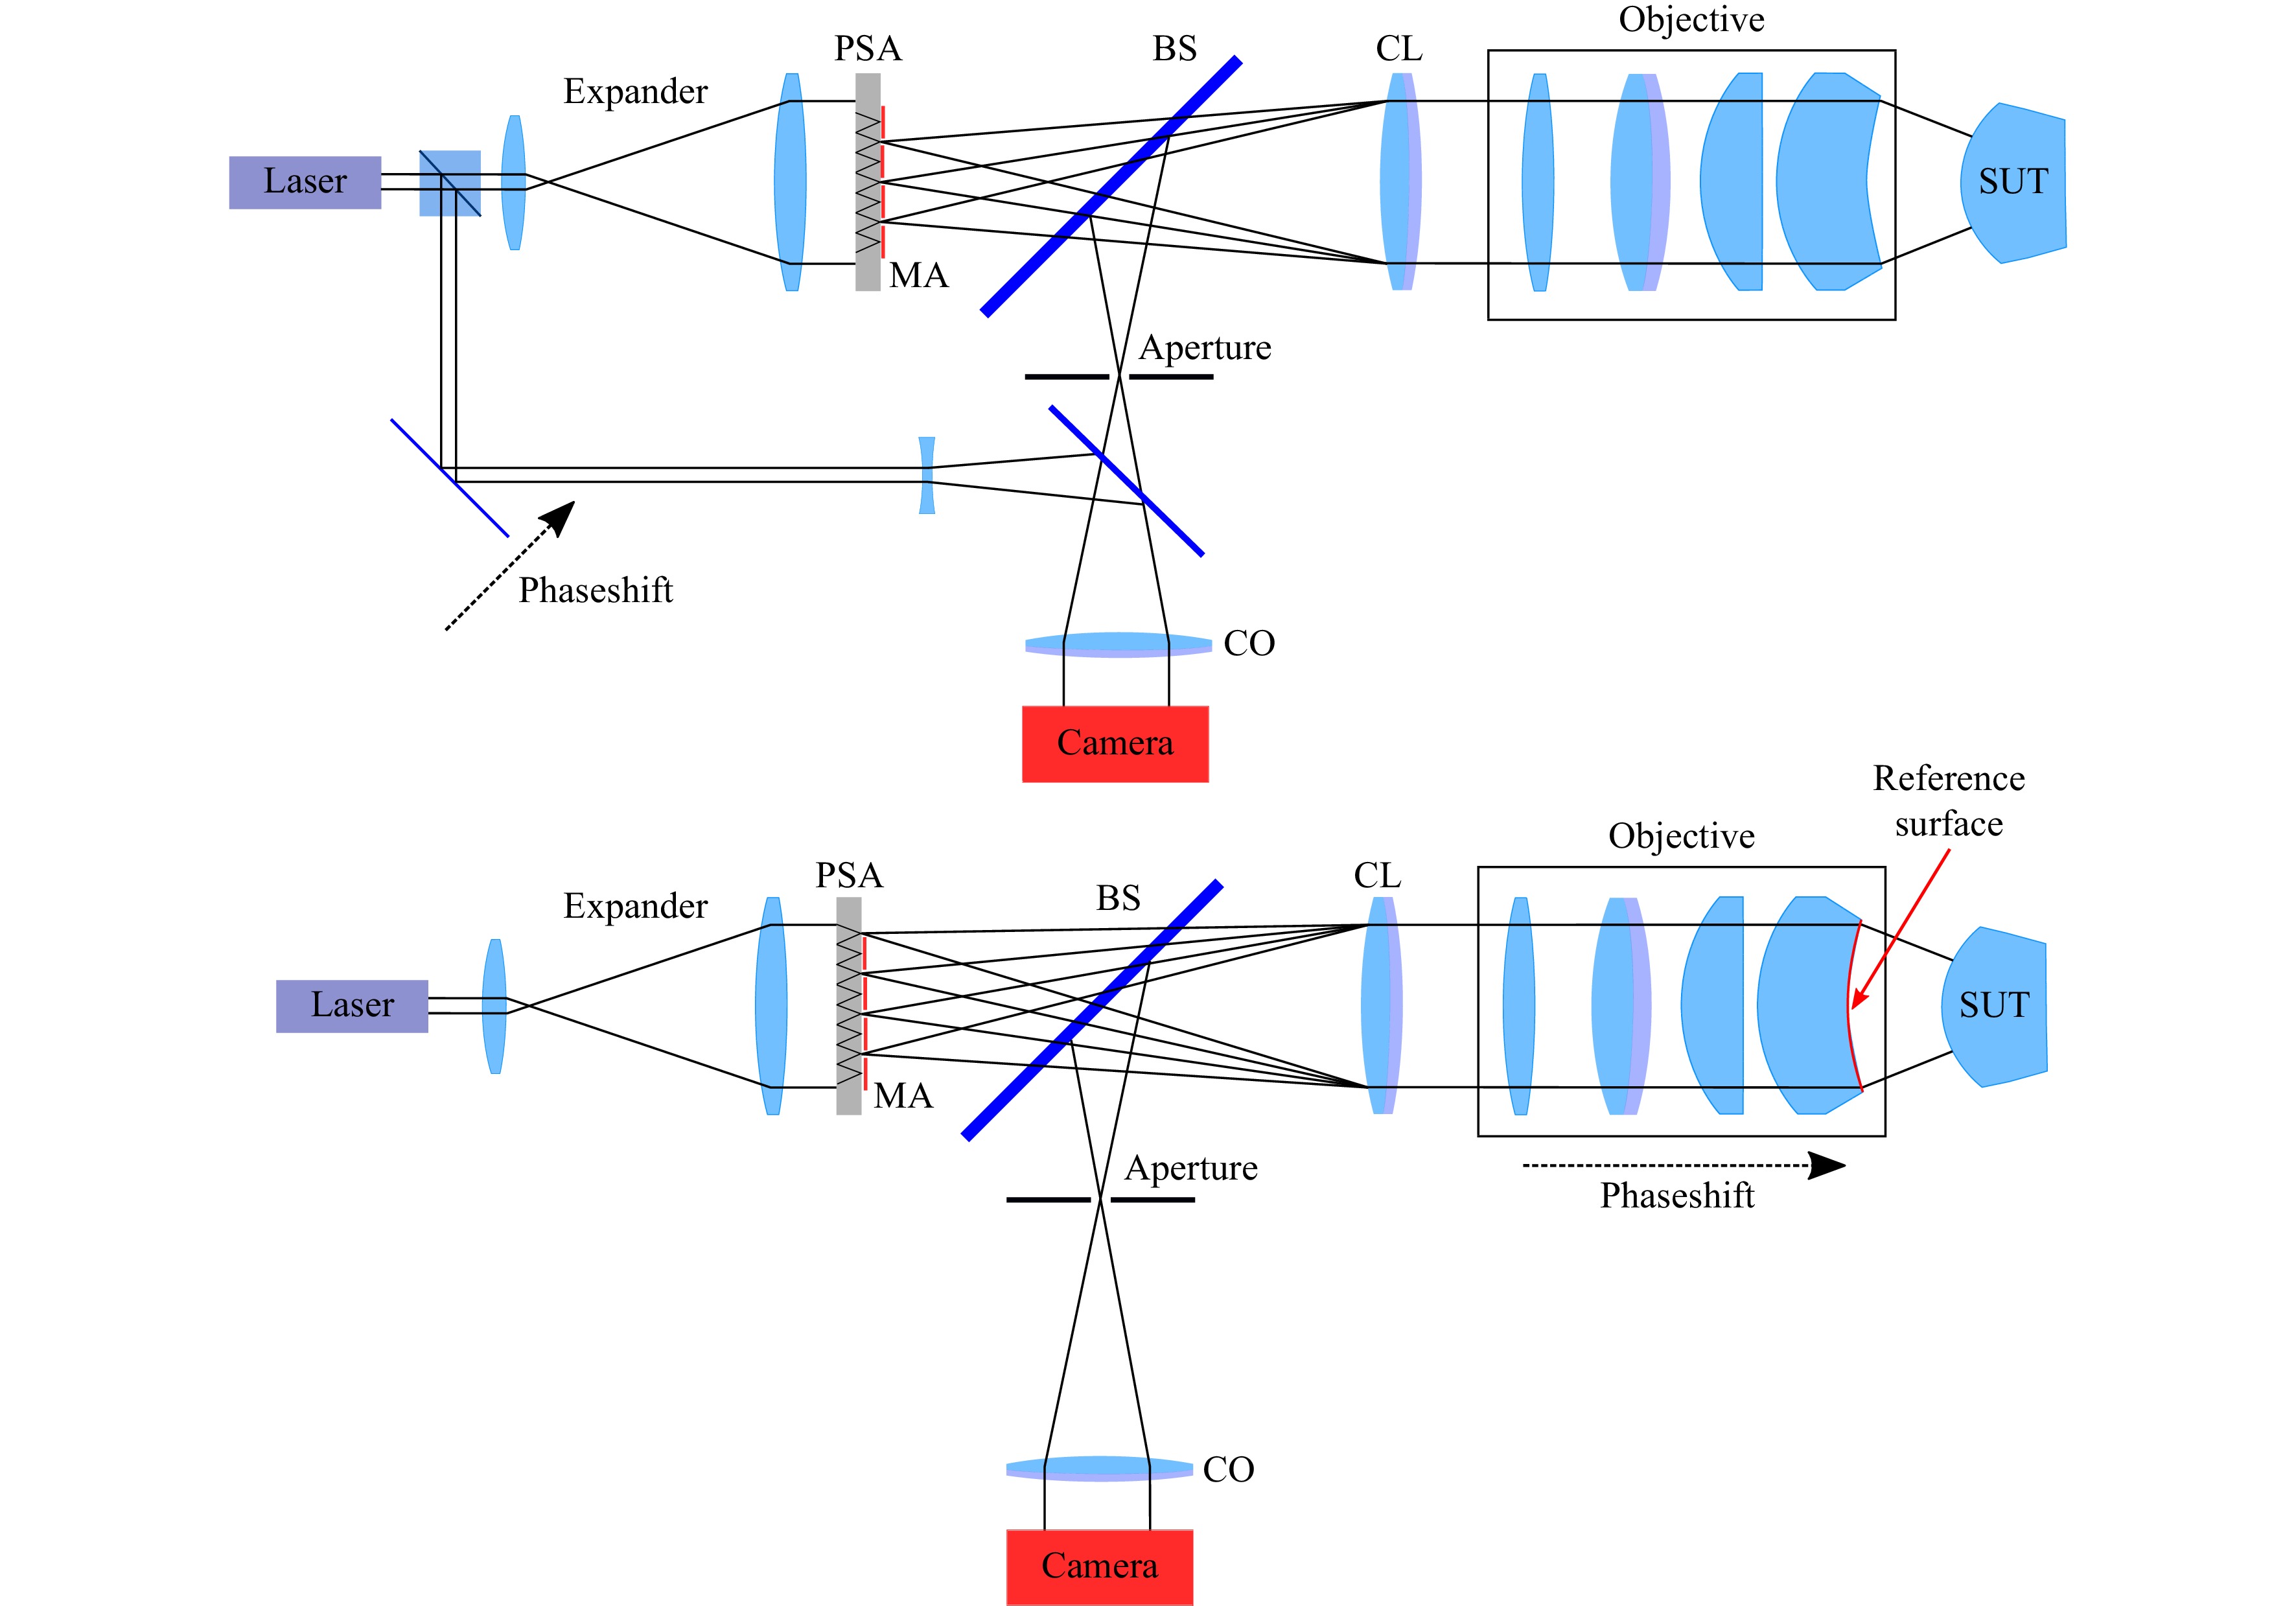
Fig. 1 Top: Classical TWI in Twyman Green configuration, the reference wave is coupled out after the laser with a beamsplitter and is directed to the camera. Below: New TWI in Fizeau configuration. The reference surface generating the common-path reference wave is highlighted.
In the novel approach depicted in the lower part of Fig. 1, the subsequent Fizeau objective, often referred to as transmission sphere, has a semitransparent last surface (Fizeau surface), which reflects a part (typically about 4%) of the incoming wavefront. This reflected wavefront serves as reference beam. The other part of the propagating light is reflected back from the SUT thus carrying the desired shape information of the SUT.
The reflected light from the SUT and the reference beam propagate via the beamsplitter (BS) and the camera objective (CO) to the chip of the camera where their interference pattern is recorded. To limit the fringe density of the interferogram below the Nyquist criteria, an aperture is placed at the front focal plane of the camera objective. In the case of a strong non-null test this limits the lateral extension of an interferogram that is produced by one single wavefront from the PSA on the chip. In the following, we refer to such a sub-interferogram as patch.
Across the SUT there are multiple patches generated by the different sources. To measure the whole SUT, the patches must cover the whole clear aperture (CA) of the SUT. Therefore, an overlap of the interferograms (patches) from different point sources occurs at least for some of the patches in practice. This is in conflict with the interpretability of overlapping interferograms.
In order to overcome this, every second row and every second column of the array of point sources is blocked by a moveable mask-array (MA), leading to measurement data without overlap, but with the requirement that the MA needs to be shifted subsequently into four different positions. The four positions are a direct consequence of the eight neighbors every point source of the PSA has in an rectangular arrangement of the PSA. With four measurements in four different mask positions, the whole specimen can be measured.
In Fizeau configuration, each point source generates a reference wave. In order for the setup to work, all but one reference wave must be blocked by the interferometer aperture. The role of the interferometer aperture is crucial in this context. In order to understand its design let us consider an example: Let there be a Cartesian, equally spaced PSA with a distance
$ x $ between point sources. The light of each point source produces a new reference wave at the Fizeau surface. The plane of the PSA is conjugate to the interferometer aperture plane (IAP). The point sources are imaged to a point array in the aperture plane with a point spacing of$ X' = \beta' \cdot x $ , with$ \beta' $ being the imaging scale, which is typically −1 for our case. The interferometer aperture size must be less than$ 2\cdot X' $ in order to filter out all reference wavefronts but one.The other functionality of the interferometer aperture is to reduce the angle of incidence between reference and object wave in order to keep the fringe density on the detector below the Nyquist criterion of 2 pixels per interference fringe or any other value that the detector can resolve. At the same time, it is advantageous to minimize the number of patches and thus maximize the size of the interferometer aperture. The position of a point in this plane corresponds to the propagation direction of a plane wave in the detector plane, hence this plane is often called the Fourier plane of the imaging optics of the interferometer. The aperture plane is located in the front focal plane of the imaging optics. The Nyquist criterion defines the maximum slope difference between reference and object wave. Therefore it can be thought of as a geometrical distance between reference and any part of the object wavefront in the interferometer aperture plane.
The object wavefronts from aspheric or freeform surfaces are deviating much from a plane wave, so in the IAP the object wavefront originating from one point source illuminates an extended area. If this area is smaller than the interferometer aperture, the whole object wavefront reaches the detector and therefore the SUT can be measured in one patch. Measuring strong aspheres however results in strongly distorted object wavefronts that do not pass the interferometer aperture completely. The higher gradients are cut off according to the Nyquist limit. The interferogram patch does not cover the whole SUT. Light from different directions is needed to compensate the local gradients (i.e. other sources of the PSA with different propagation directions). Illuminating the SUT under a different angle shifts the reflected object wavefront laterally in the IAP. Therefore, another part of the object wavefront passes the aperture.
For the generation of the reference wave the mask array also plays an important role. If the IAP was designed such that only the central source of the array would generate the reference wave, this wave would be obscured when the mask array is moved to the other three positions. If the interferometer aperture in the IAP was designed such that the central source would be always on in every mask position, there would be overlap of the interferograms in different mask positions, which would lead to undesired multiple-beam interference (see Fig. 2a).
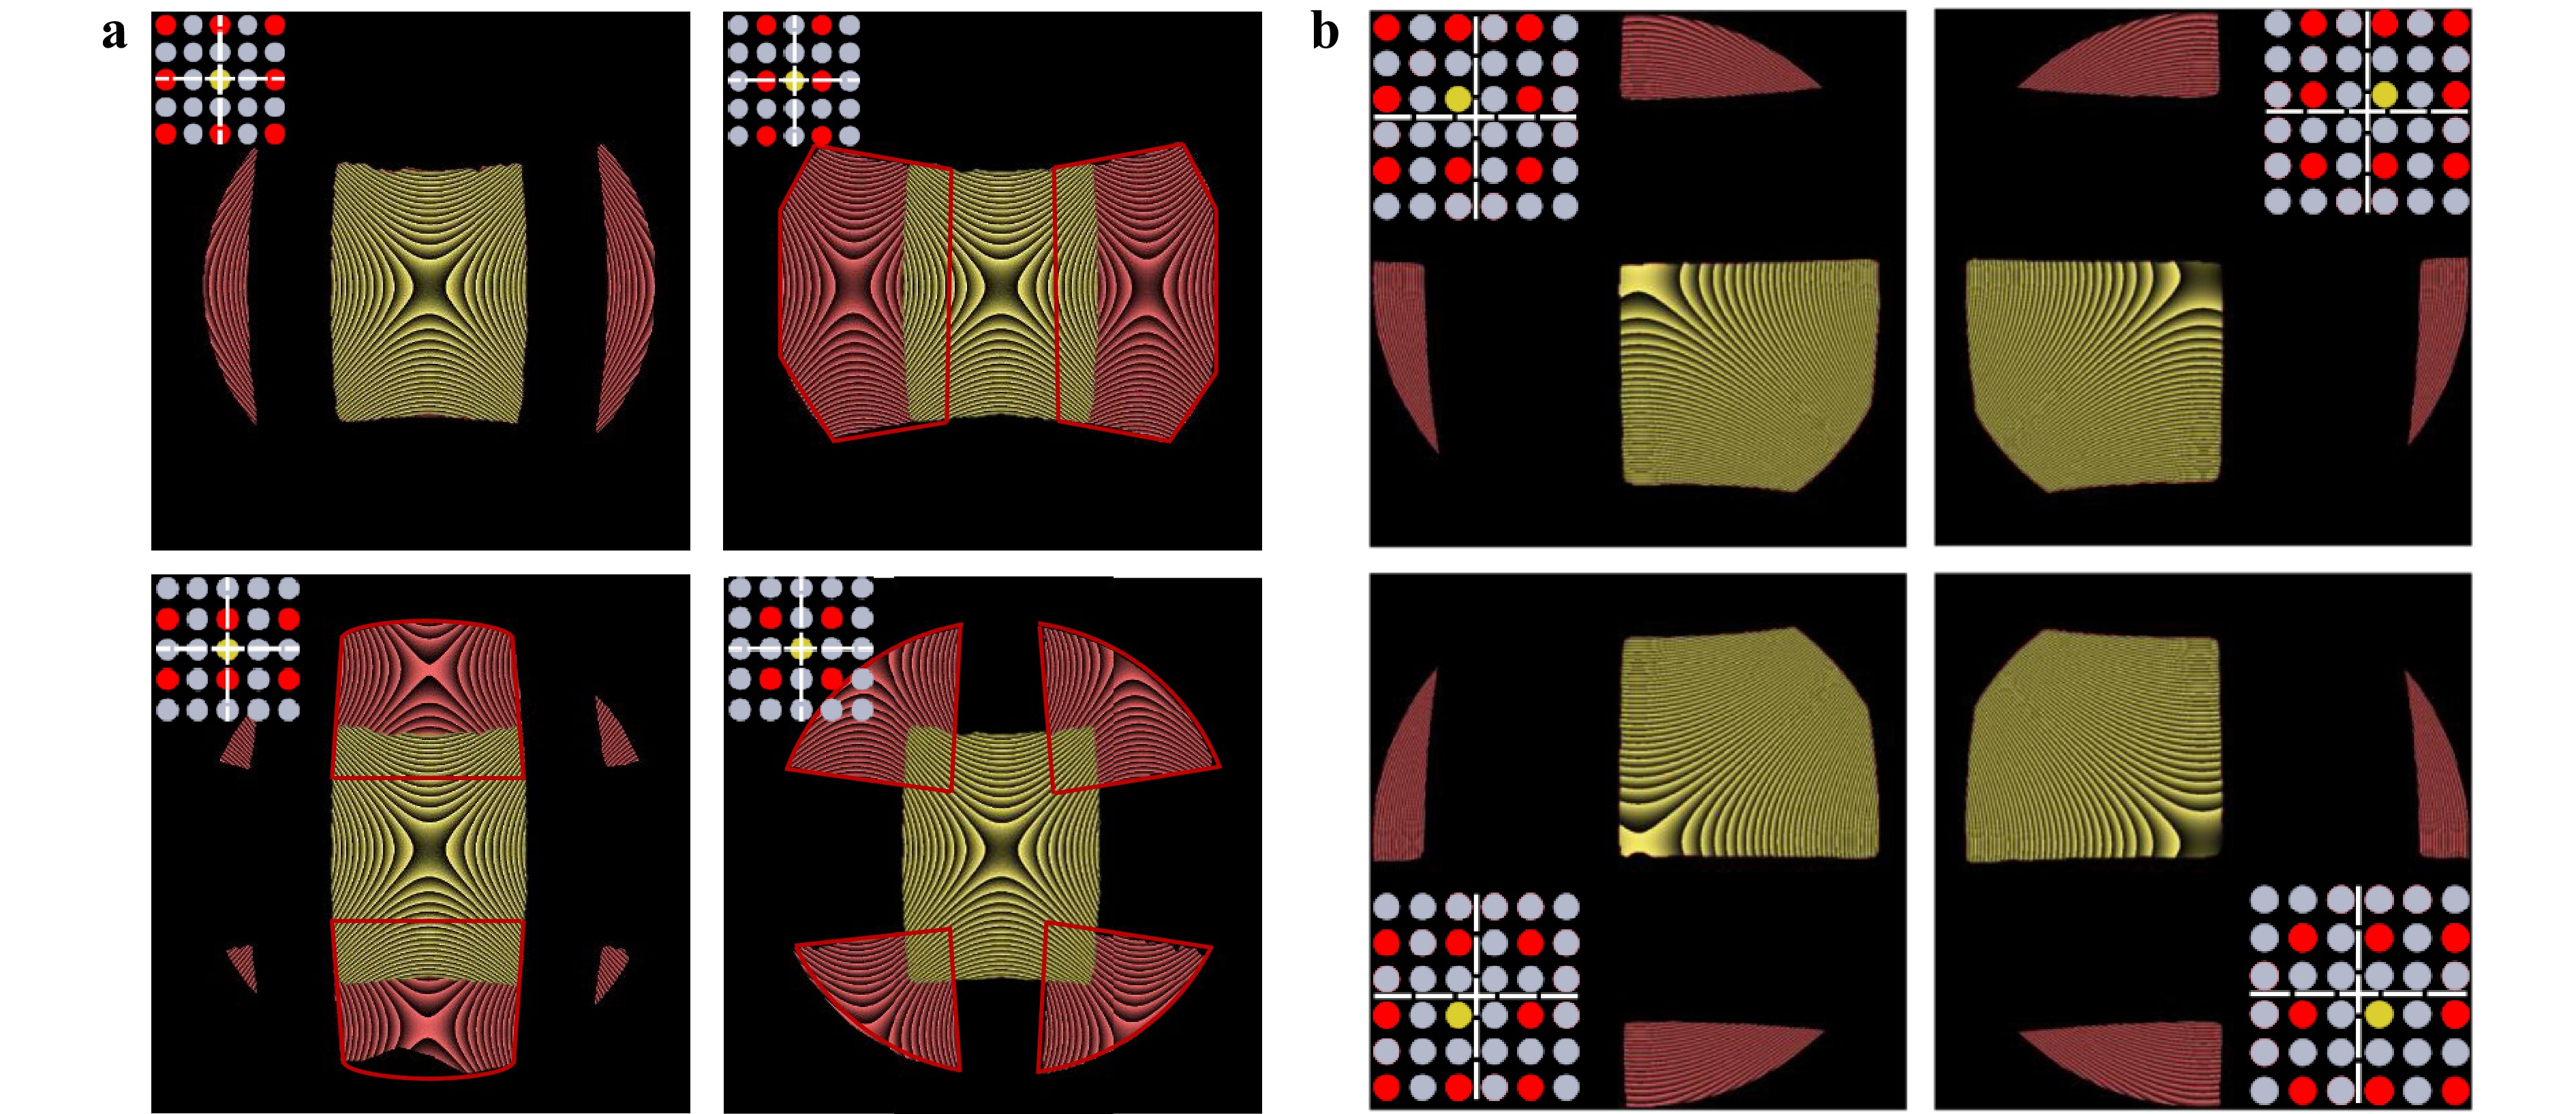
Fig. 2 Simulated interferograms of four mask positions for different point source array realizations. The point source arrays are shown in the inlet in the upper left corner. The red interferogram patches originate from the red marked point sources, the yellow interferograms originate from the yellow marked point sources, which also provide the Fizeau-reflex reference wave. Gray point sources are switched off. a Realization with an “always on” reference source. In three of the four mask positions there is an disturbing interferogram overlap between the interferogram of the central source and the interferogram of the other sources. For better visualization, the borders of the interferograms are marked with a red polygon shape. b With the novel point source array design with four shifted reference sources there is no overlap between the interferograms inside of the active mask position.
Therefore, a novel design of the point source array is used for the Fizeau system: Instead of a central source, there are four sources equally spaced around the optical axis. A scheme of the novel point source array design is shown in Fig. 3. With this new configuration exactly one of these four sources generates the reference wavefront in the matched mask array position. This ensures that there is no patch overlap in one mask-position and all sub-interferograms are interpretable. Simulated interferograms generated with the novel designed point source array are shown in Fig. 2b.
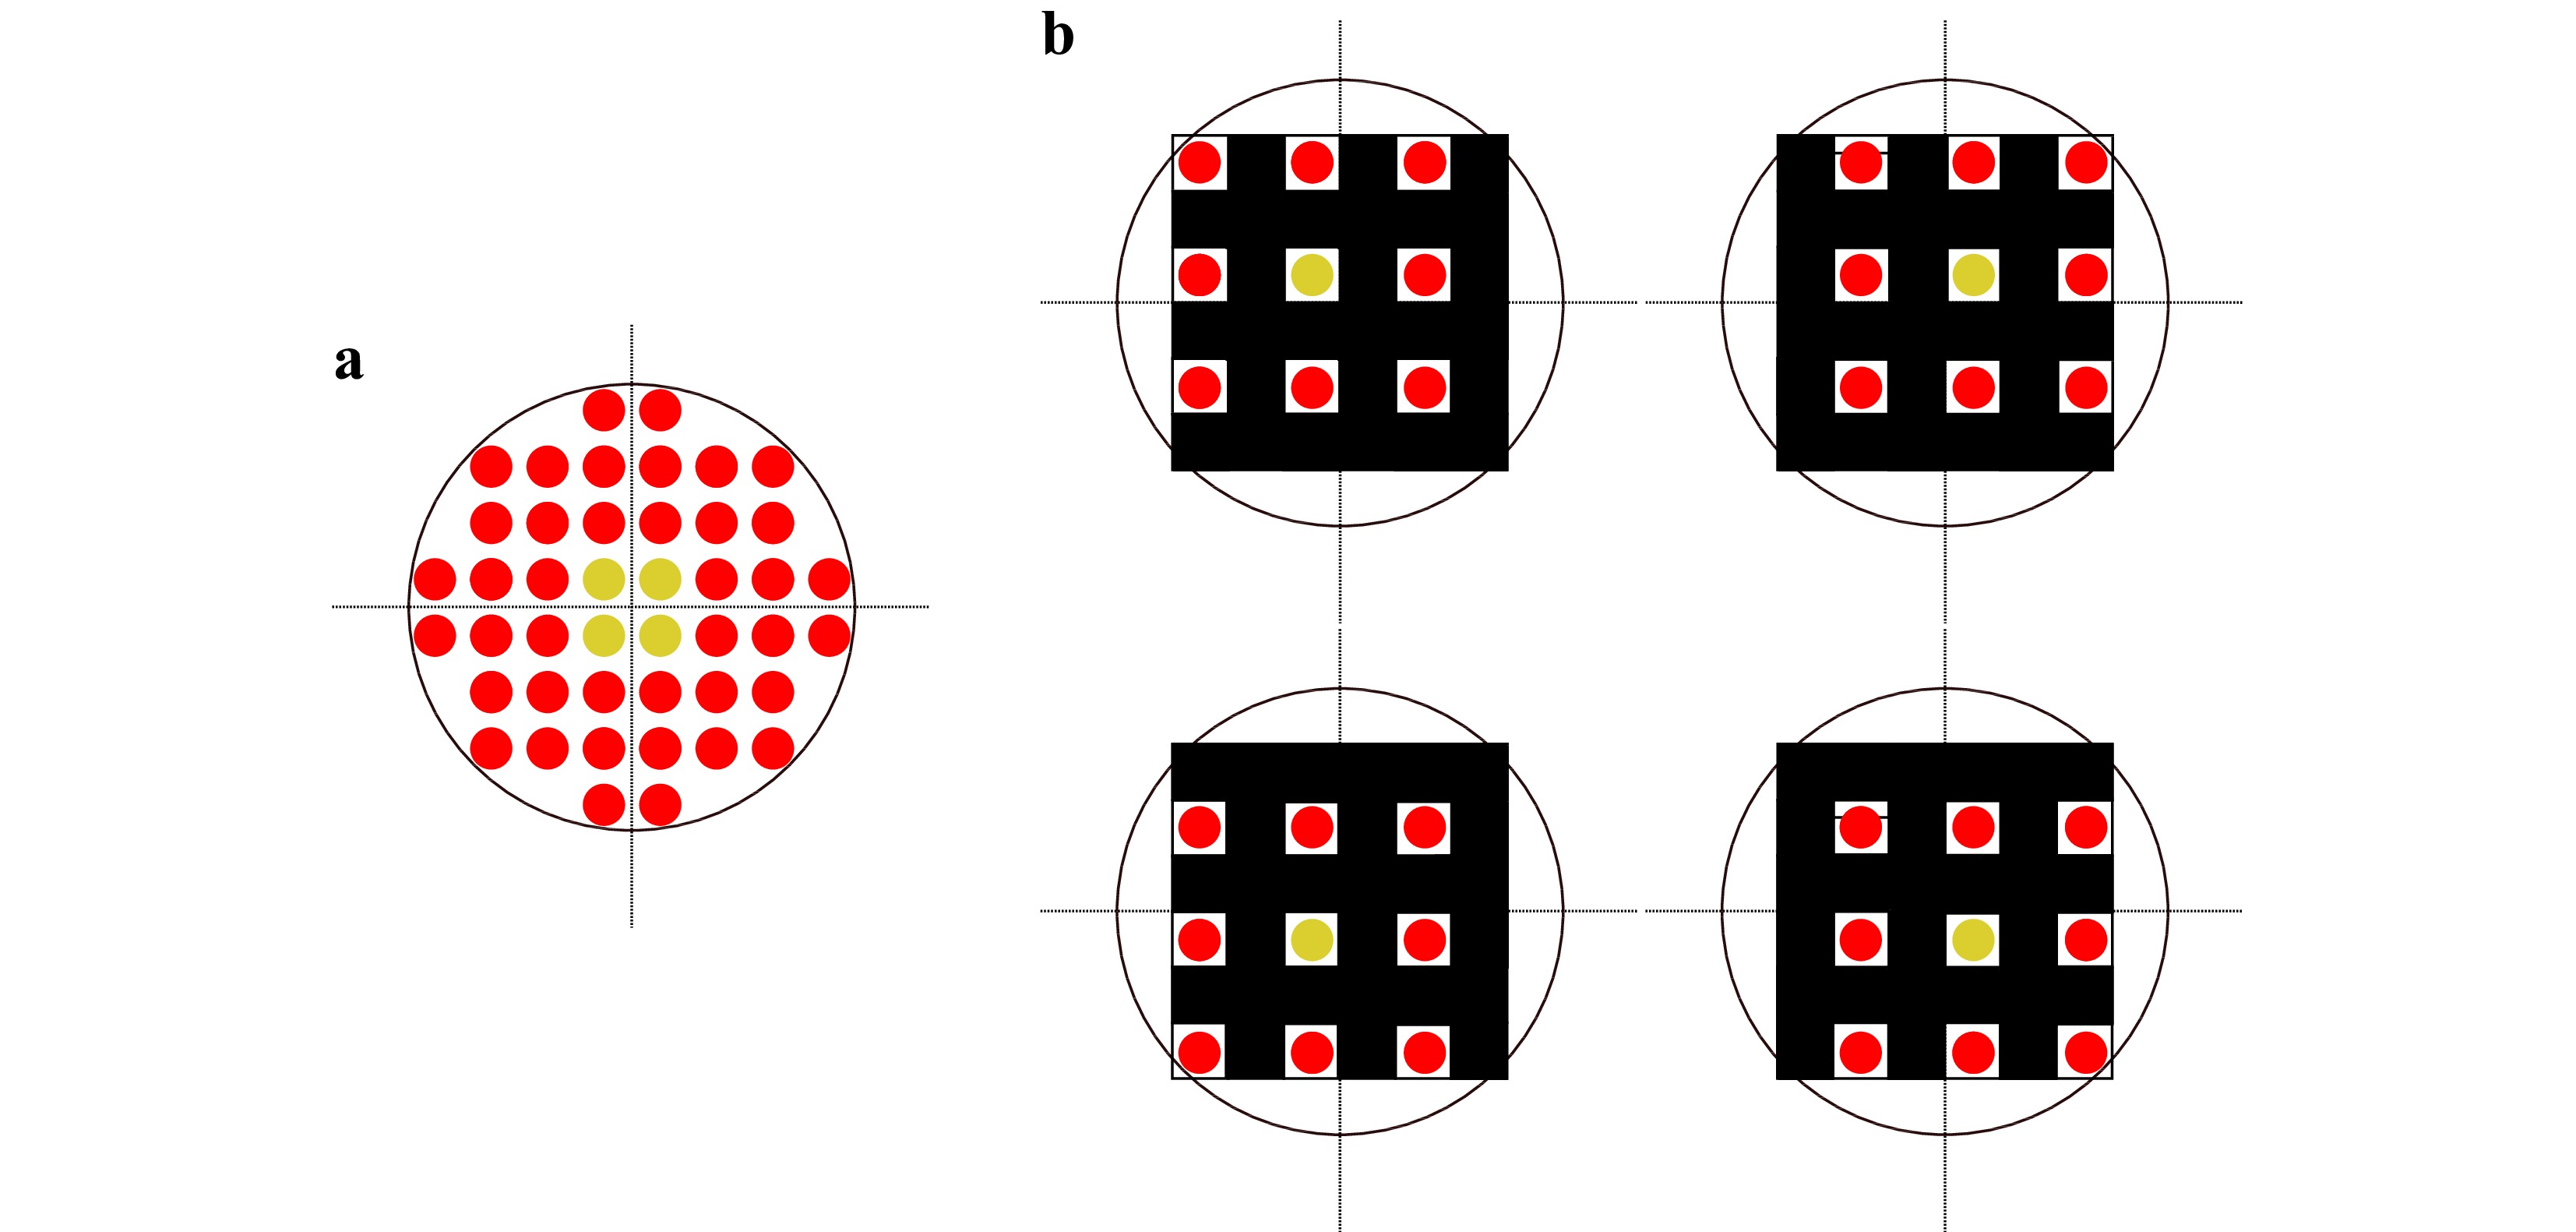
Fig. 3 a The new point source array design for the Tilted Wave Fizeau Interferometer. The new design has no central source, there are equally spaced point sources around the optical axis. The innermost four point sources (colored in yellow) are used for Fizeau reference generation. b The four different positions of the movable mask array. In each mask position there is only one of the central point sources active.
-
Since the described setup is a non-null interferometer, the measurement signal on the camera not only shows the desired shape deviation of the surface under test from its ideal shape but also the asphericity of the sample and systematic, sample-dependent errors of the setup, the so called retrace errors34. The calibration of the retrace errors is a non-trivial task that is defining the uncertainty of any non-null testing method and consequently has been approached by many authors. Part of the systematic errors can be erased if the sample shows symmetries, e.g. exploiting the rotational symmetry of aspheres in rotation tests to determine the non-rotational SUT error part. For the determination of the complete systematic error, Greivenkamp et al.35,36 have suggested to use a raytracing model of the test setup that is using accessible setup characterization data (individual component’s surface errors, position and orientation deviations) and an optimization to find a model that best explains the observed data of calibration measurements. Our approach is based on a black box model description of the wavefront aberrations of the setup. The idea of this description was developed for the classical Twyman-Green type TWI and is described in29. In the following we summarize the principle idea and highlight the fundamental changes that were necessary to adopt the model to the new Fizeau type TWI.
The black box model describes the optical path lengths (OPLs) of all possible paths through the interferometer, including the reference wave. It combines a polynomial description of the illumination part (Q), the imaging part (P) and in addition to29 also the reference part (R) with free space raytracing in the test space of the interferometer. The light paths for the three black box models are shown in Fig. 4.
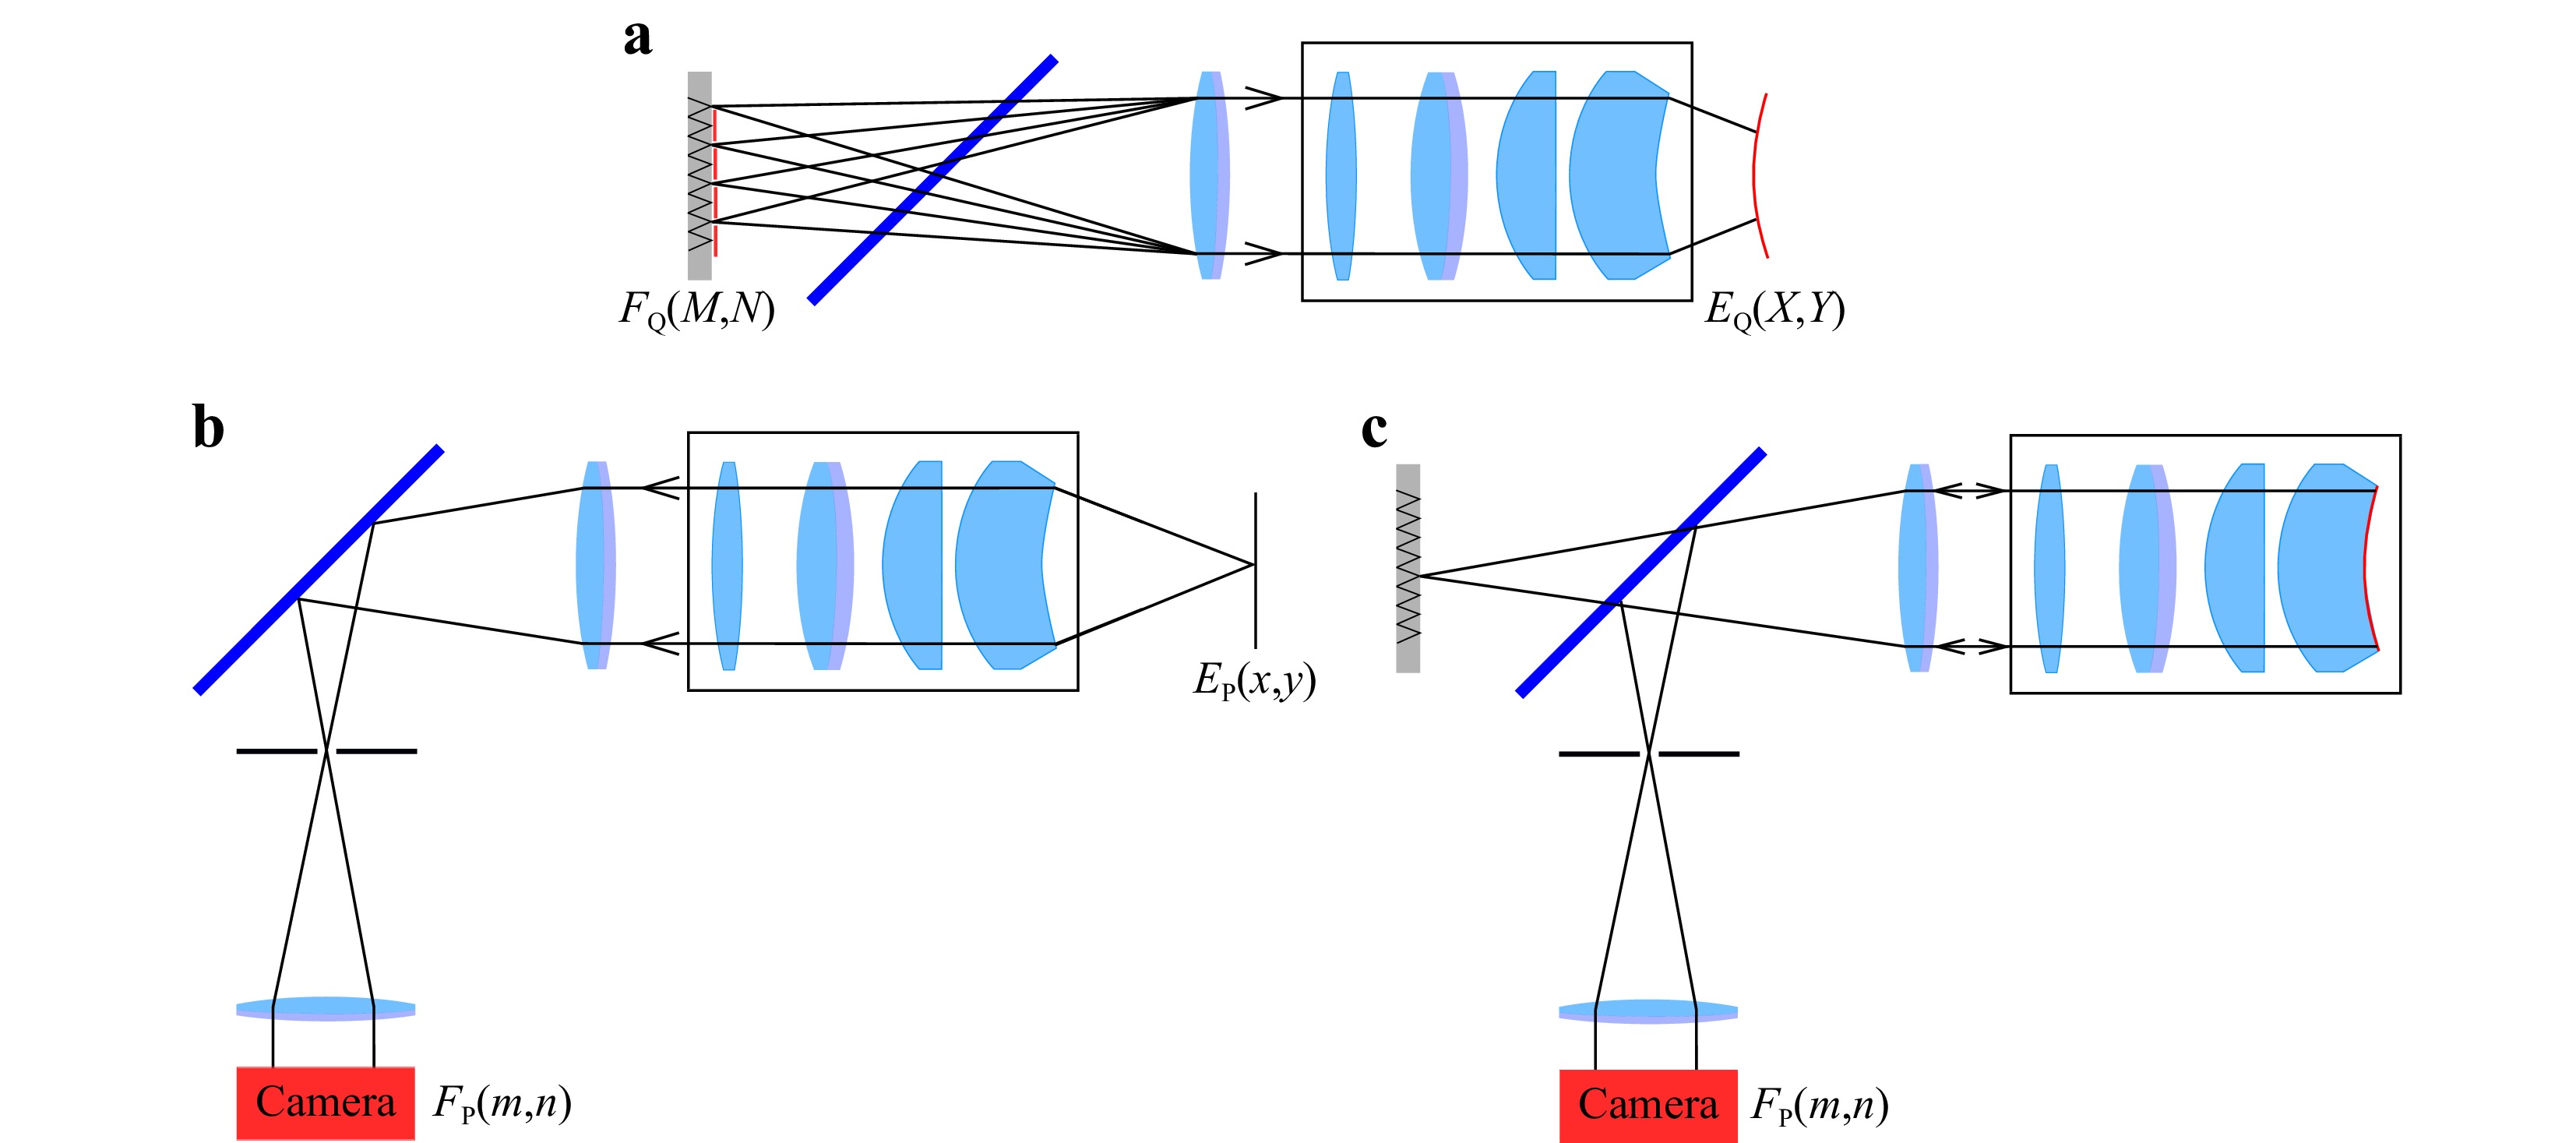
Fig. 4 The three black box representations used to model the optical path lengths in the interferometer. a Q-Blackbox, describing the illumination of the SUT b P-Black box, describing the OPLs on the imaging path. c Reference path, described by the R-Black box.
The Q-black box models the optical path lengths from a source point M, N to a point X, Y on a plane
$ E_{\rm Q}(X,Y) $ near the measurement volume. Each single point source of the array produces a wavefront that can be expanded into Zernike polynomials. The resulting coefficients form a one dimensional vector. This vector is varying along different positions$ (M,N) $ of the light sources in the array. This twodimensional dependency from the field coordinate M, N is a smooth function for our optical system and can be modelled in good approximation as a smooth twodimensional function for each coefficient of the Zernike polynomial vector, which allows to describe this field dependency of the individual Zernike terms as another Zernike polynomial. So the optical path lengths of rays through the illumination part of the system can be described by Eq. 1$$ \begin{array}{*{20}{l}} W_{\rm Q}(M,N,X,Y)=\displaystyle\sum\limits_{i,j} Q_{ij} Z_{j}(M,N)Z_{i}(X,Y) \end{array} $$ (1) Where
$ Q_{ij} $ is a two dimensional array of Zernike polynomial coefficients, and$ Z_{j}(M,N) $ and$ Z_{i}(X,Y) $ are Zernike polynomials. In the same way, the equation for the P-black box, describing the optical pathlengths from a plane in the measurement volume$ E_{\rm P}(x,y) $ to the plane representing the camera chip$ F_{\rm P}(m,n) $ is modeled:$$ \begin{array}{*{20}{l}} W_{\rm P}(m,n,x,y)=\displaystyle\sum\limits_{k,l} P_{kl} Z_{l}(m,n)Z_{k}(x,y) \end{array} $$ (2) A major difference to the classical TWI description is the third black box, the R-black box that describes the reference wavefronts. Since in the new Fizeau configuration there are four reference sources, there have to be four models for the reference wave for use in the different positions of the mask array. For all four existing reference waves, only one single source is active per mask position. To describe the R-black boxes, only one dimension of Zernike polynomial coefficients
$ r_{a,i} $ is needed, describing the pathlengths from a single source via the plane$ E_{\rm Q}(X,Y) $ to the plane$ F_{\rm P}(m,n) $ representing the camera. This leads to a function for the reference part of the OPL depending on the position$ a $ of the aperture array:$$ \begin{array}{*{20}{l}} W_{\rm R}(m,n,a)= \begin{cases} \sum_{i} r_{1,i} Z_{i}(m,n) & \quad \text{if } a=1 \\ \sum_{i} r_{2,i} Z_{i}(m,n) & \quad \text{if } a=2 \\ \sum_{i} r_{3,i} Z_{i}(m,n) & \quad \text{if } a=3 \\ \sum_{i} r_{4,i} Z_{i}(m,n) & \quad \text{if } a=4 \end{cases} \end{array} $$ (3) The optical path difference (OPD) of a ray starting on the source grid coordinate M, N and ending on the camera pixel coordinate
$ m $ ,$ n $ is mathematically described by the equation:$$ \begin{aligned} F_{\rm{OPD}}(M,N,m,n,D,p) =&W_{\rm Q}(M,N,X,Y) +W_{\rm P}(m,n,x,y)+\\& W_{ \rm{geo}}(D,p) -W_{\rm R}(m,n,a) \end{aligned} $$ (4) Where
$ W_{\rm{geo}} $ defines the geometrical pathlengths between the plane$ E_{\rm Q} $ , by the reflection of the SUT and the plane$ E_{\rm P} $ which is dependent on the geometry D and the position$ p $ of the SUT. In a measurement, a ray S starting from M, N to a pixel of the camera with coordinate$ m $ ,$ n $ has the optical pathlength$ b $ and is dependent on the black box polynomial coefficients Q, P and$ R_{a} $ ($ a = 1,2,3,4 $ ), the geometry$ D $ and position$ p $ of the SUT. All pathlengths of all rays can be combined to the vector$ \vec{b} $ $$ \begin{array}{*{20}{l}} \vec{b}=F_{\rm{OPD}}(Q,P,R_{a},S,D,p) \end{array} $$ (5) During the calibration process, real OPDs
$ \vec{b}_{\rm{real}} $ are generated in the real interferometer by measuring a well known reference sphere. To describe the difference between reality and mathematical model, we introduce the interferometric calibration parameter$ \vec{x}(Q,P,R,p,O) $ . Here,$ O $ denotes the noise, generated e.g. from the camera. Now,$ \vec{b}_{\rm{real}} $ can be represented by$$ \begin{array}{*{20}{l}} \vec{b}_{\rm{real}} =F_{\rm{OPD}}(\vec{x},S,D) \end{array} $$ (6) The calibration parameter
$ \vec{x} $ allows us to build up a mathematical model of the differences between the ideal interferometer design and the real interferometer, which we call the “real interferometer errors”, and correct for them mathematically. Solving Eq. 6 for$ \vec{x} $ by inverting$ F_{\rm{OPD}} $ leads to$$ \begin{array}{*{20}{l}} \vec{x}=F_{\rm{OPD}}^{-1}(\vec{b}_{\rm{real}},S,D) \end{array} $$ (7) -
To demonstrate the measurement capabilities of the new common-path system, we show virtual and real measurements of four specimens. Two are rotationally symmetric aspheres with vertex radii of 20.2 mm and 34.322 mm, respectively. The other two are freeform surfaces, which are not rotationally symmetric. In Fig. 5 the deviation to their respective best fit spheres is shown. The mathematical descriptions can be found in37 for asphere 1 and freeform 2, there referred to as specimen 1 and specimen 2, respectively, and in38 for asphere 2 and freeform 1, there referred to as asphere 1 and freeform 1.
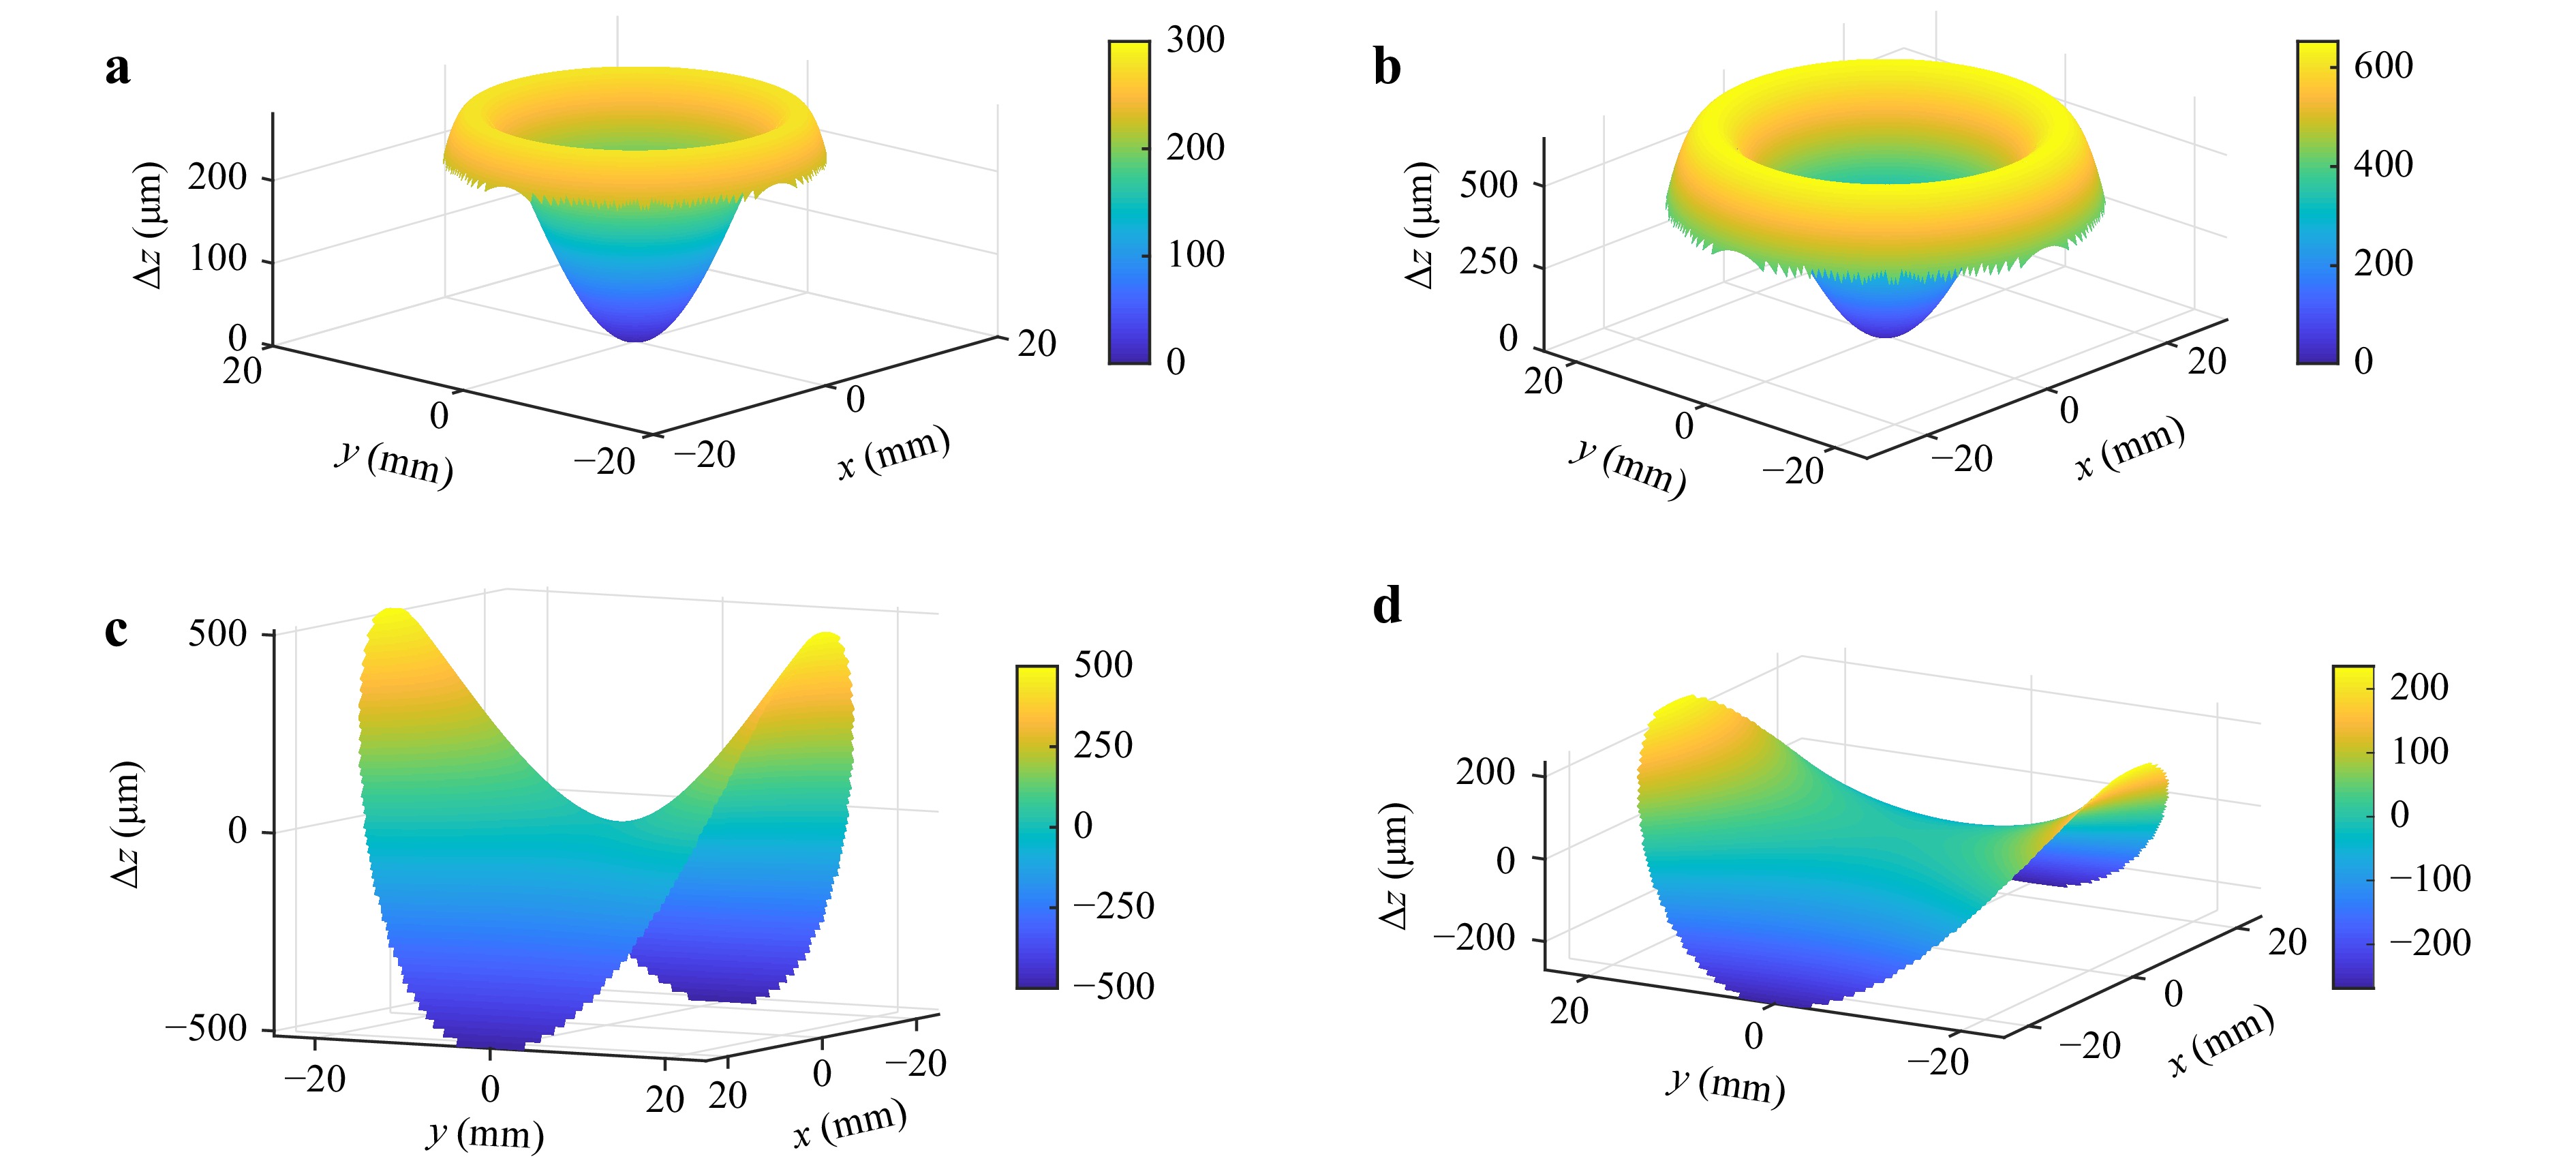
Fig. 5 Deviation from their respective best fit spheres of the measured specimens. a Asphere 1 with a best fit sphere of
$ R=22.71 $ mm, b Asphere 2 with a best fit sphere of$ R=43.45 $ mm, c Freeform 1 with a best fit sphere of$ R=45.76 $ mm and d Freeform 2 with a best fit sphere of$ R=40.9 $ mm. -
For the evaluation of the influence of lens errors on the new Fizeau system we conducted virtual experiments. The benefit of these experiments is, that the true value of the measured specimen is known. In virtual experiments simulated phase data is used instead of real measured phase data. This data is provided by a second model of the interferometer, the “virtual real” model. In this model disturbances like misalignments of the optical elements or lens aberrations are introduced. With this model a disturbed black box model is calculated. The OPLs are calculated at the different calibration positions with this “virtual real” model and a nominal black box system is calibrated based on these OPLs as input data. For the simulation of a measurement the same idea is used, the virtually generated input data is processed with the standard evaluation algorithms. The workflow is visualized in Fig. 6. A detailed description of the virtual experiment system is given in39. As metric for our evaluation we used the reconstruction error for a virtual measurement of freeform 1. To investigate the performance of the Fizeau configuration, especially in the presence of high frequency errors, we extended the polynomial degree of the black boxes for the “virtual real” model, so that the degree is higher than in the model used for calibration and evaluation. As disturbance we added a Gaussian peak bump off axis on the collimation lens (CL) of the interferometer. The amplitude of the bump was
$ 0.7\lambda $ .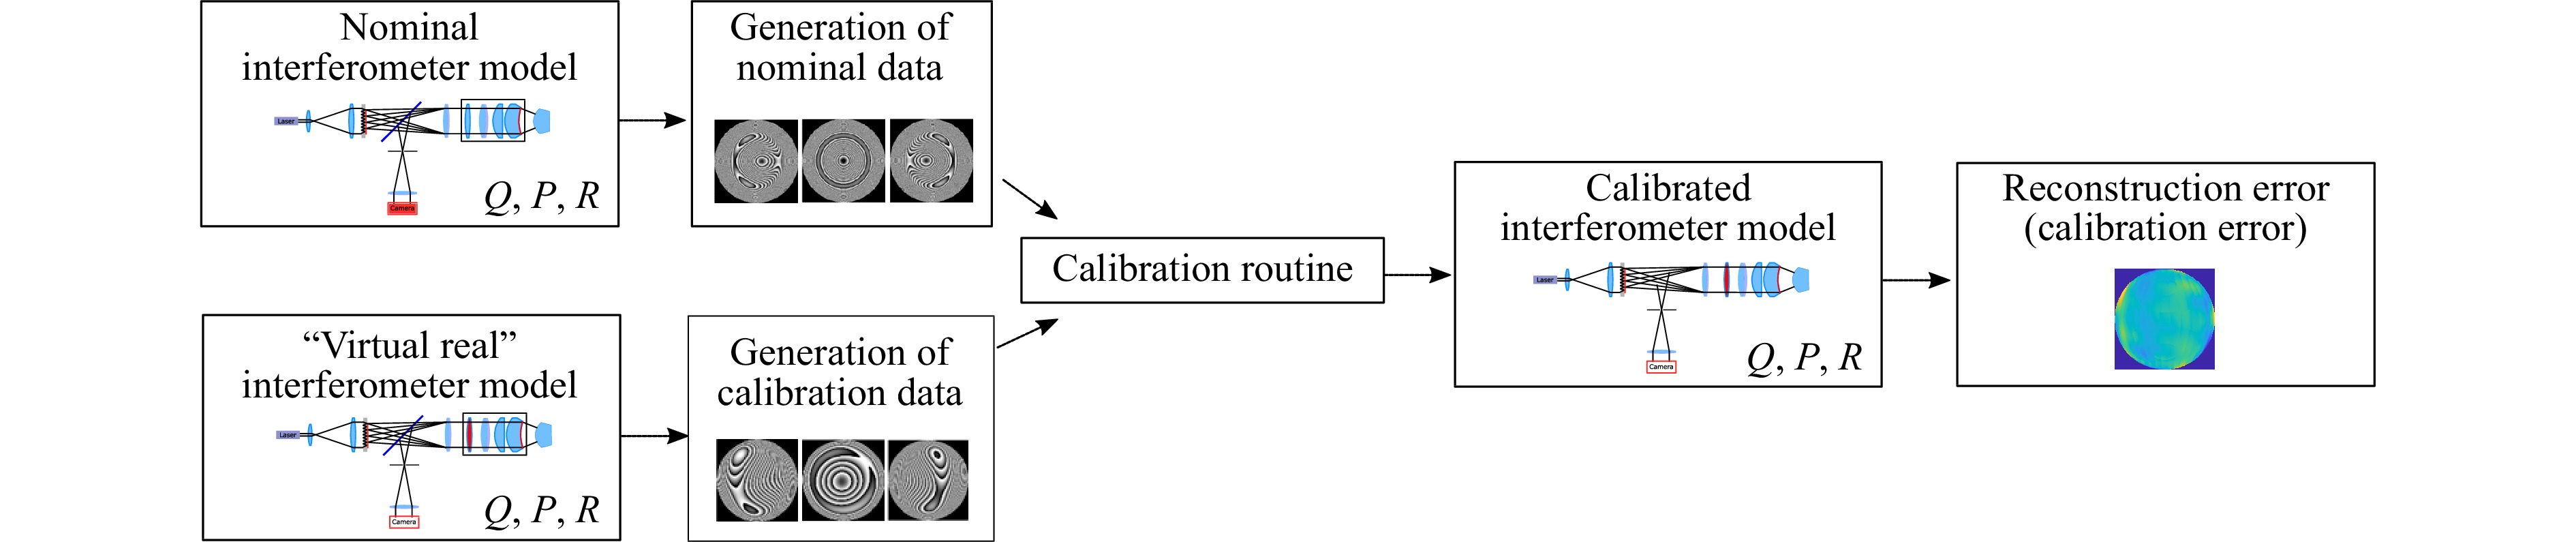
Fig. 6 Explanation of the simulation workflow: A “virtual real” high order polynomial model of the TWI is used to generate input data for the calibration of a nominal model. To investigate the calibration errors virtual measurements of a surface are evaluated with this models and compared.
Fig. 7 shows the reconstruction errors of the classical Twyman-Green TWI (a) and the TWI in Fizeau configuration (b). In both systems, only the Gaussian bump was added as disturbance. To quantify the deviation, the root mean square and Peak-to-Valley value of the differences were calculated as shown in Table 1.
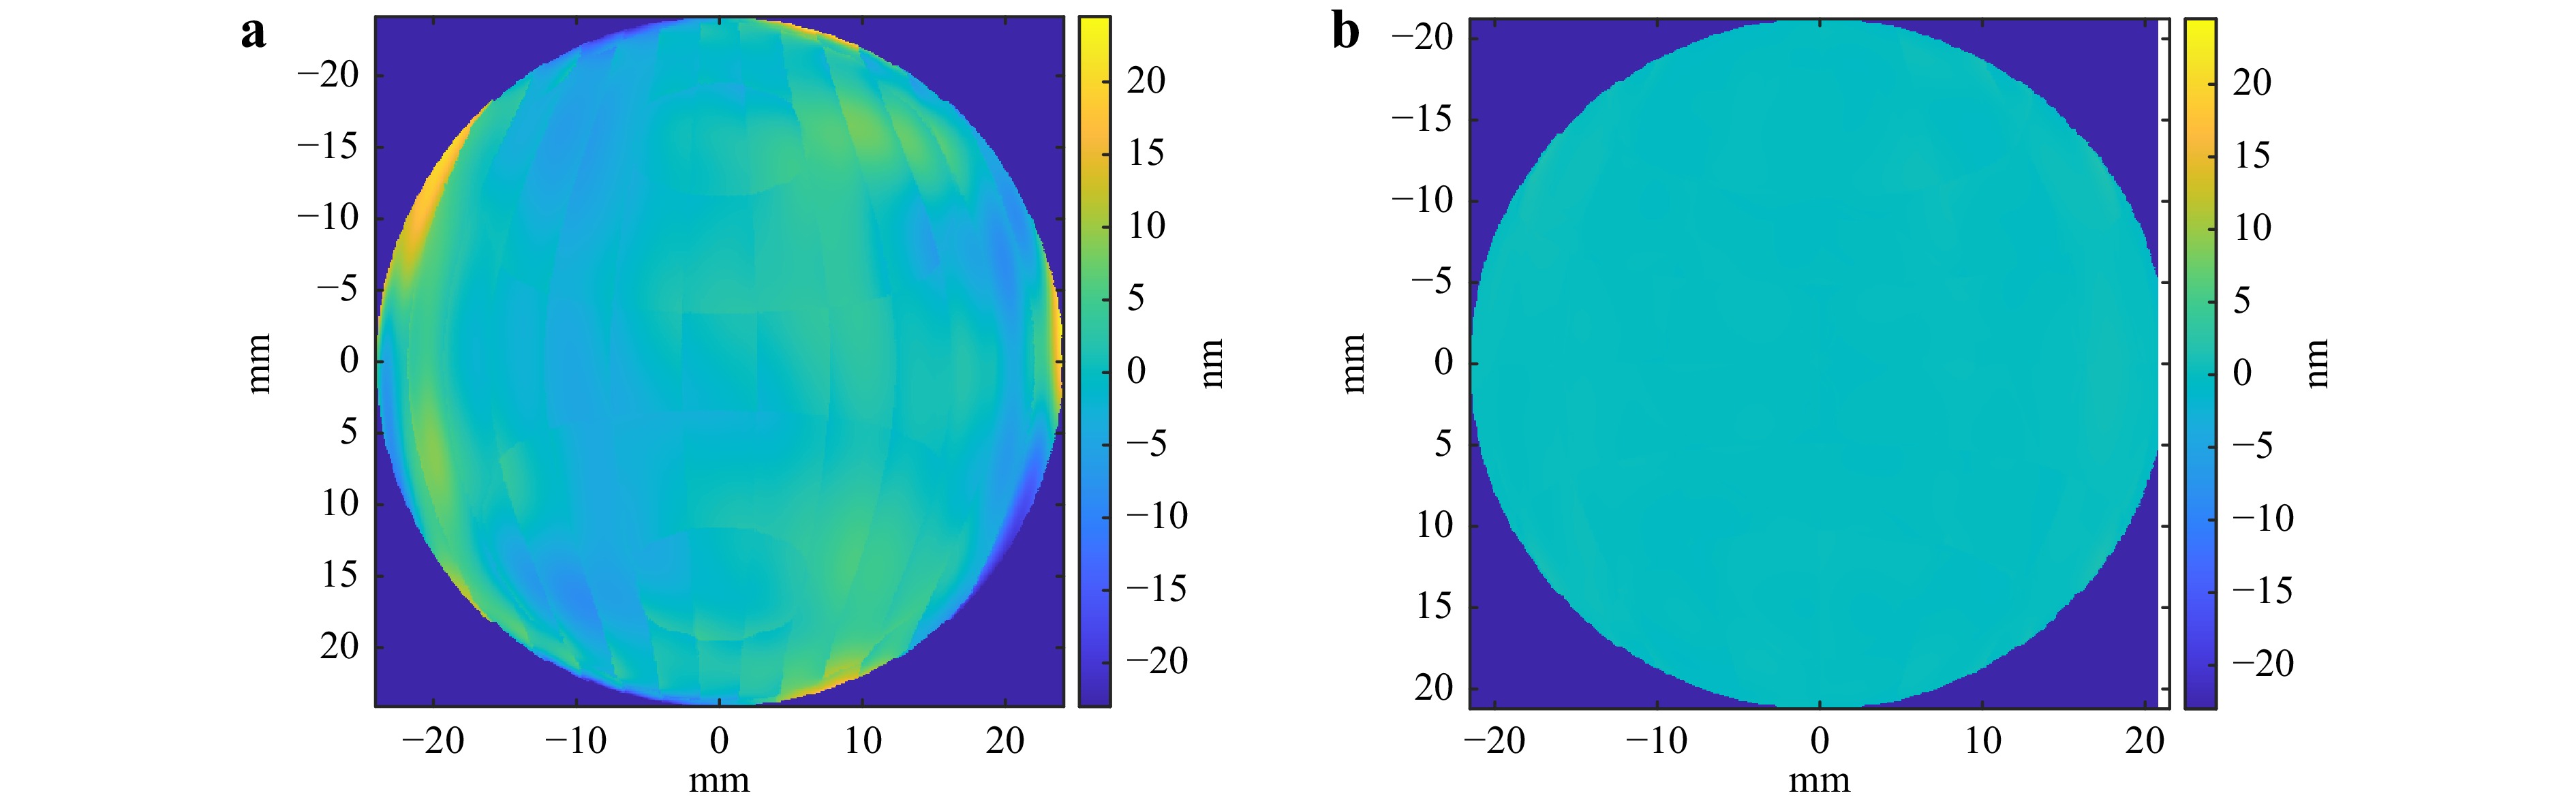
Fig. 7 Reconstruction error of freeform 1 with a disturbed interferometer. The polynomial order of the disturbance exceeds the order of the calibrated interferometer model. a Classical Twyman-Green TWI. Uncorrectable high order disturbances are clearly visible. b TWI in Fizeau configuration. High order disturbances are self compensated to a high degree 25.
classical Twyman-Green TWI common-path TWI RMS 2.51 nm 0.23 nm PV 47.11 nm 3.98 nm Table 1. Reconstruction errors of the common-path and the classical Twyman-Green TWI system25.
In order to investigate the effects of defects on the optical system further, we added Zernike polynomial shaped errors on the first surface of the collimation lens. We then made a simulated calibration and measurement as in the previous simulation. This was repeated with increasing order of the Zernike defect in the surface up to Zernike number 65, i.e. polynomial degree 10. The results of the simulation in terms of the reconstruction errors of the surface are shown in Fig. 8.
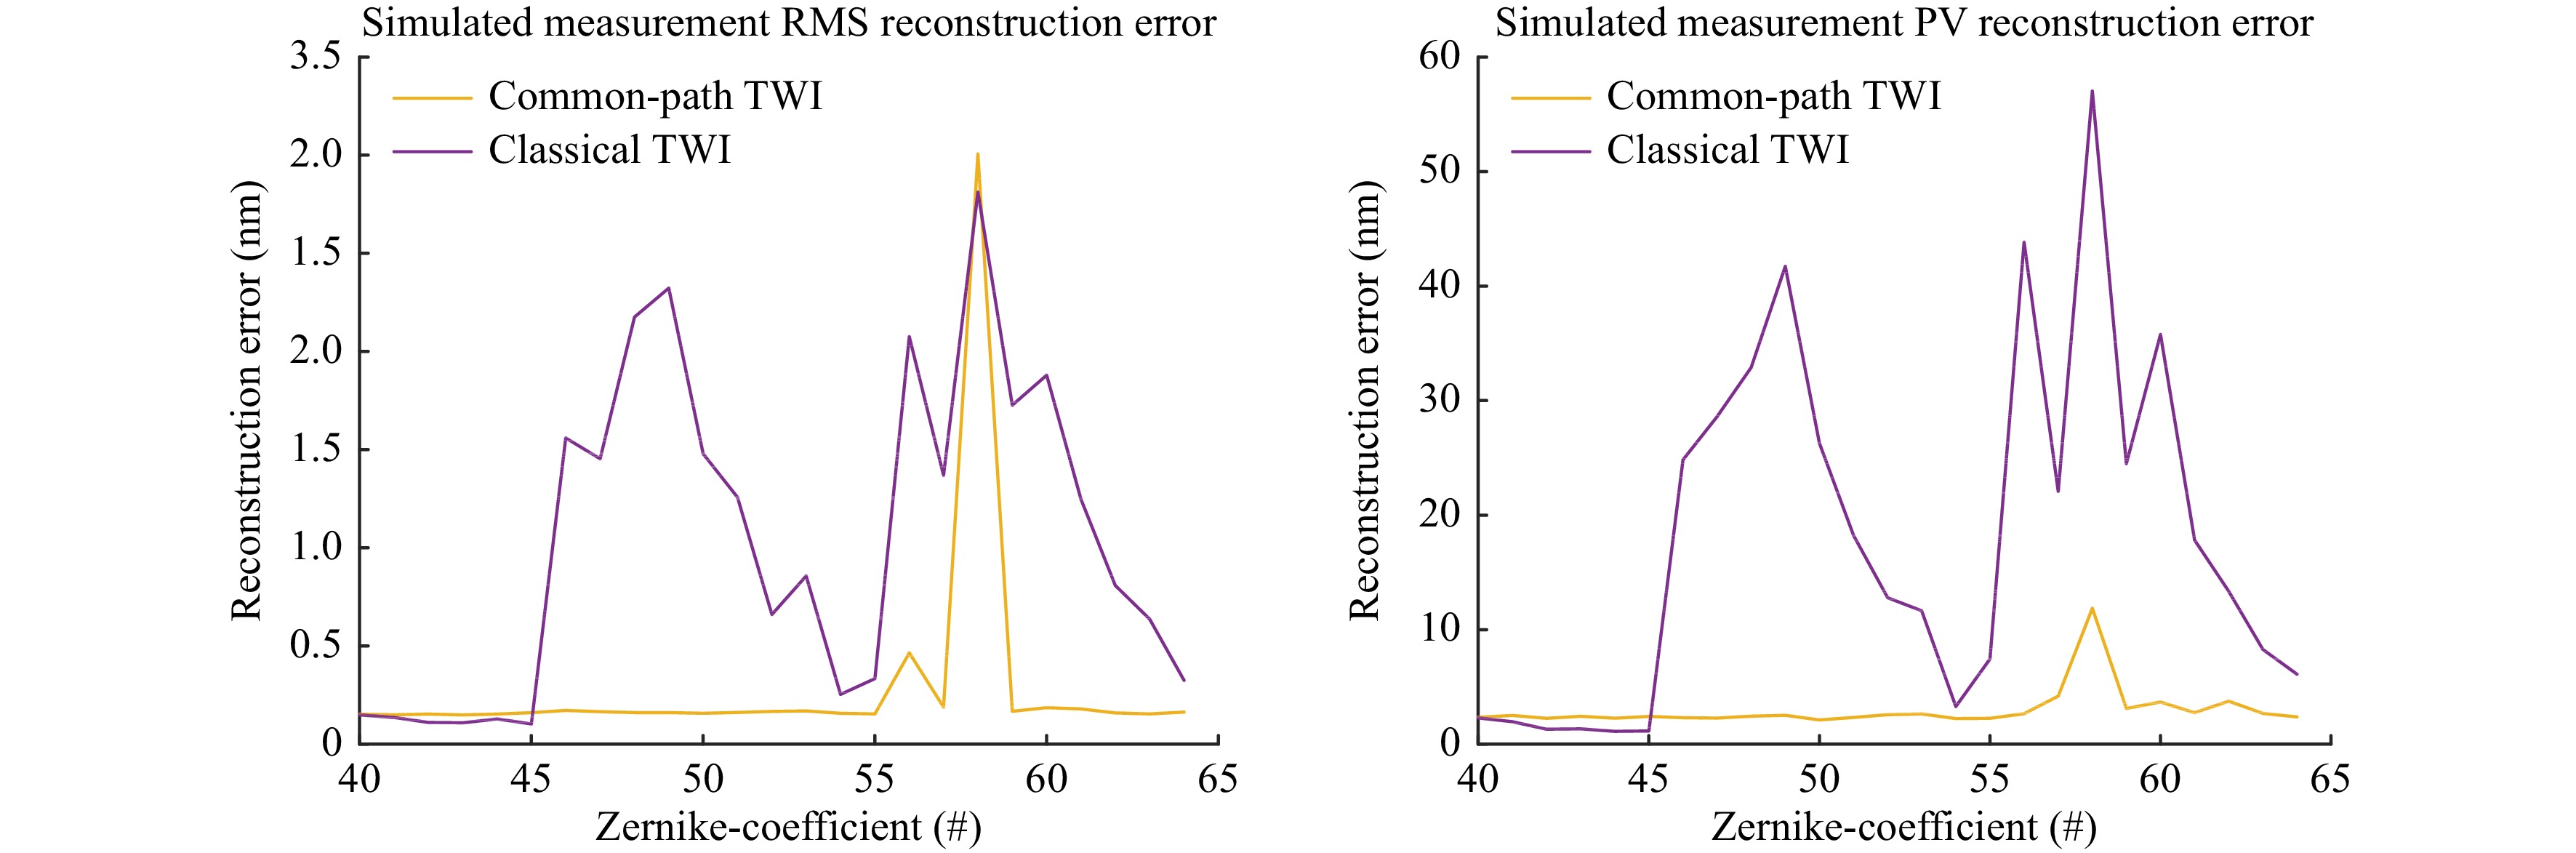
Fig. 8 Freeform surface reconstruction error as function of the order of a Zernike polynomial shaped surface error within the interferometer system. The self-compensating effects show in the higher range that the common-path configuration tolerates in comparison to the classical Twyman-Green TWI system. This allows to relax the specifications on the optics in interferometer design.
-
After the successful calibration of the common-path TWI which takes about 30 minutes, the calibrated
$ Q $ -,$ P $ - and$ R $ -polynomials are available and measurements can be performed. For the evaluation of the measurement data, analogously to the calibration process, the difference between measured OPDs$ \vec{b}_{\rm{real}} $ is modeled by a correction vector$ \vec{x}_{\rm{meas}} $ , containing topography and position of the measured SUT and thereby deliver the measurement result40. -
Fig. 9 shows the first lab demonstrator of the new Fizeau TWI. A fiber coupled laser diode (TEM Lasy638, which has its wavelength stabilized by using a spectral absorption line of iodine) at 638 nm wavelength is mounted and expanded to illuminate the monolithic point source array, which consists of a rectangular array of 13 × 13 point sources with a spacing of 2.5 mm. Each point source is a diffractive element on a fused silica substrate, which focuses the light onto the associated pinhole on the backside of the substrate. All sources are illuminated simultaneously, therefore the laser is chosen to have about 18 mW ex fiber. Four percent of the light is reflected by the last uncoated glass surface of the 4 inch Fizeau objective (custom design, radius of reference surface: 50 mm) and serves as reference wave that provides maximum fringe contrast for uncoated glass SUTs. The objective limits the radius of curvature of the best fit sphere to 50 mm convex and to a clear aperture diameter of 53 mm. The interferogram is evaluated using the five-step Schwider-Hariharan algorithm41. For phase shifting, the interferometer objective is moved along the optical axis in five steps from zero to
$ \lambda $ using three piezo actuators. The interferograms are recorded by a camera with a resolution of 2048 × 2048 pixels (AVT Pike F-421 B). Note that this phase shifting approach results in slight phase shifting step variations across the field of view of the interferometer. However, the Schwider-Hariharan algorithm is designed to be robust with respect to step width variations. Systematic errors introduced by the phase shifting are part of the systematic errors the calibration algorithm takes care of.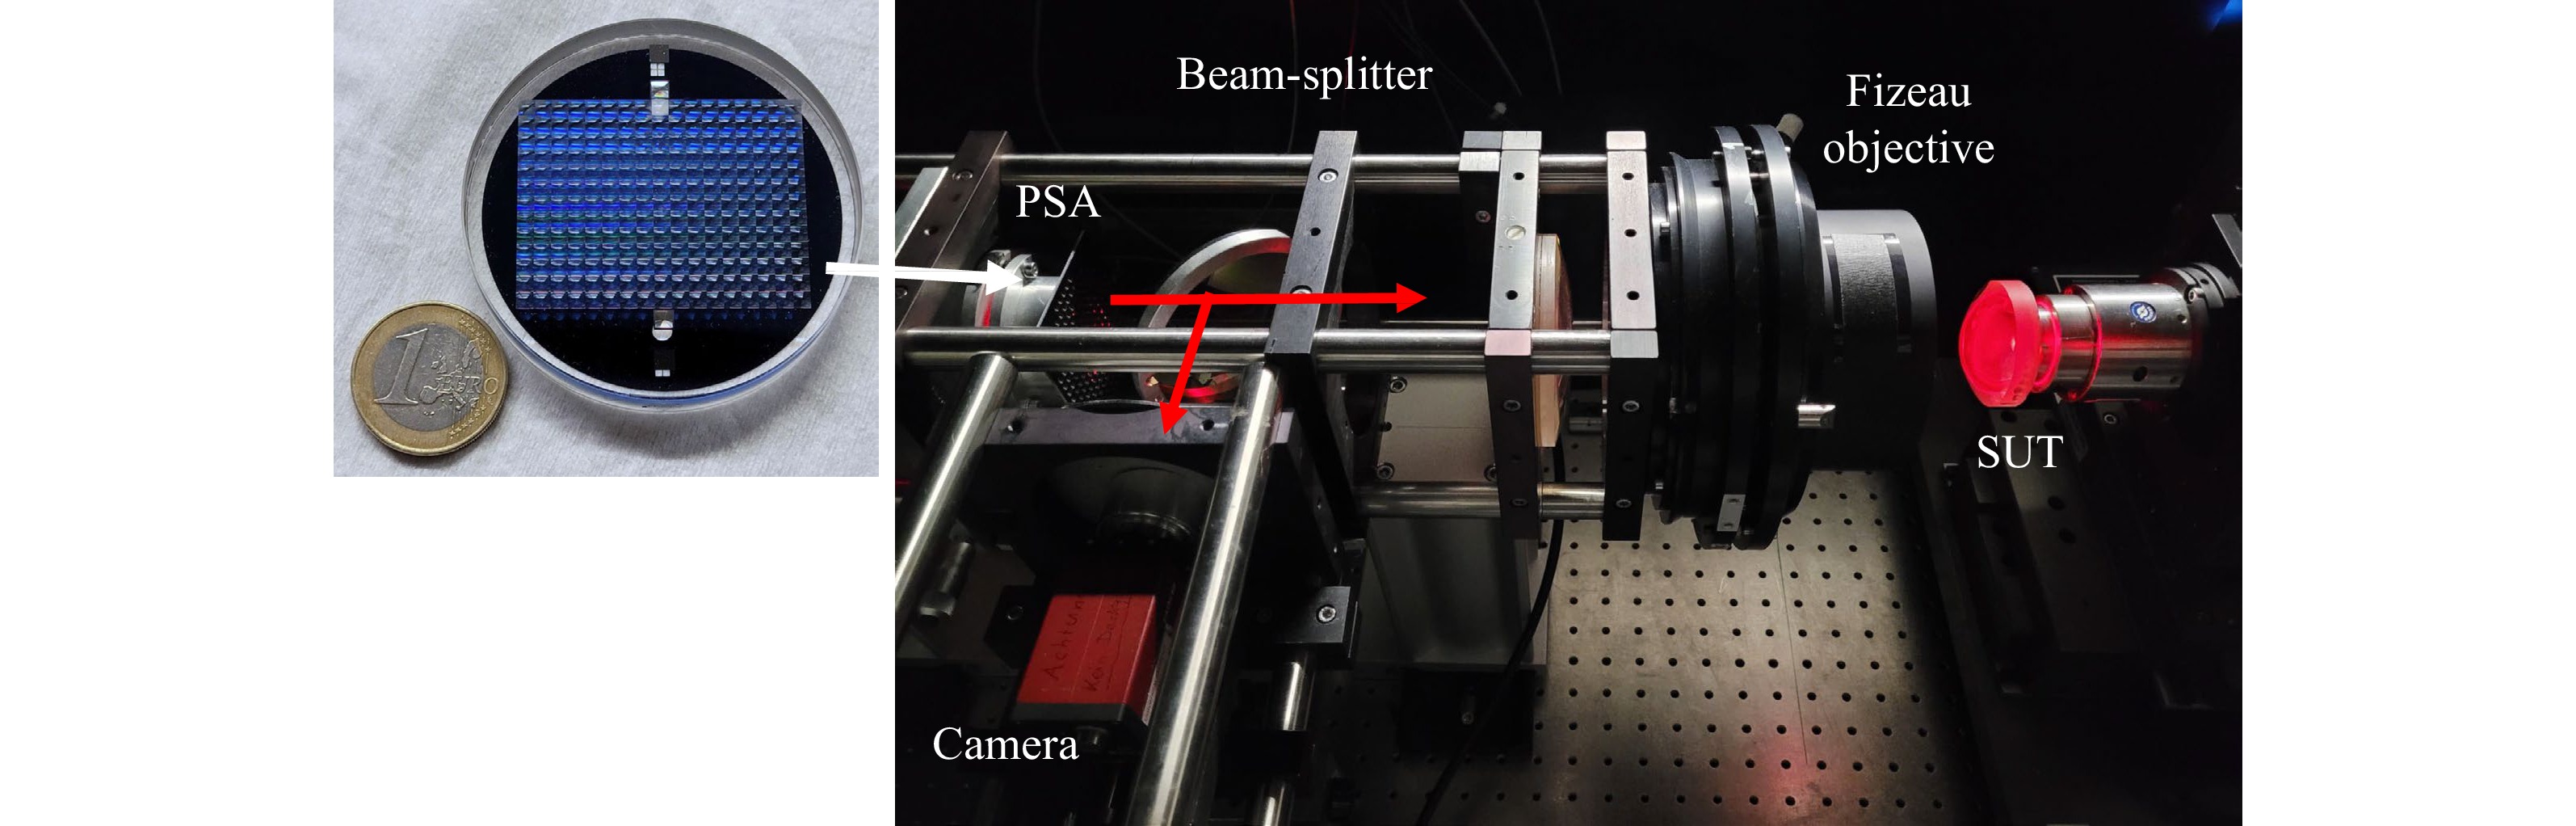
Fig. 9 Experimental realization of the Tilted Wave Fizeau Interferometer measuring an aspheric SUT. The lightpaths are highlighted in red. The monolithic point source array used for illumination is shown in detail.
-
All specimens were measured with the same TWI-Hardware. After alignment, less than 1 minute is needed to measure the whole SUT. After evaluating the measured data, the reconstructed topography is obtained as measurement result. In optics fabrication, the deviation from the nominal shape typically is the relevant quantity. Therefore, we present the measurement results as Surface Error = Measured Shape - Nominal Shape. As an example, in Fig. 10 the surface error of asphere 1 is depicted. This specimen shows three markers at the lower rim of the surface. These are three Gaussian shaped dips that nicely illustrate the high lateral and height resolution of the method. Due to the standard description of aspheres by their sag, the marker holes have a positive sign. Fig. 11 shows the measurement result of the freeform 2 surface. Both the low frequency topography error and the high frequency error contributions can be resolved and reconstructed by the algorithm.
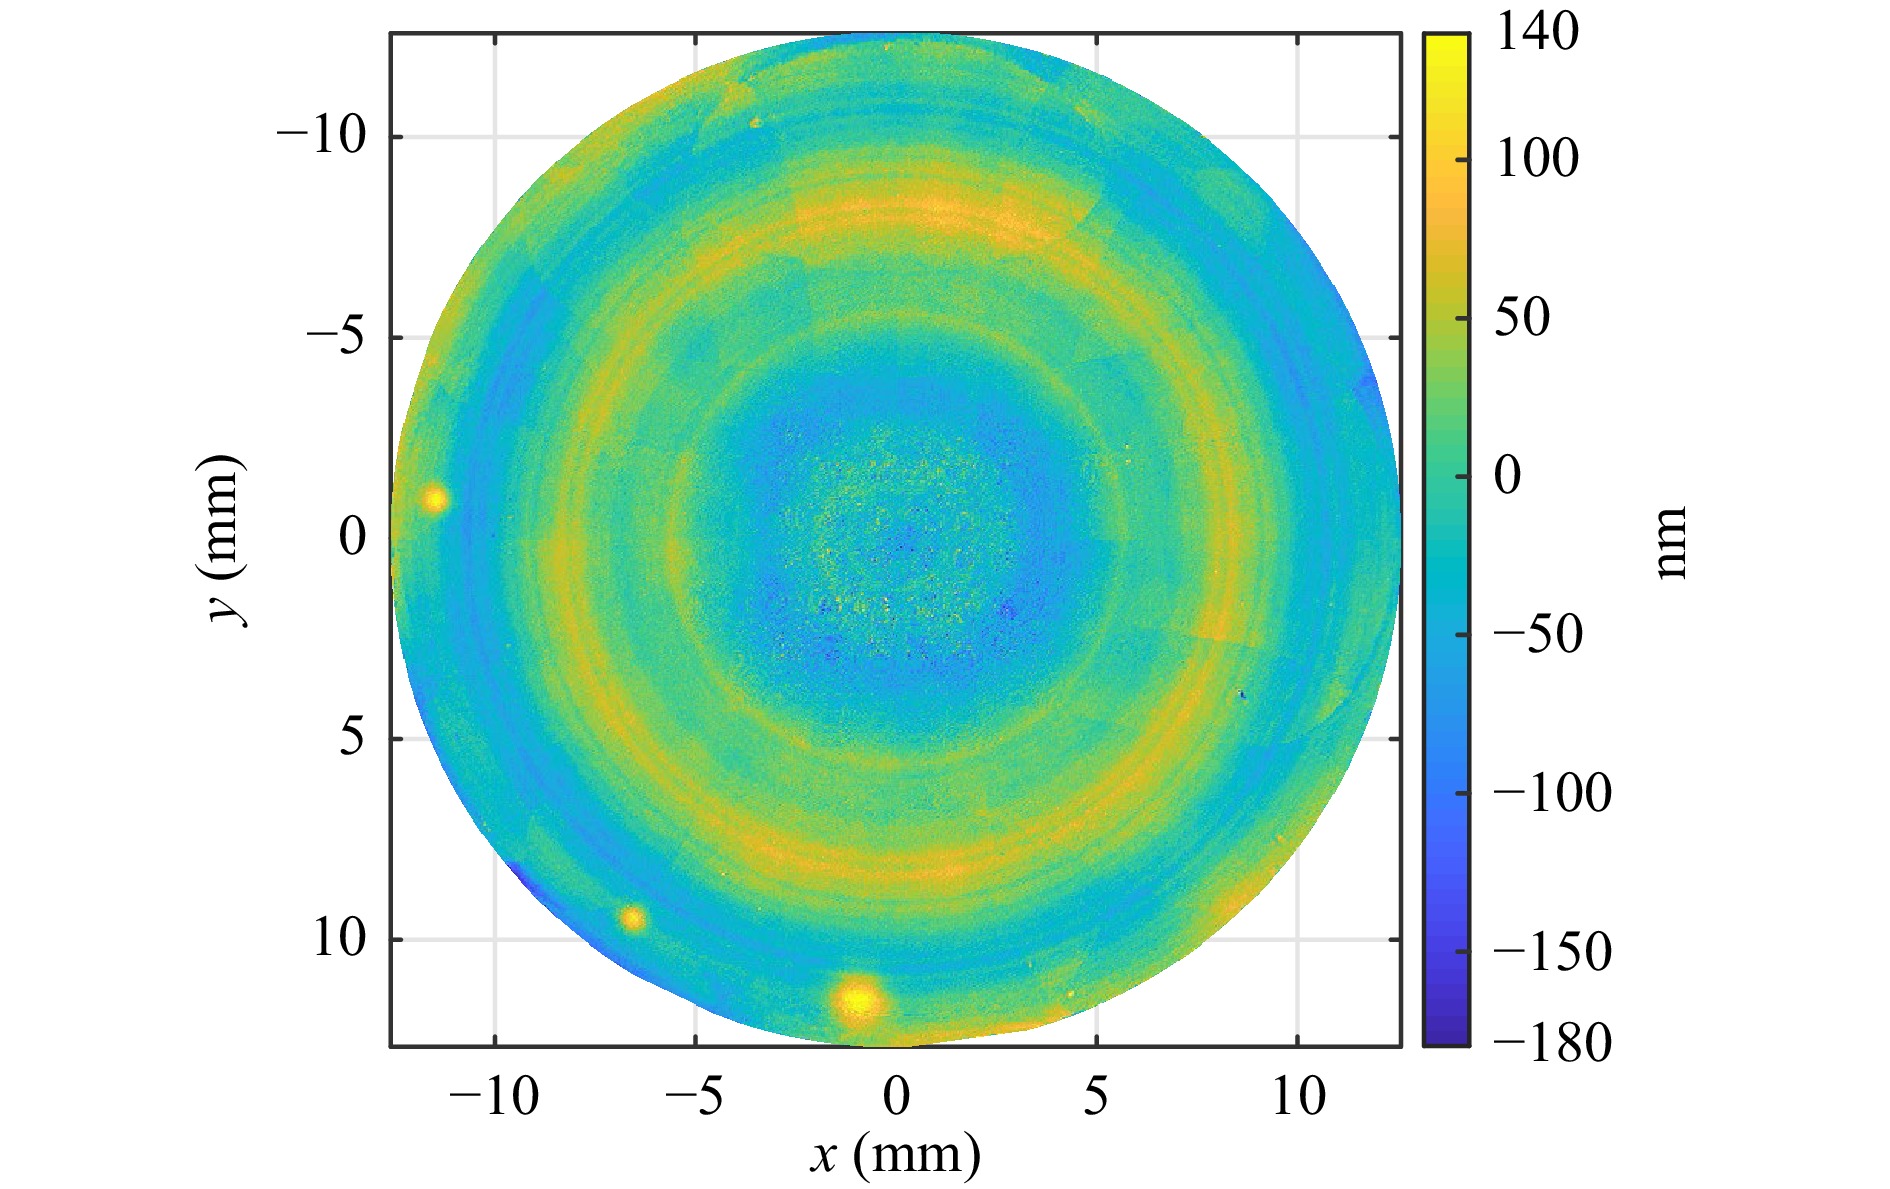
Fig. 10 Measurement result of the asphere 1.
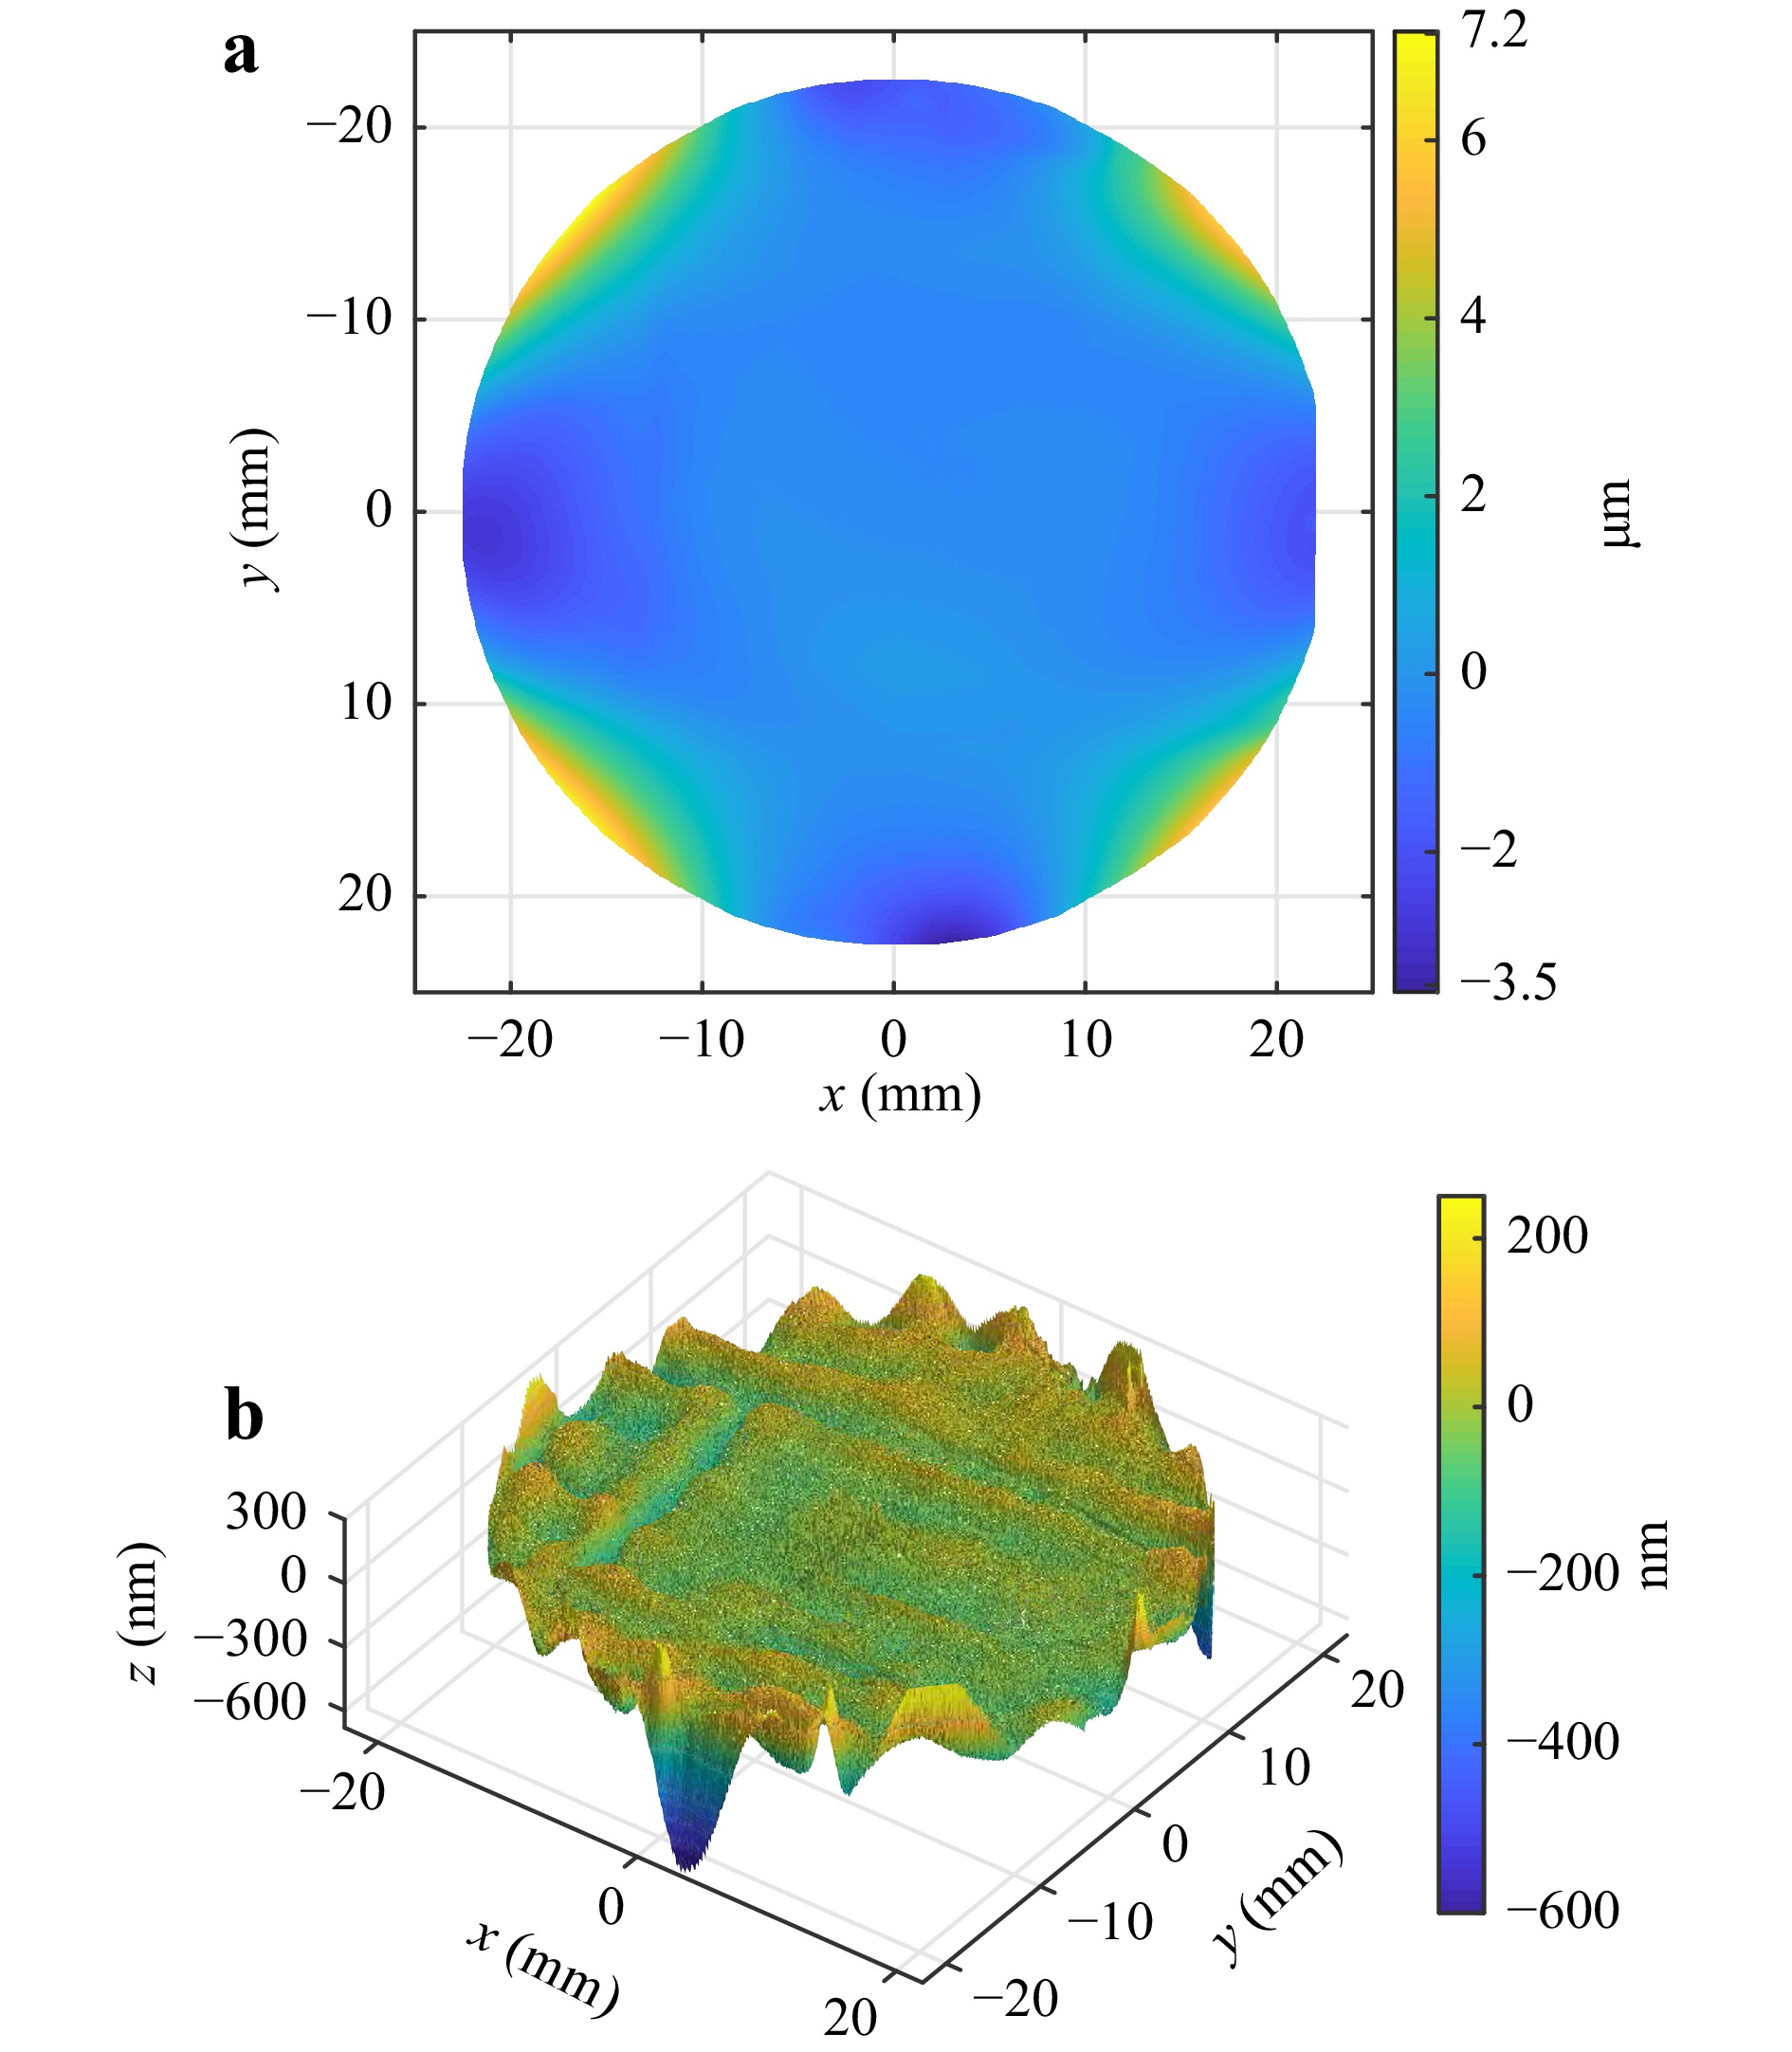
Fig. 11 Measurement result of freeform 2. a Surface error. b High frequency error after subtraction of 136 Zernike terms.
-
The main advantage of the Fizeau configuration is the common-path principle: Beam paths for measurement and reference are the same inside the interferometer. Therefore fluctuations due to air turbulences, acoustic disturbances and others are the same for measurement and reference beam path and cancel out. The effect is an improved phase stability. To investigate this effect quantitatively, successive phase images were acquired. A histogram over the difference of two phase images reveals the phase noise of the interferometer. The comparison of the phase noise of the Fizeau type TWI with the Twyman Green type were shown in25. Both phase differences were acquired with the same type of camera, the same exposure time and the same camera gain. The FWHM of the phase noise is thereby reduced by a factor of three for the Fizeau configuration. This improved stability also has an effect onto the evaluated measurements. To investigate this effect, full surface measurement evaluations of asphere 2 are gathered successively and the full surface difference is evaluated as in the phase noise measurement. Fig. 12 shows the evaluation results of two successive measurements and the difference for both configurations.
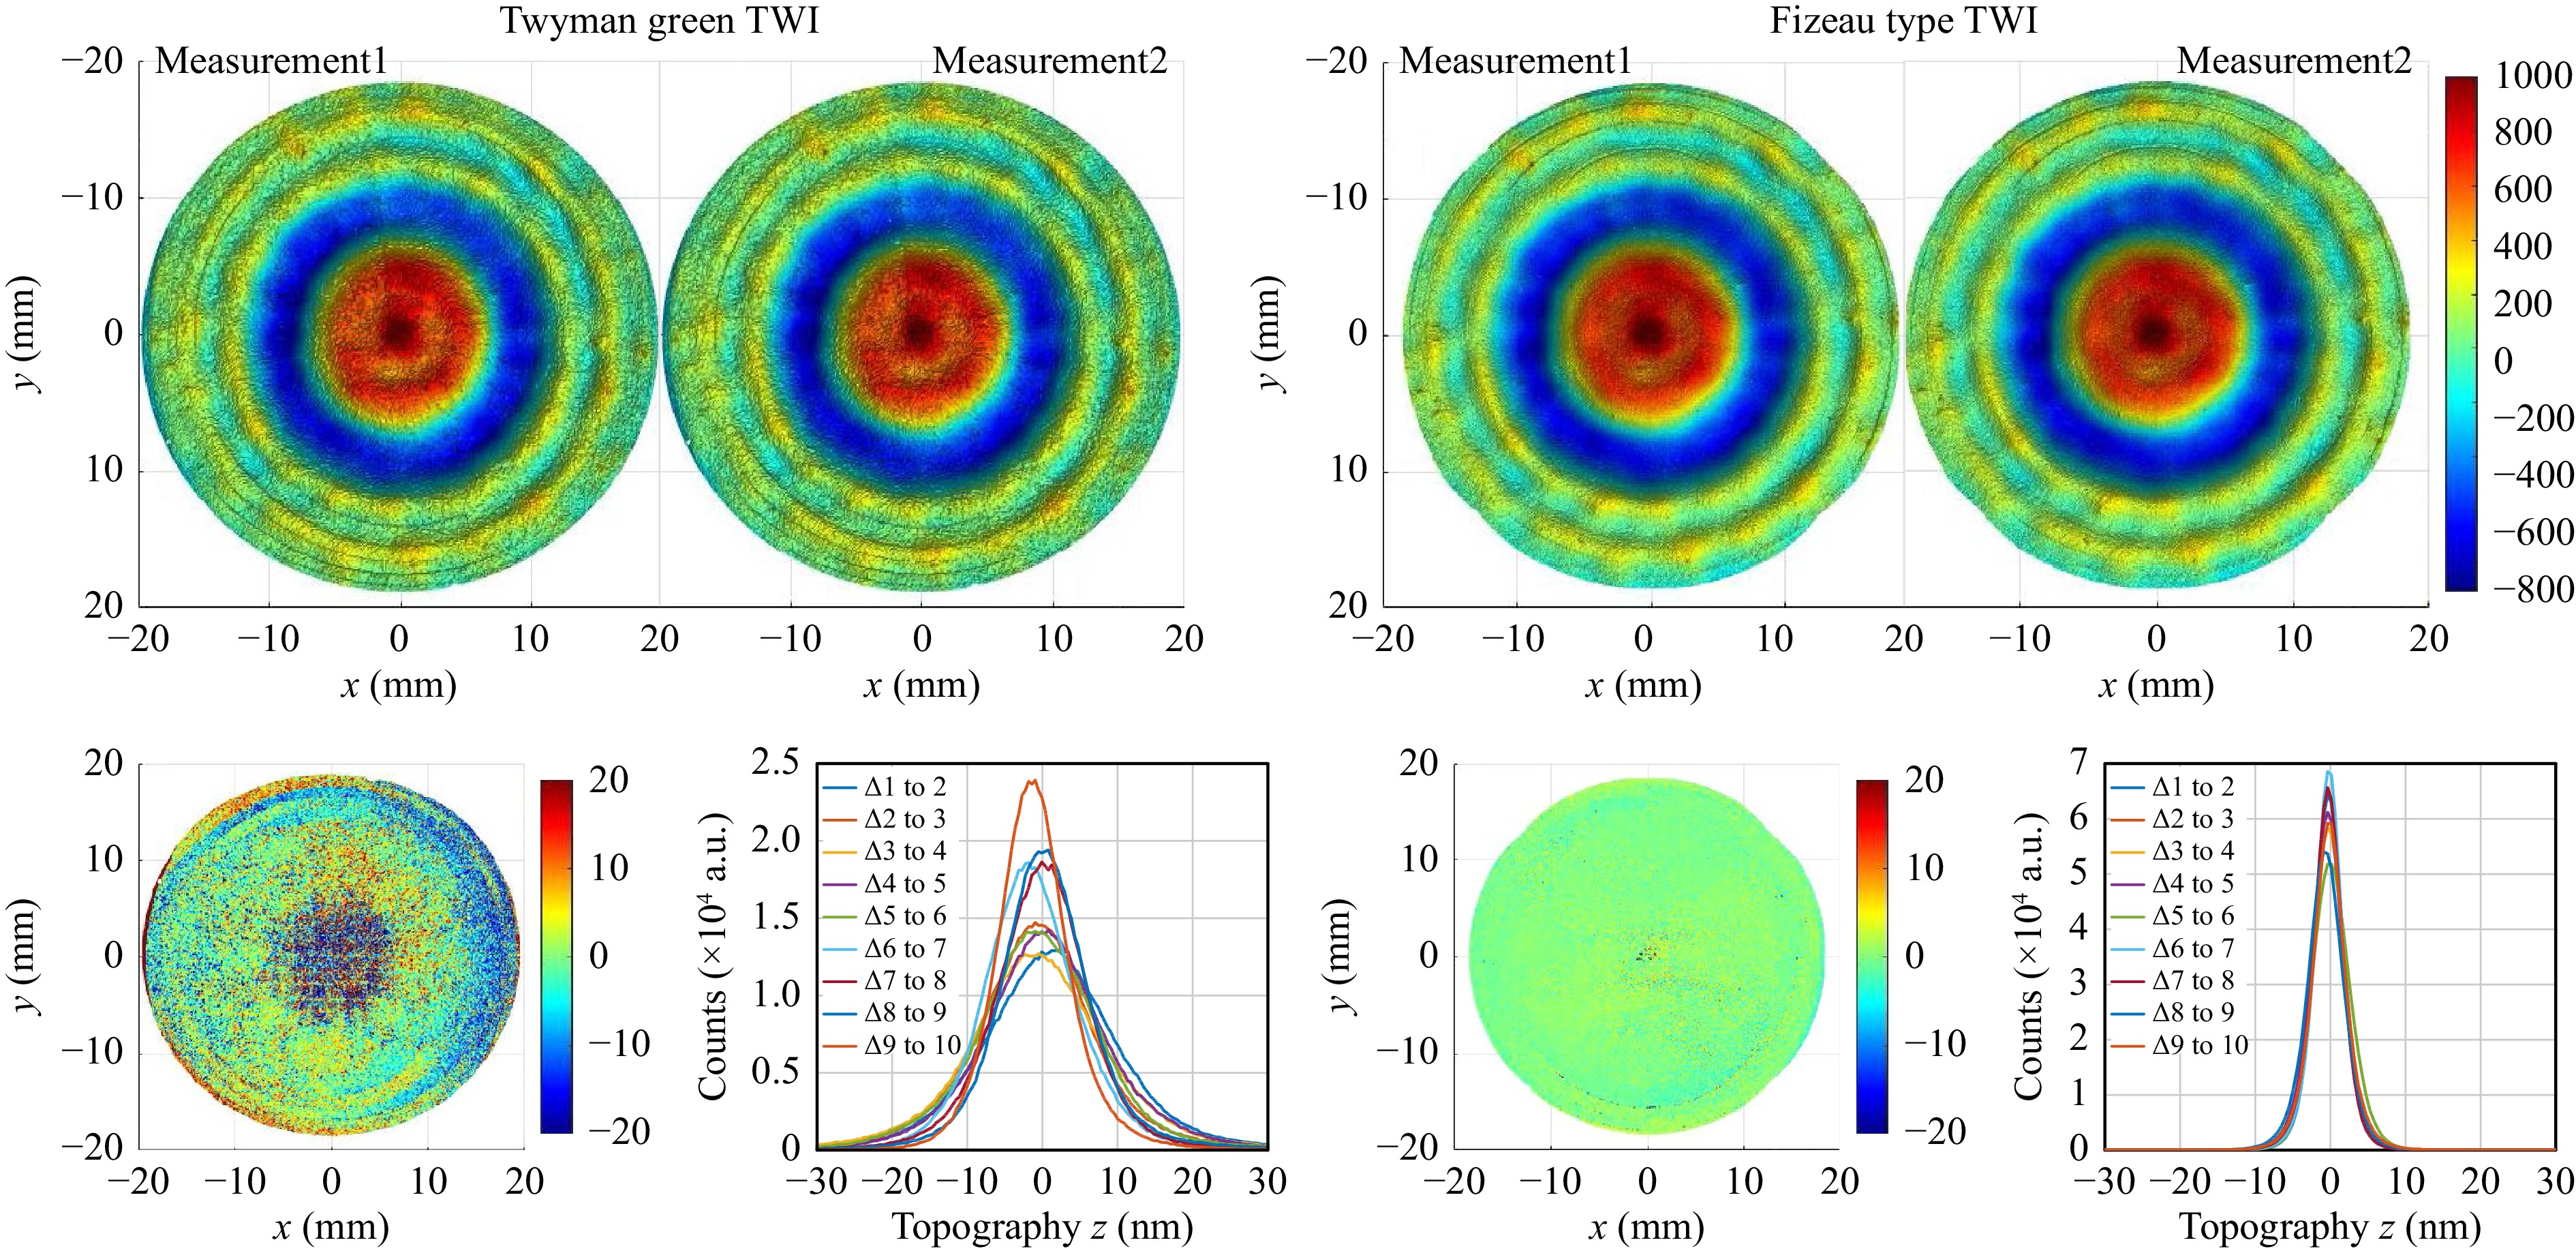
Fig. 12 Comparison of reproduction of measurement evaluations. Left upper: Measurement evaluations for two successive measurements in classical Twyman Green TWI configuration. Right upper: Measurement evaluations in Fizeau configuration. Lower: The corresponding differences and histograms over the differences of ten consecutive measurements.
-
The data indicates that with the new system we can achieve the same flexibility in measurement of aspheres and freeform surfaces as the classical TWI. One example is the freeform 1 with 1 mm freeform deviation from best fit sphere. High frequency error structures and markers are visible as well as the low frequency shape of the specimen. Histograms over the whole evaluation difference of two successive measurements of asphere 2 indicate a reduction in FWHM of topography noise of a factor three compared to the classical TWI. As expected the surface deviations in Fig. 12 measured with the two completely different systems show the same structural characteristics like rings and tooling marks as well as overall shape. A closer look reveals the lower noise as indicated in the histograms. Measurement data has the lack of a true value. Therefore, the virtual experiments show the effects of defined disturbances more clearly. For a bump shaped error on one of the system’s lenses the deviation of the reconstruction error is one order of magnitude smaller with the new Fizeau-type common-path TWI than with the classical Twyman-Green TWI system. The reason for this deviation lies already in the limited calibration of the non common-path TWI setup that can not describe the high frequency bump adequately. The Zernike error simulation gives more insight inside this behavior. In the diagrams of Fig. 8 only simulations from Zernike term number 40 to 65 are shown since below number 45 all aberrations can be calibrated with the standard procedure in both systems. The figure shows, that with the new Fizeau type interferometer higher order defects are vastly compensated and do not disturb the calibration and measurement. Therefore the specifications of the optical surfaces used in the interferometer optics can be considerably relaxed in comparison to the classical Twyman-Green TWI realization.
-
This paper presented a new realization of a lens-array based common-path Tilted Wave Interferometer that combines the high flexibility and high measurement speed of tilted wave interferometry with the robustness of Fizeau interferometry. We described the special role of the interferometer aperture and the mask array in the signal generation in the TWI. The new approach avoids disturbing multiple beam interferences with a new illumination scheme. The same principles can be applied to fiber based common-path TWI. An integral part of each tilted wave interferometer is the calibration algorithm. The new algorithm of the Tilted Wave Fizeau Interferometer considers four reference beams, one for each illumination configuration. Simulated measurements have shown that disturbances in the interferometer-light-path are self-compensated to a high degree. Compared to the classical Twyman-Green TWI configuration, this leads to better reconstruction results and the possibility to significantly relax the tolerances of the quality for the optics used. We have shown experimental measurements of two aspheres and a freeform surface as an example of the possibilities. The repeatability is reduced up to a factor of three in comparison to the classical Twyman-Green TWI configuration. The improved stability of the new approach will bring flexible optical testing of aspheres and freeform surfaces into close-to-production environments and will open the door to enhanced interferogram evaluation algorithms that help to improve traceability further.
-
We would like to acknowledge the funding by Mahr GmbH and the Deutsche Forschungsgemeinschaft (DFG) under the project number: 273678658.
Tilted Wave Fizeau Interferometer for flexible and robust asphere and freeform testing
- Light: Advanced Manufacturing 3, Article number: 48 (2022)
- Received: 20 June 2022
- Revised: 25 August 2022
- Accepted: 25 August 2022 Published online: 28 October 2022
doi: https://doi.org/10.37188/lam.2022.048
Abstract: Tilted Wave Interferometry (TWI) is a measurement technique for fast and flexible interferometric testing of aspheres and freeform surfaces. The first version of the tilted wave principle was implemented in a Twyman-Green type setup with separate reference arm, which is intrinsically susceptible to environmentally induced phase disturbances. In this contribution we present the TWI in a new robust common-path (Fizeau) configuration. The implementation of the Tilted Wave Fizeau Interferometer requires a new approach in illumination, calibration and evaluation. Measurements of two aspheres and a freeform surface show the flexibility and also the increased stability in both phase raw data and surface measurements, which leads to a reduced repeatability up to a factor of three. The novel configuration significantly relaxes the tolerances of the imaging optics used in the interferometer. We demonstrate this using simulations on calibration measurements, where we see an improvement of one order of magnitude compared to the classical Twyman-Green TWI approach and the capability to compensate higher order error contributions on the used optics.
Research Summary
Freeform measurement: Flexible and robust measurement with common-path interferometry
Complex shaped optical surfaces like aspheres and freeforms are key components in modern optic designs. The form measurement of these surfaces is a crucial part in the realization of modern systems. One technique for fast and flexible measurement is the Tilted Wave Interferometer. The researchers from the Institute of Applied Optics (ITO) from University of Stuttgart, Germany, present the first lens-array based realization of a Tilted Wave Fizeau Interferometer. The system involves a novel lightning scheme and a sophisticated calibration and evaluation process. Through the common-path principle, it is possible to reduce the repeatability in the measurements up to a factor of three compared to the classical TWI. The novel design also reduces the optics tolerances in the lenses used in the optic design of the instrument.


Rights and permissions
Open Access This article is licensed under a Creative Commons Attribution 4.0 International License, which permits use, sharing, adaptation, distribution and reproduction in any medium or format, as long as you give appropriate credit to the original author(s) and the source, provide a link to the Creative Commons license, and indicate if changes were made. The images or other third party material in this article are included in the article′s Creative Commons license, unless indicated otherwise in a credit line to the material. If material is not included in the article′s Creative Commons license and your intended use is not permitted by statutory regulation or exceeds the permitted use, you will need to obtain permission directly from the copyright holder. To view a copy of this license, visit http://creativecommons.org/licenses/by/4.0/.

 DownLoad: