


-
Silica optical fibers have attracted a lot of attention because they are widely used in communications and sensing, and forming today’s internet backbone. Driving much of the Internet-of-Things (IoT) evolution, optical fibers are expanding from a single function transmission technology to perform multiple functions and a growing need for various custom-design application-specific optical fibers. Current optical fiber manufacturing based on chemical vapor deposition (CVD) technologies together with stack-and-draw approaches used for structured optical fibers faces numerous challenges in enabling more complex geometries multimaterial composite fibers and multicore fibers. The additive manufacturing, or 3D printing, offers a solution to address all those challenges, and may potentially disrupt the optical fibers fabrication and bring in an evolution to IoT1-2.
The additive manufacture of optical fiber preforms and optical fiber has recently been proposed and demonstrated3-6. A key challenge of 3D printing-based silica optical fibers is the high processing temperatures of silica glass that conventional top down approaches demand. For this reason, we exploited and extended recent reports of small-scale glass “bulk or slice” printing7-15 beyond a few millimeters to centimeters16 to demonstrate it was possible to additively manufacture optical fibers. Further, various active dopants were introduced. These include oxides and ions of bismuth and erbium to create additively manufactured bismuth and erbium co-doped optical fiber (BEDF). These fibers are known to have an ultra-broadband near infrared (NIR) luminescence covering the whole telecommunications O-L bands with 830 nm pump excitation, potentially appearing to be a promising active medium of fiber amplifiers for the next generation of fiber communication system17-23.
In this letter, we report BEDFs with one and seven cores drawn from 3D printed preforms. The capability of 3D printing technology to produce complex and arbitrary fiber structures was demonstrated without the necessary time-consuming separation and integration processes involved in the traditional preform manufacture. In addition, a range of dopants, namely Bi3+, Er3+, Ge4+, Ti4+ and Al3+ are introduced, further proving its diverse materials manufacturing capability. Care is needed in adjusting drawing conditions and method as the number of cores increases, leading to effective lower melting points in the preform.
As reported in ref. 16, the fabrication of 3D printed preforms involved five steps: (1) preparing UV sensitive resin embedded with amorphous silica nanoparticles; (2) printing designed preform utilizing a commercial DLP 3D printer; (3) filling the prepared resin into the holes of the printed cladding preform followed by thermal-polymerization; (4) debinding and pre-sintering process driven by annealing to remove moisture and polymer support and pre-fusing of nanoparticles; and (5) higher temperature sintering to further remove impurities and fuse silica nanoparticles into glass during fiber drawing. The fiber preforms with structures of one and seven cores shown in the first row of Fig. 1e were first designed using AutoCAD. The inner d and outer D diameters of the fiber preforms are d = 3 mm and D = 22 mm, respectively. The distance between two closest cores Λ is 5 mm and the preform length L is 40 mm. The designed preforms were then loaded into a 3D direct light projection (DLP) printer (Asiga Australia: model PRO2). The preforms were printed 2D layer-by layer using near UV light (λ = 385 nm) translated in the vertical direction. The main printing parameters are UV light intensity IUV, UV curing time tcuring and layer thickness τ, which are IUV = 5.8 mW/cm2, tcuring = 3.5 s, and τ = 75 μm, respectively.
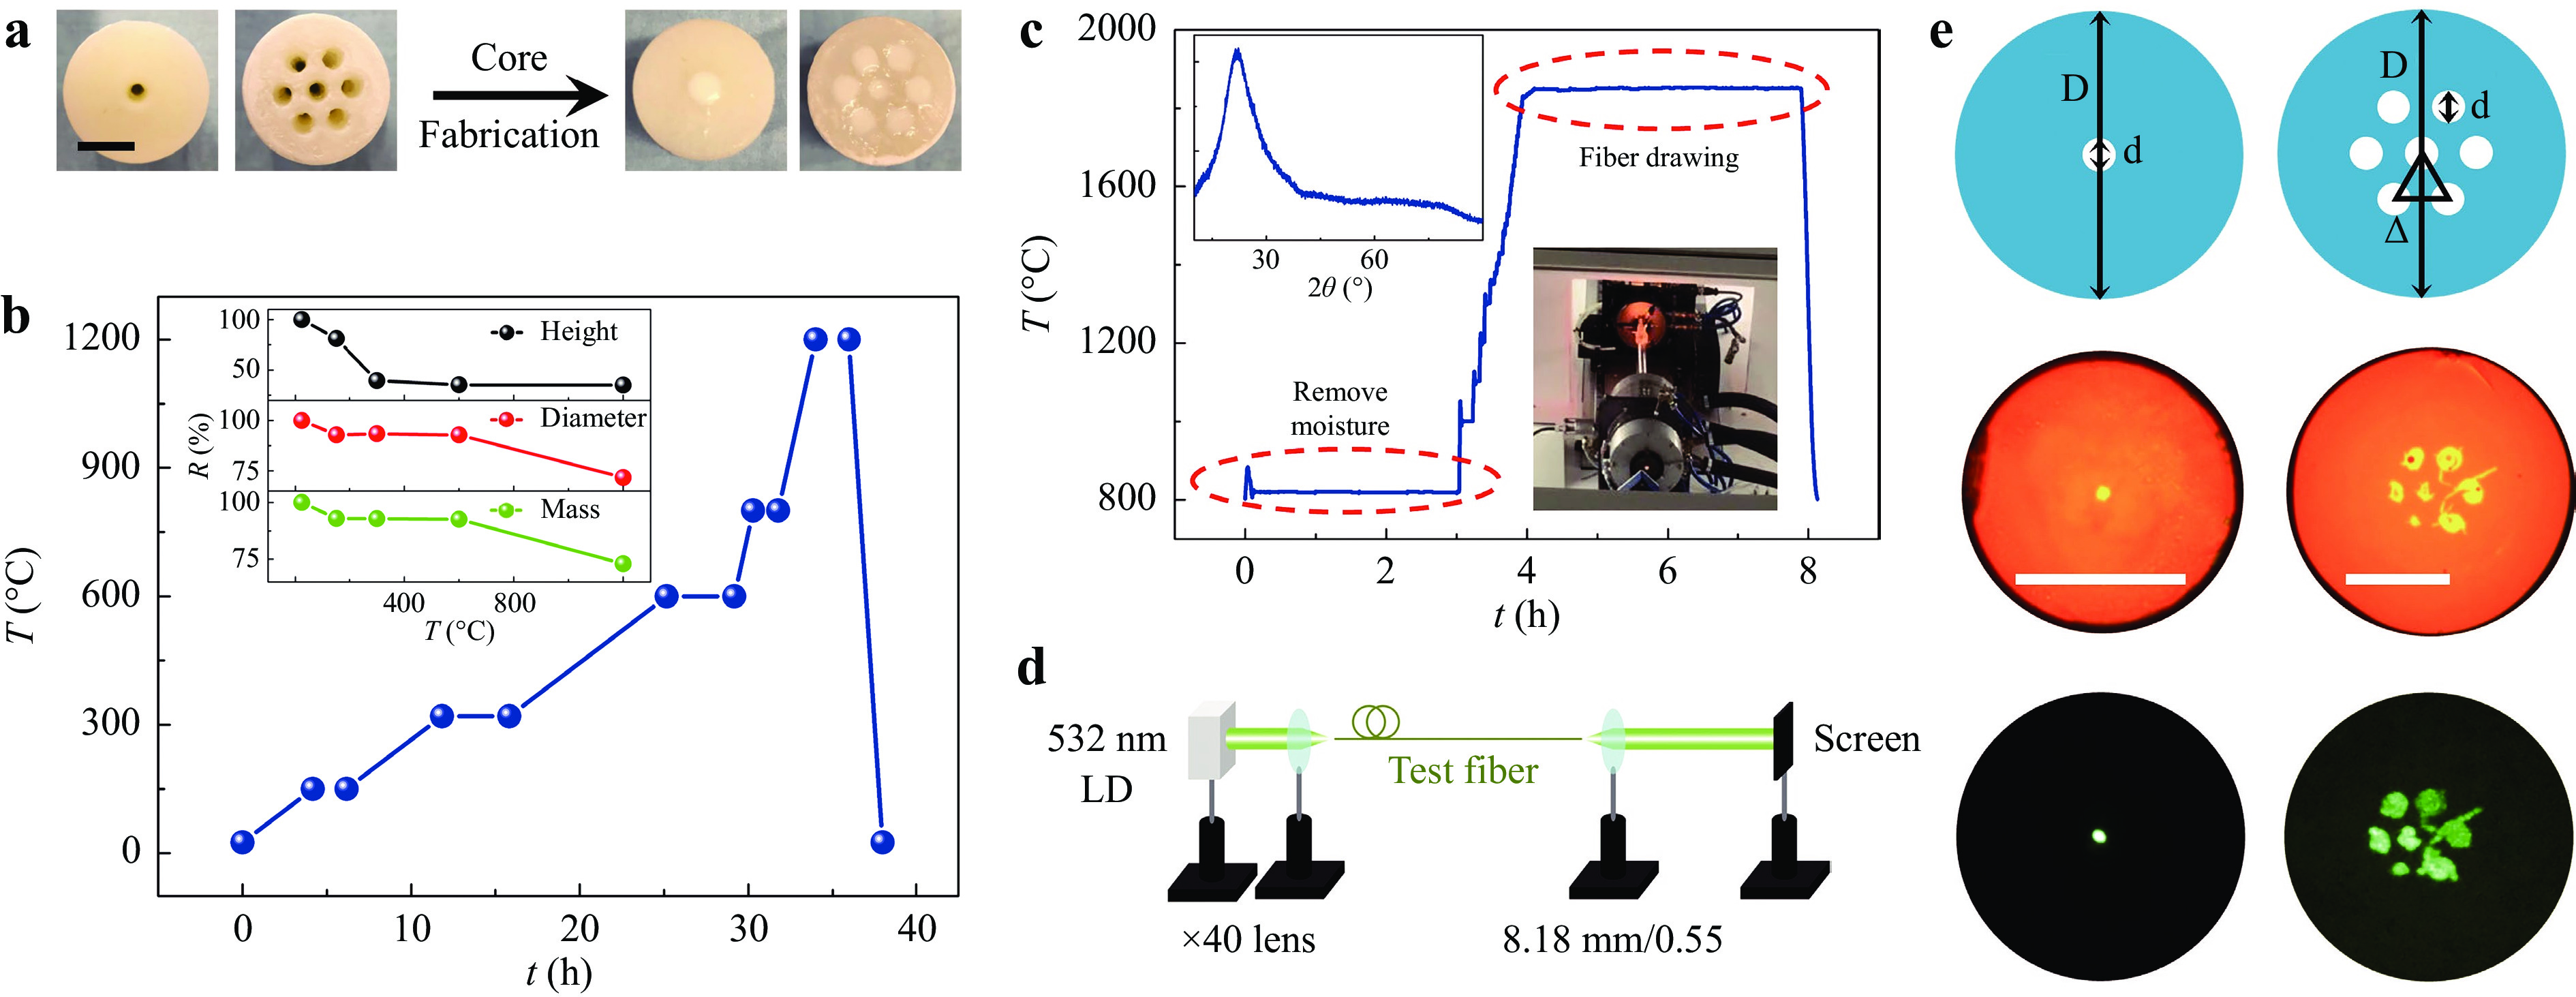
Fig. 1 a Images of the 3D printed preforms (left) and subsequently filled cores (right), the scale bar is 10 mm; b Temperature setting of the preform debinding process. Inset is the remaining ratio of mass and size during the debinding process; c Temperature change of the fiber drawing process. Insets are the XRD pattern of the drawn fiber and the photo of the drawing tower; d Experimental setup for transmission pattern measurement with a 532 nm laser diode (LD); e Designed preform structures (first row), fiber cross-section images recorded by a microscope with 50 μm scale bar (second row) and the transmission output pattern of the BEDFs projected onto a screen (third row).
The composition of the resin used for preform fabrication is described in the Method section. The fabricated preforms were annealed to remove moisture and then sintered to debind the polymer resin using a high temperature furnace (Furnace Technologies Australia, 1700 M). The preforms were heated up to T = 150, 300, 600, 800 and 1200 ℃ for 2, 4, 4, 1.5 and 2 hrs, with the heating rate of 0.5 ℃ /min and 3 ℃ /min, respectively, before and after T = 600 ℃. The mass, diameter and height changes of the fiber preforms were also investigated during the debinding process as demonstrated by the inset of Fig. 1b. The mass of the preforms decreases when the debinding temperature is under T < 600 ℃, and then is unchanged in the following process. This is consistent with removal of the polymer and other impurities at T < 600 ℃. When annealed at higher temperatures (T > 600 ℃) the preforms begin to shrink, the shrinkage of preform diameters and heights were around 28% and 27% respectively from T = 600 ℃ to 1200 ℃, as shown in the inset of Fig. 1b. If the preform were completely sintered to the dense glass state, the theoretical shrinkage would be 34%24-25. The temperature process of 600−1200 ℃ in this experiment was only to densify the fiber preform and improved its mechanical strength for the next step of fiber drawing, rather than sintering the preform into a glass, therefore the shrinkage was smaller than the theoretical value.
The preform after debinding was inserted into a Heraeus F300 quartz tube and drawn into the fiber using a commercial fiber drawing tower. The temperature during the whole fiber drawing process was logged during drawing shown in Fig. 1c. Similar to the previous work16, the drawing temperature and pressure are kept to T = 1850 ℃ and P = 50 mbar, respectively. The fiber preform was heated to T = 810 ℃, and kept for 3 hrs at a pressure of P = 50 mbar for removing the moisture absorbed by the preform due to the porous structure during storage. The inserted X-ray diffraction (XRD) pattern was obtained by using the powdered 3D-printed BEDF without coating.
An optical assessment was carried out of the cores of the BEDFs. The cross-section microscopy images of two kinds of BEDFs are shown in the middle row of Fig. 1e. In all cases the core is not perfectly circular. As for the seven cores BEDFs, although multicore structures are kept, crack and shrinkage are noticed. It appears that the cores have physically displaced, reflecting a poor fit of the preform with the Heraeus tube and a too high fiber drawing temperature. To determine the element distribution of the fiber core and cladding after the high-temperature drawing, electron probe micro-Analysis (EPMA) was performed on the 7-core cross section shown in Fig. 2a. The Ge and Ti distributions are in the core whereas the Si is located as expected in both the core and cladding areas, shown in Fig. 2b−d. The Bi and Er were not detected because the concentrations were too low. A hole is presented in one of the cores which arises owing to the air bubbles entrapped during the fiber drawing and may be eliminated via the optimization of the fabrication process.
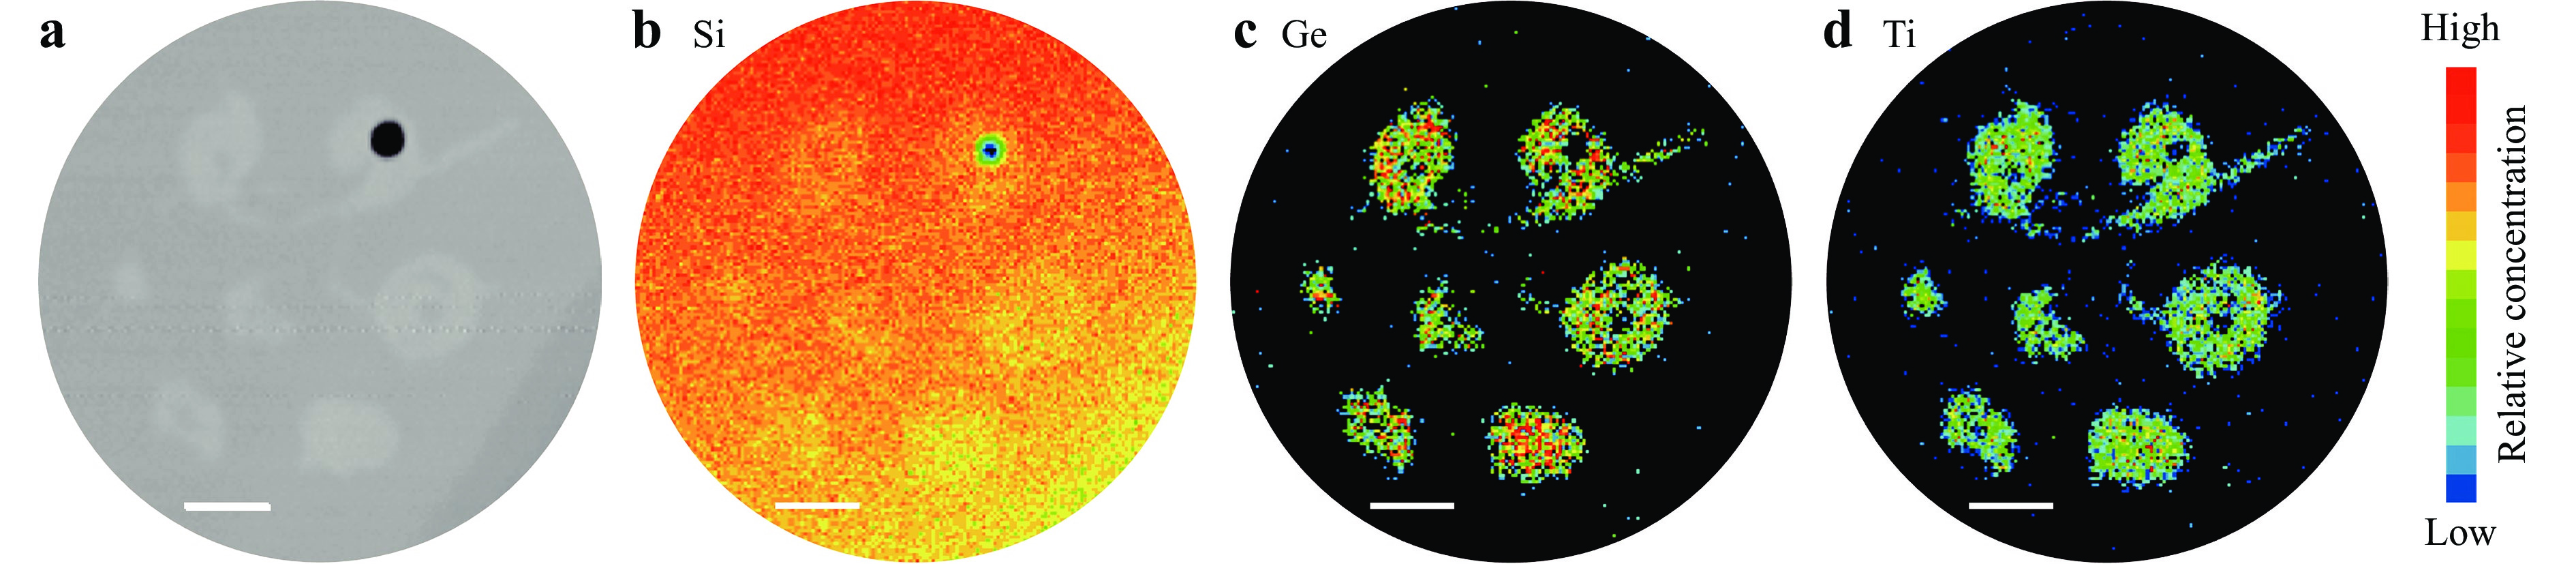
Fig. 2 a Cross-sectional view of 7 cores BEDF, b−d EPMA-WDS mappings of different elements from the cross section (scale bar: 10 μm).
The three-dimensional refractive index of BEDFs was further measured with a SHR-1802 optical fiber index analyzer. The refractive index difference between core and cladding is obvious in the seven cores BEDFs, despite the existence of the melted state of the core and cladding due to excessive temperature during the fiber drawing process, shown in Fig. 3b. The maximum refractive index difference between the core and the cladding is
$ \Delta n \sim 0.01 $ in the single core BEDF, demonstrated in Fig. 3a. The cut-off wavelength was estimated to be$ {\lambda _c} \sim 800\;{\rm{nm}} $ for the single core BEDF with the core diameter of d ~ 3.5 μm as shown in Fig. 3a, where the measured cutoff was located at$ \lambda \sim 757$ nm. The value is smaller than the target one (${\lambda _c} \sim 1000\;{\rm{nm}}$ ) based on material concentrations because of material evaporation during the fabrication process, a quantity that can be taken into account in subsequent pulls.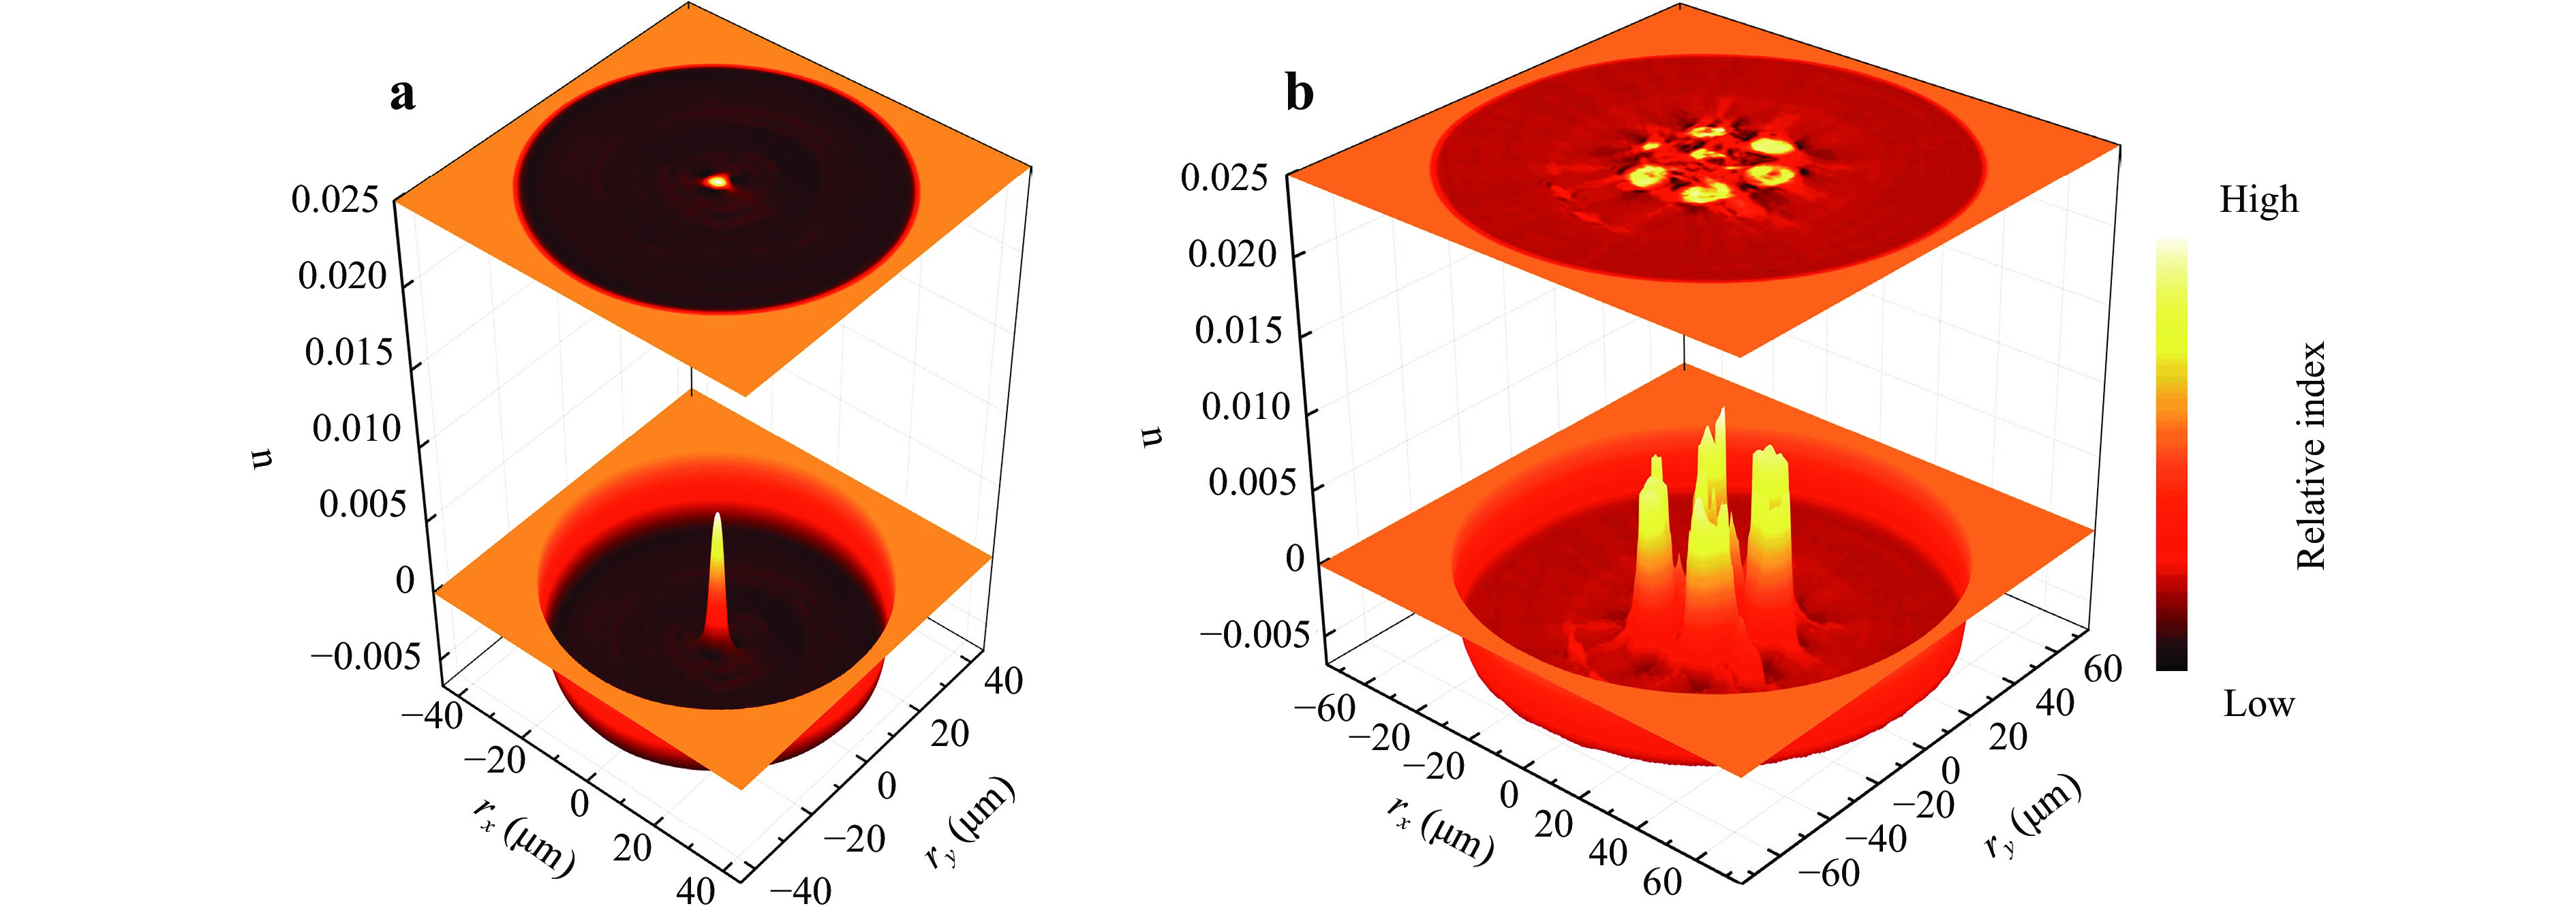
Fig. 3 Three-dimensional refractive index profiles of a single and b seven cores BEDF.
In addition, the fiber loss was measured by the cutback over the wavelength range of λ = 750−1600 nm, the experimental configuration and the loss spectrum of the single core BEDF are shown in Fig. 4a, b. Four absorption peaks are clearly observed. The absorption at λ = 810 nm is attributed to a third water overtone and possibly a bismuth active center related to a speculative Si (BAC-Si)23. At λ = 1535 nm the absorption is due to Er3+26. However, the absorption peak of Er3+ is not particularly significant because of the relatively low doping concentration. Another absorption peak at λ = 980 nm is characteristic of a second overtone band of water ~ 1 um and may have a component from a center related to Al (BAC-Al) 23 and Er3+26. The similar situation occurs at the absorption peak at λ = 1380 nm, for which the absorption of BAC-Si overlaps with the first OH overtone is responsible. It is worth noting that the absorption at λ = 1380 nm is α ~ 12.7 dB/m, an improvement over previous results for a germanosilicate fiber (α ~ 20.9 dB/m at 1380 nm)16 where moisture and background scattering due to core asymmetry gives rise to an additional loss of ~ 8.0 dB/m. It’s worth noting that the optical fiber in this report was doped with bismuth compared to the dopants-free optical fiber in Ref. 16, to be precise, the loss difference was at least 8 dB/m because of losses related with the doping of bismuth. This reduction is simply the removal of that component with an additional annealing at 810 ℃ during the fiber drawing process27. The losses of three cores in the seven cores BEDF were individually tested at 632.8 nm using a He-Ne laser, labeled with yellow font in the Fig. 4b. The single core fiber has a smaller loss, while the multicore fibers have greater losses partly because the presence coupling between the cores. Besides, some of the cores are so asymmetric that they have turned into a tubular shape, resulting in nontrivial scattering from both the inside and outside of the cores. This is direct evidence of flowing and the drawing temperature being well above the melting temperature of the preform.
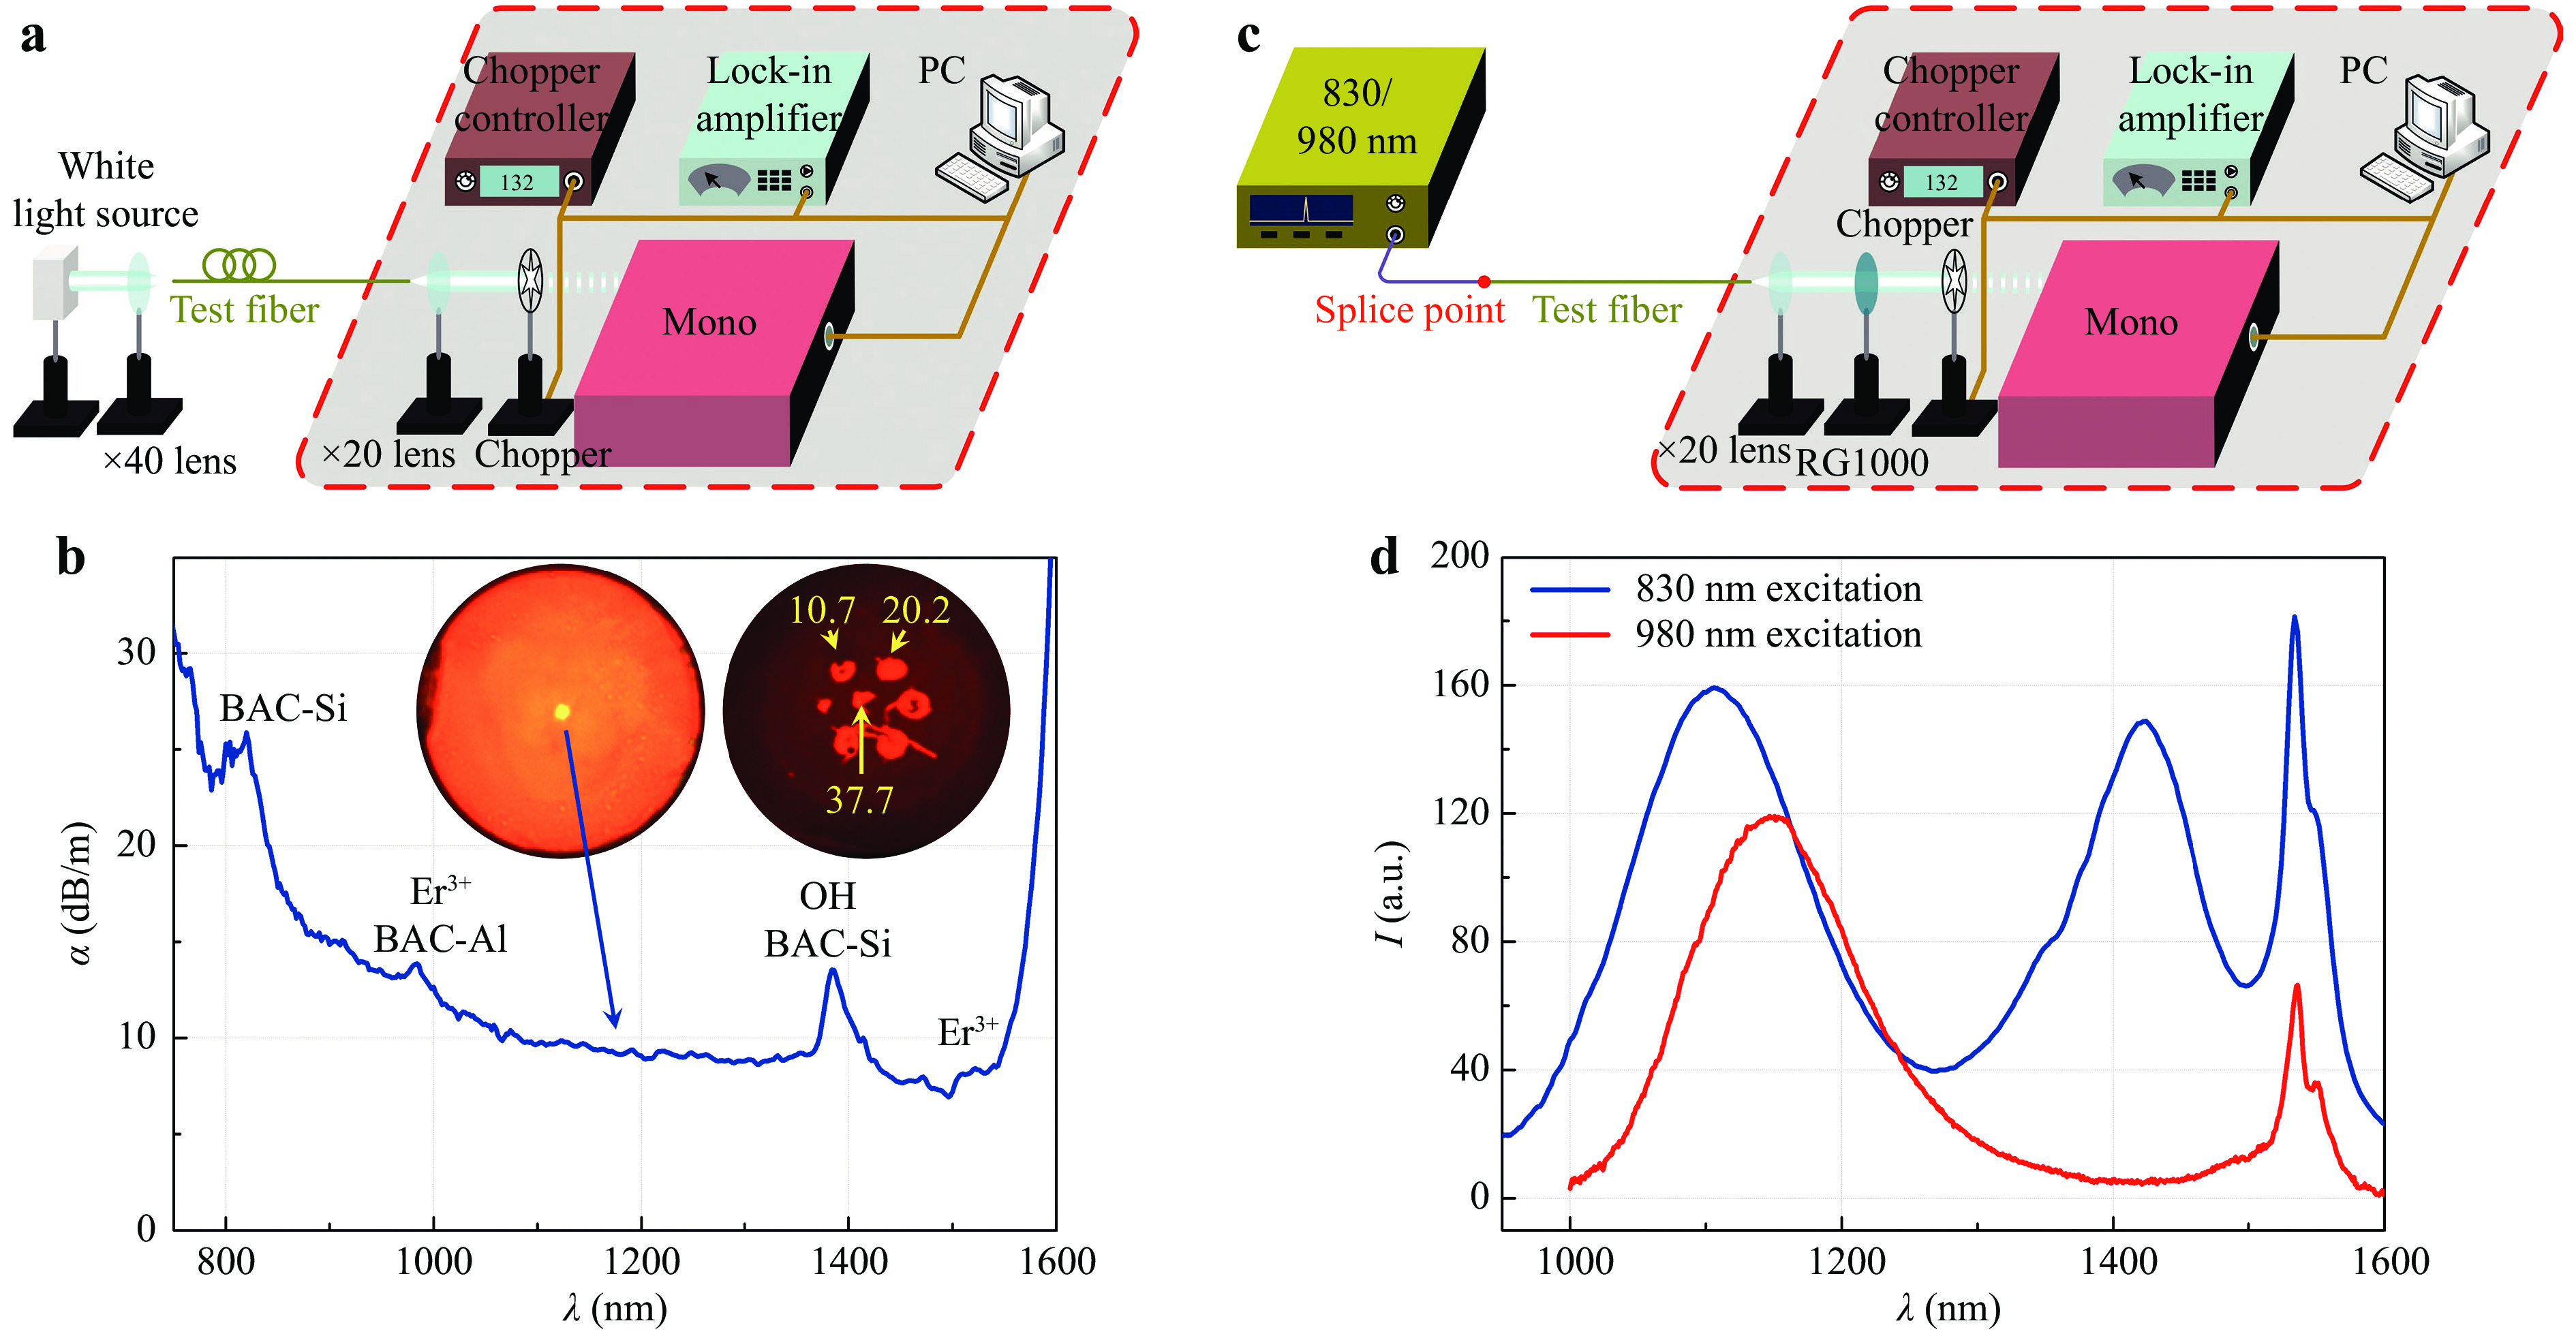
Fig. 4 a Experimental configuration of loss measurement by the cut-back method; b loss spectrum of the 3D printed single core and seven cores BEDFs; c experimental configuration of the emission measurement of a single core BEDF; d emission spectra of a single core BEDF excited by the 830 nm and 980 nm lasers.
The luminescent spectra obtained by pumping at λ = 830 nm and 980 nm were recorded with a monochromator and a photodetector, as shown in Fig. 4c. A lock-in amplifier was used to boost the signal to noise ratio. For the λ = 830 nm excitation, there are three luminescence bands over λ = (1000−1600) nm - see Fig. 4d. The first two peaks are located at λ = 1100 nm and λ = 1420 nm with bandwidths of
$ \Delta { \lambda }_{FWHM} $ = 150 nm and$ \Delta { \lambda }_{FWHM} $ = 100 nm, attributed to the BAC-Al and BAC-Si respectively17,23. The λ = 1535 nm peak with$ \Delta { \lambda }_{FWHM} $ = 32 nm is attributed to the Er3+: 4I13/2 → 4I15/2 transition. Similarly, two peaks at λ = 1150 nm$ \Delta { \lambda }_{FWHM} $ = 148 nm and λ = 1535 nm with$ \Delta { \lambda }_{FWHM} $ = 28 nm under the λ = 980 nm pumping are attributed to the BAC-Al and Er3+ emissions, respectively. The wider FWHM and the peak shift with different excitations of BACs show typical unshielded d-d transitions of bismuth ions. The mode of single core BEDF was analyzed at the emission peaks where λ = 1100, 1420 and 1530 nm. Only LP01 mode exists, and the mode distributions are demonstrated in Fig. 5a−c. The mode fields are still elliptical as determined by the shape of the fiber core. The long/short axis of the mode field diameters are 5.2/ 5.0, 6.9/ 6.6 and 7.6/ 7.4 μm at 1100, 1420 and 1530 nm, respectively.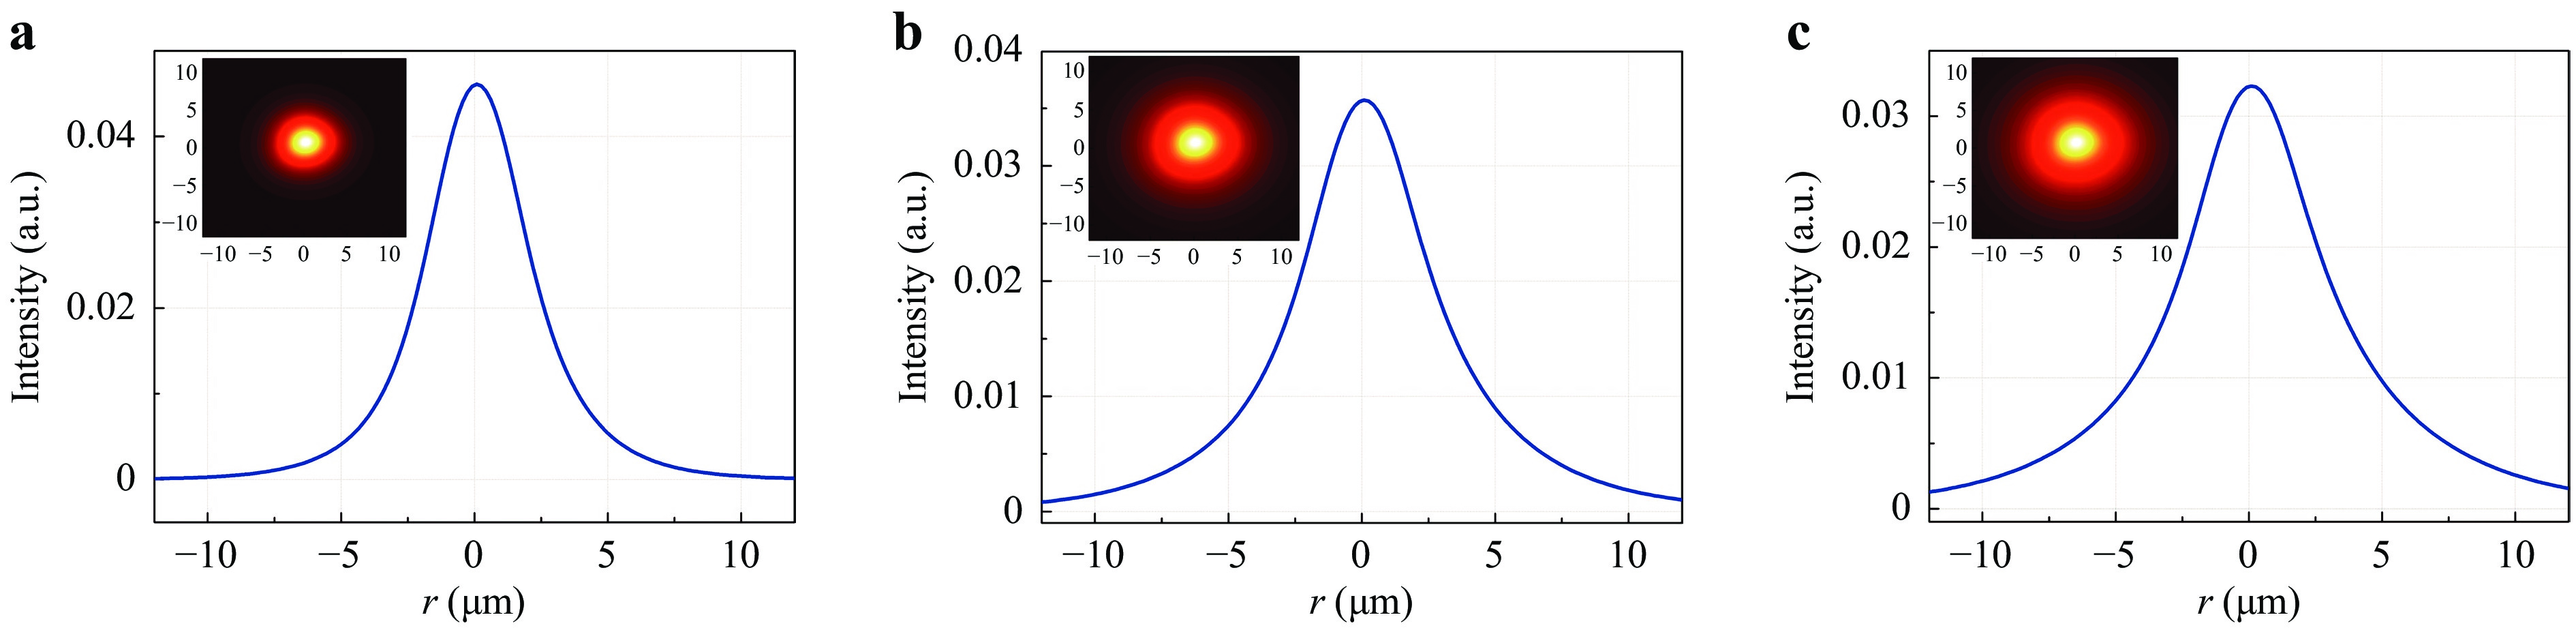
Fig. 5 Mode analysis at a 1100, b 1420 and c 1530 nm of the single core BEDF.
In summary, bismuth and erbium co-doped optical fibers with single- and seven-cores were drawn from 3D printed preforms. We show that the asymmetry arises principally from too high temperature and melting of the core and cladding of the preform within the Heraeus silica tube. The broadband NIR luminescence is obtained under the 830 nm and 980 nm excitations. The fiber loss in the single core fiber is substantially reduced as compared to the previous reports most likely due to a) the removal of water via the additional annealing and sintering treatment, and b) the improved symmetry due to the better shape match between the preform and the Heraeus tube. 3D printing technology promises to revolutionize specialty optical fibers permitting new functionalities. For example, it can easily realize multicore fiber fan-in/fan-out or ideal mode coupling in space division multiplexing without any splicing.
-
2-hydroxyethyl methacrylate (HEMA), 2-phenoxyethanol (POE), tetra(ethylenglycol) diacrylate (TEGDA), diphenyl(2,4,6- trimethylbenzoyl) phosphine oxide (DPO), hydroquinone, GeO2, TiO2, Bi2(Al2O4)3, ErCl3 and 2,2-azobis(2-methylpropionitrile) (AIBN) were purchased from Sigma-Aldrich Australia. Amorphous SiO2 nanoparticles with a mean diameter of 40 nm was bought from Evonik Australia labeled as Aerosil OX50.
-
For the fiber cladding, 37.39% amorphous SiO2 nanoparticles, 36.91 wt% HEMA, 19.04 wt% POE, 6.35 wt% TEGDA, 0.20 wt% DPO and 0.10 wt% hydroquinone were blended to the photosensitive resin, then shaped by the Asiga PRO2 3D printer. During this process, amorphous SiO2 nanoparticles are the backbone of the preform, HEMA and POE are the monomer and dispersant, which allows the high amounts of silica nanoparticles dispersion owing to the formation of a solvation layer, without using further additives7. TEGDA, DPO and hydroquinone are the crosslinker, photoinitiator and inhibitor, respectively.
For the fiber core, 32.16% amorphous SiO2 nanoparticles, 1.20 wt% GeO2, 0.84 wt% TiO2, 0.116 wt% Bi2(Al2O4)3, 0.014 wt% ErCl3, 38.57 wt% HEMA, 19.90 wt% POE, 6.65 wt% TEGDA, 0.20 wt% DPO, 0.10 wt% hydroquinone and 0.25 wt% AIBN were mixed as the core resin. The combination of Bi and Er can provide an ultrabroad luminescence band covering the low loss telecommunication O-L band of silica fibers, thus the Bi and Er codoped active fibers hold potential to be used as an all-in-one broadband fiber amplifier to overcome the current internet communication traffic jam. However, the single doping of any of these ions would not have such a wide band luminescence17,23. The reason for using Bi2(Al2O4)3 instead of BiCl3 was the early combination of bismuth and aluminum may help to improve the luminescence and stability of bismuth active center related aluminum. GeO2 was used to increase the refractive index of the core region forming the waveguide structure. TiO2 can form [TiO4] tetrahedron and [TiO6] octahedron structures in the fiber, enriching the fiber structure and thus being conducive to the broadband luminescence. It is worth noting that TiO2 also increases the refractive index of the fiber core, so it is necessary to control the contents of TiO2 and GeO2 to avoid the refractive index difference between the fiber core and the cladding becoming too large. Al2O3 is designed to form bismuth active center related aluminum to provide luminescence at the central wavelength of 1100 nm and as the disperser to avoid the clustering of Er and Bi ions. The core material was poured into the channels of the printed cladding preform and cured at T = 60 ℃ and 90 ℃ for 2 hrs and 0.5 hrs, respectively16. The images of the preforms after 3D printing and after core materials filling are shown in Fig. 1a.
-
The diffraction patterns were recorded using an X-ray diffractometer (D/MAX2550VB/PC, Rigaku Corporation, Japan) with CuKa irradiation over the angular range of
$ {\rm{10^\circ }} \le {\rm{2}}\theta \le {\rm{90^\circ }} $ . The EPMA images were measured by an electron probe microanalyzer (EPMA-1600, Shimadzu, Japan) with a wavelength-dispersive X-ray fluorescence spectroscopy (WDS). The refractive index and mode analysis were obtained from an optical fiber refractive index analyzer (SHR-1802, Shanghai University, China).Transmission output patterns of kinds of BEDFs were obtained using the setup shown in Fig. 1d, 532 nm LD was launched into the test fiber (~1 m) through × 40 microscope objective, then passed another microscope objective with the parameter of 8.18 mm/0.55 to image on the black screen. Loss spectrum of the single core BEDF was measured by cutback, shown in Fig. 4a. The white light was launched into the test fiber (~ 1 m) through a × 40 microscope objective, then chopped using a constant frequency, split by a monochromator and the optical signal converted to electrical signal through an InGaAs photo detector. Finally, the signal was amplified by a lock-in amplifier and recorded by a computer. The losses of three cores in the seven cores BEDF were also measured by cutback. The He-Ne laser was launched into each core one by one through the same microscope objective, and the output power recorded by a power meter. The emission spectra of the single core BEDF (~ 5 cm) were measured by the same monochromator system under excitation with 830 or 980 nm fiber laser respectively.
-
Authors are thankful for the two LIEF grants (LE0883038 and LE100100098) by Australian Research Council (ARC) to fund the National Fiber Facility at UNSW, Sydney. The National Science Foundation of China for grant (61775045). The Youth Program of National Natural Science Foundation of China for grant (62105078). The Youth Program of Natural Science Foundation of Shandong Province of China for grant (ZR2021QF009). Y. Chu and X. Fu also thank the support of the China Scholarship Council (CSC No. 201706680054 and 201708130199). Authors also thanks Dr C. Yan of Shanghai University for the measurements of refractive index and mode areas of BEDFs. JC acknowledge private funding of this work.
Additive Manufacturing Fiber Preforms for Structured Silica Fibers with Bismuth and Erbium Dopants
- Yushi Chu1, 2, 3, 4,
- Xinghu Fu1, 5,
- Yanhua Luo1,
- John Canning2,
- Jiaying Wang1,
- Jing Ren3,
-
Jianzhong Zhang3, ,
 ,
, -
Gang-Ding Peng1, *, ,
- Light: Advanced Manufacturing 3, Article number: (2022)
- Received: 11 November 2021
- Revised: 21 February 2022
- Accepted: 23 February 2022 Published online: 09 March 2022
doi: https://doi.org/10.37188/lam.2022.021
Research Summary
3D printing silica optical fiber: evolution to IoT
Silica optical fibers have attracted considerable attention because they are widely used in communications and sensings, and forming today’s internet backbone. Driving much of the Internet-of-Things (IoT) evolution, optical fibers are expanding from a single function transmission technology to perform multiple functions and a growing need for various custom-design application-specific optical fibers. Current optical fiber manufacturing based on chemical vapor deposition (CVD) technologies together with stack-and-draw approaches used for structured optical fibers faces numerous challenges in enabling more complex geometries multimaterial composite fibers and multicore fibers. The additive manufacturing, or 3D printing, offers a solution to address all those challenges, and may potentially disrupt the optical fibers fabrication and bring in an evolution to IoT.


Rights and permissions
Open Access This article is licensed under a Creative Commons Attribution 4.0 International License, which permits use, sharing, adaptation, distribution and reproduction in any medium or format, as long as you give appropriate credit to the original author(s) and the source, provide a link to the Creative Commons license, and indicate if changes were made. The images or other third party material in this article are included in the article′s Creative Commons license, unless indicated otherwise in a credit line to the material. If material is not included in the article′s Creative Commons license and your intended use is not permitted by statutory regulation or exceeds the permitted use, you will need to obtain permission directly from the copyright holder. To view a copy of this license, visit http://creativecommons.org/licenses/by/4.0/.

 DownLoad: