


-
Digital holography has previously been used in the 3D metrology of particles, oil droplets, plankton, and other sea creatures1−5. Expanding the recording volume to obtain information on 3D mosquito flight behaviour behind a bednet is of interest to entomology researchers investigating malaria vector control6. Long-lasting insecticidal bednets (LLINs) are the most effective method of control against disease carrying mosquitoes7 and understanding the precise modes of action of LLINs in terms of mosquito-bednet interaction is crucial in their ongoing development, as rates of insecticide resistance within mosquito populations continue to increase8. Until now, a solution to accurately examine 3D flight behaviour of a mosquito obscured by a bednet has not been achieved.
Previous similar metrology applications of digital holography have focused on smaller fields of view9, often in a lensless configuration10, although Malkeil et al. achieved a 55 mm diameter recording volume2. Larger field-of-view digital holography to reconstruct bigger objects11, 12, including reconstruction of an object through a diffuse surface13, has generally been reserved for improving the quality of a reconstructed image rather than for exact localisation of an object. Singh et al examined the concept of viewing objects obscured by a diffuse surface using time-averaged digital holography to improve deep tissue imaging13, 14. Other novel methods to reconstruct and localise an object obscured by diffuse surfaces, solid objects, and multiple-object scattering include a technique to reconstruct images of shrapnel during an explosion15, and a femtosecond pulsed laser to reconstruct objects deep inside a dense spray16. Further techniques have been developed for imaging an object through optically thick diffusive media17, 18 using the Fourier domain shower curtain effect or multiple spatially shifted realisations between two objects, e.g. the bednet and mosquito. Spatially continuous diffusive material is more challenging than the bednet of relevance here, however, the techniques to reconstruct 'hidden' objects require hundreds to thousands of images as input for the reconstruction algorithm and exemplar data is given for time stationary objects. In the case of the mosquito, its orientation and morphology (legs, wings, body) are time variant during flight and hence such methods cannot be applied directly to this case.
Non-holographic methods for extracting the 3D position of small objects often involve stereo-pair imaging, as used when Butail et al. examined 3D swarming behaviour of mosquitoes in the field19. However, the inherent problem with matching stereo image pairs led to short tracks (5−7 seconds), necessitating time consuming human supervision to combine into long time-series data. Kroner et al. modified a 2D retro-reflective screen imaging arrangement20 by adding a small separation between the light source and camera to give a quasi-stereo setup where a mosquito's secondary shadow on the retro-reflective screen and its primary shadow on the camera formed a stereo-image pair21. Missing data points occur due to the poor shadow-background contrast and are amplified by the presence of a bednet. In all but the last approach, non-occluded access to the measurement space from multiple views is required with angularly well separated cameras. In their review of Photonic Monitoring of Atmospheric and Aquatic Fauna, Brydegaard and Svanberg suggest that, when examining flying insects, a focus strategy is necessary to achieve high sensitivity while maintaining a high depth-of-field22. Digital holography offers the ability to refocus a scene during post-processing of data, so is a valid approach which could be applied to other insects, such as biting midges, moths, and flower pollinators23.
Digital holography offers unique solutions to 3D imaging problems, and a telecentric in-line configuration is an attractive proposition when examining mosquito interaction with insecticide soaked walls and nets. The XY position of an object is easily resolvable using conventional image processing techniques, and the z-axis position is calculated via reconstruction of the object scene and evaluation of suitable focus metrics24−26. Digital re-focusing of a mosquito hologram gives the potential for 3D tracking of mosquito flight in a wide range of experimental configurations involving bednets.
In this paper, a scalable digital holographic methodology to accurately localise a mosquito in 3D coordinates in a large field of view is presented. The paper first determines the z-axis resolution limits at larger lateral imaging resolutions (effective pixel size, EPS,
$ \Delta{x}_e $ , mm/pixel) compatible with an increased Field of View (FoV), expanding the scope of previous reports27, 28 and for the case of multiple object localisation. The particle signature function focus metric25, 28 proposed by this previous work performs well at resolving multiple objects, but is less effective in the case of a mosquito obscured by a bednet due to the disturbed reference wave diffracting through the opaque lattice-structure, resulting in unacceptable positional uncertainties ($ z_{err}>10 $ mm). A suitable recording setup for forward scattering in-line digital holography is then introduced, along with a methodology for the reconstruction and localisation of mosquitoes. A cross-correlation method for the identification and XY localisation of free-flying mosquitoes and mosquitoes obscured by a bednet is then presented along with a novel z-axis localisation technique to improve separation and localisation of the bednet and mosquito z-axis positions for the obscured mosquito case. The method involves a two-step cascade correlation method of a Tamura-of-Intensity (ToI) focus metric, previously described by Tamamitsu et al29. The result is a method described as the Cascade-Correlation of Focus Metric (CCoFM) technique. A simple bednet-background removal technique is also introduced. Large field-of-view physical data is provided to demonstrate that the system is capable of refocusing fast-moving mosquitoes with a high frequency wing-beat (~ 700 Hz) using a continuous-wave laser source. Data involving mosquitoes obscured by a bednet are then investigated. Simulations are used to determine the limits of the CCoFM and bednet-background removal techniques with regards to the mosquito position relative to the bednet, and physical data is used to validate the z-axis resolution limits close to the bednet.In terms of digital holography applied to similar underwater organism tracking experiments2, 3, the field of view in this paper is approximately 5 × larger, and is therefore defined in the following sections as 'Large Field-of-View', although it is smaller than 2D mosquito flight imaging experiments previously reported30. However, other 100 × 100 × 100 mm flight-chamber laboratory bio-assays31, involving a single layer of bednet in front of a mosquito, indicate that the techniques presented in the following paper can be applied to entomology research.
-
The effective pixel size (EPS,
$ \Delta{x}_e $ ), also known as image lateral spatial resolution or sampling resolution, is defined as the recorded volume transverse distance ($ x_r,y_r $ ) divided by the number of pixels on the recording device ($ M,N $ ) so that$ \Delta{x}_e = \min(x_r/M, y_r/N) $ . The EPS is increased by using fewer pixels to record a given volume, or by increasing the recorded volume for a given number of pixels. The demagnification factor of a two-lens system between the object and camera is used to alter the EPS.Work previously conducted concluded that a trade-off between EPS and localisation accuracy exists, and that the minimum resolvable distance between two objects increases as EPS is increased28. As a progression on this previous work28, the minimum resolvable z-axis distance between two physical objects (2.4 mm diameter spheres) was evaluated for discrete EPS values of
$ \Delta{x}_e = 58.60 $ µm,$ \Delta{x}_e = 78.13 $ µm, and$ \Delta{x}_e = 97.67 $ µm, presented in Fig. 1. The higher EPS values yield a larger minimum resolvable distance for three focus metrics assessed in the previous paper (edge-gradient based, Tamura of intensity, particle signature function), although the minimum resolvable distance is different for each of the three focus metrics. Since the minimum resolvable distance for two objects in close proximity appears to increase for larger EPS values, it was anticipated that the same trend would be observed for resolving a mosquito obscured by a bednet. However, the particle signature function focus metric previously reported works well for resolving multiple objects, but is less effective in the case of a mosquito obscured by a bednet due to the disturbed reference wave diffracting through the lattice-structure. As such, the Tamura of Intensity focus metric provides the best balance between multiple-object resolvability, and working with a disturbed reference wave through a bednet. An EPS of ~ 80 µm was chosen for the physical data reported in this manuscript due to the larger change in minimum resolvable distance for the Tamura of intensity focus metric between EPS values of 78.13 µm and 96.67 µm in Fig. 1.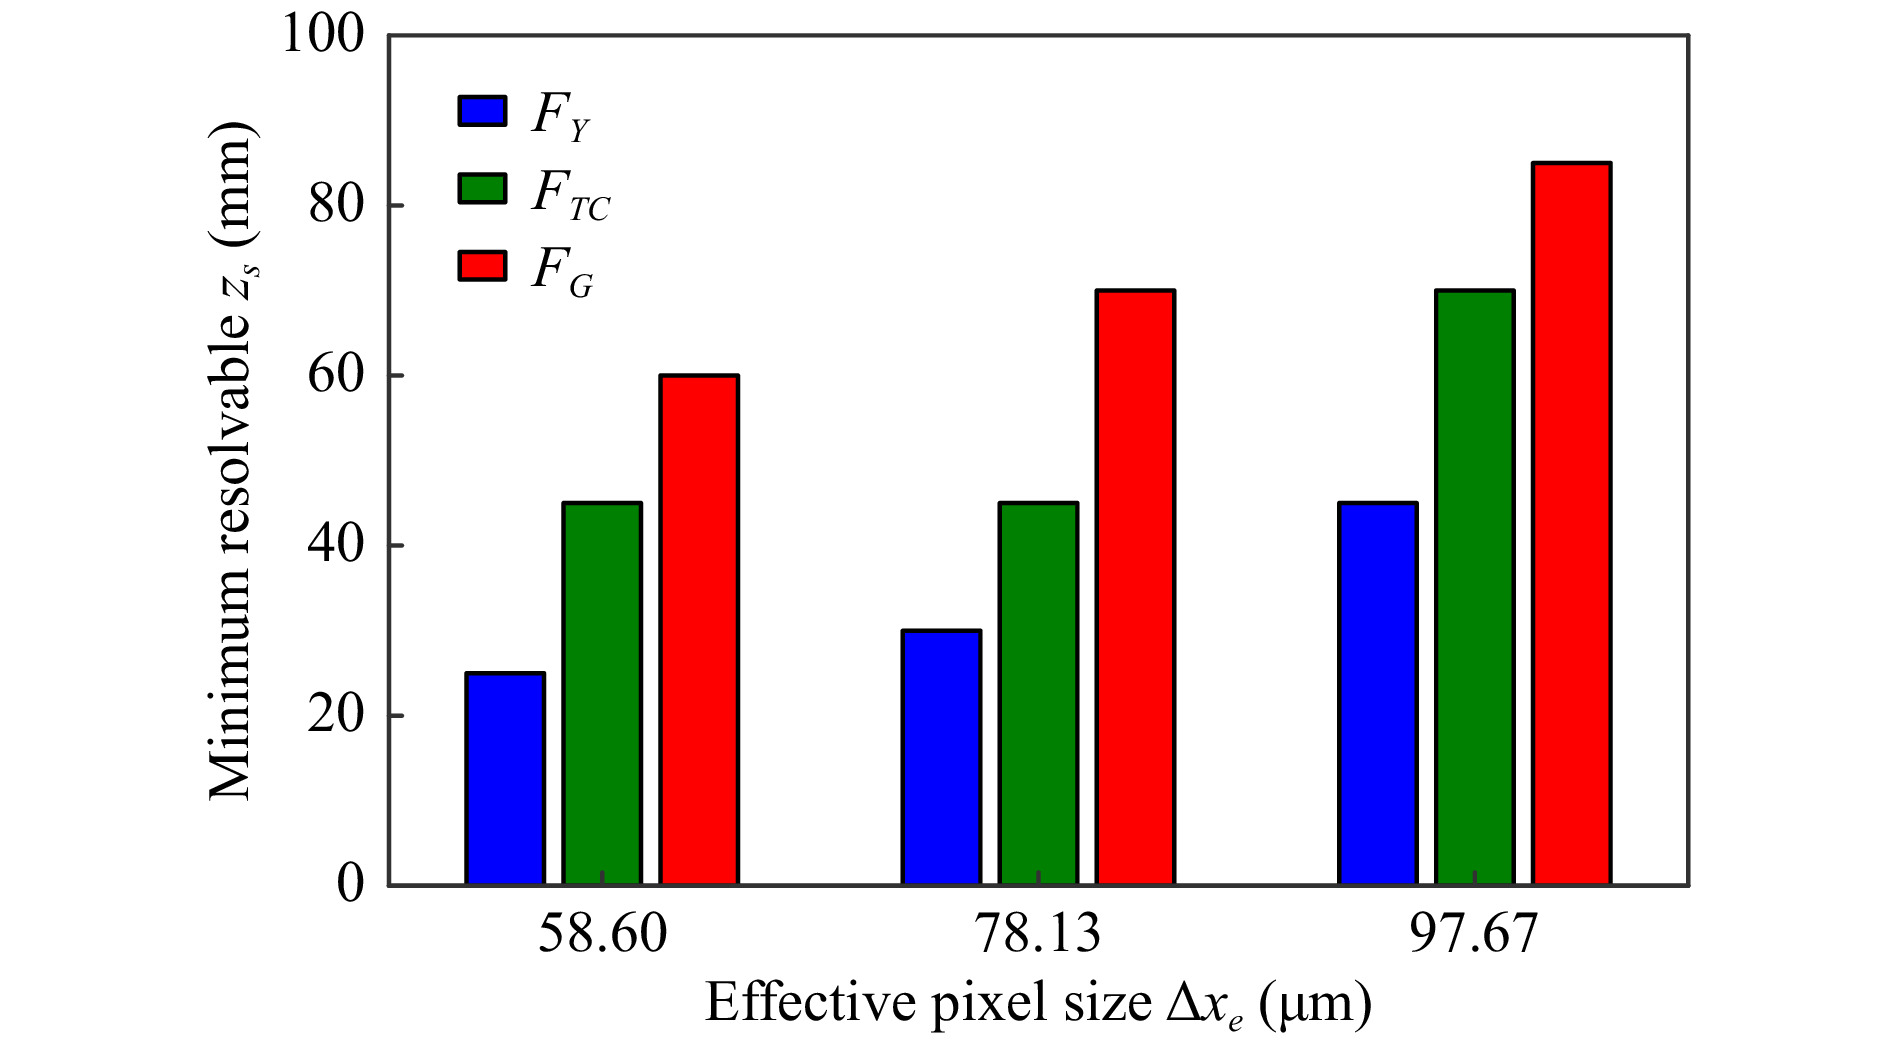
Fig. 1 Effect of EPS,
$ \Delta{x}_e $ , on minimum resolvable distance of two mosquitoes in close proximity for EPS values of$ \Delta{x}_e = 58.60 $ µm, 78.13 µm, and 96.67 µm. Extension of data in previous paper28. -
A flight chamber was constructed and the front was placed at a perceived distance of 0.9 m away from the back-focal point of a focusing off-axis parabolic (OAP) mirror and plano-convex lens telecentric demagnification system of focal lengths
$ f_o = 2540 $ mm,$ f_i = 175 $ mm, demagnification factor$ M_D=14.53\;\times $ , and an EPS of$ \Delta{x}_e = 79.89 $ µm. Twin-image suppression in digital holography has been a key topic for many researchers when absolute phase values or high-accuracy metrology and profilometry is necessary32, 33. For positional metrology of a small object, a simple method to alleviate the effect of the twin-image on reconstruction is to use a large propagation distance, as the primary and twin-image are equidistant either side of the hologram plane. Therefore, a larger propagation distance from the object to hologram plane produces a more defocused twin-image at the plane of best focus of the reconstructed object, meaning the twin-image will have a smaller contribution to the focus metric calculations. During experimentation, this was physically achieved by placing the front of the flight chamber at a known z-axis distance from the back focal plane of the mirror-lens demagnification system ($ z=100 $ mm) and moving the CCD back from the focal plane of the imaging lens by 4.26 mm (in this case). At the CCD-side of the mirror-lens demagnification system, the growth of the forward scattered first order diffraction ring increases at a rate proportional to the square of the lateral demagnification of the two lens system (with respect to z-axis distance), but the plane reference wave remains collimated. This allows for a more compact optical setup, as a 1 mm movement of the CCD amounts to a 211 mm movement of the apparent object position for the case of a lateral demagnification of 14.53×.An exposure time of 150 µs was chosen for recording, based on the calculated expected movement of a mosquito wing during exposure. Using approximate values of a mosquito wing: length of 2.4 mm, beat frequency of 700 Hz, and amplitude of 45 degrees, it was calculated that the tip of the wing would move through an arc length of 0.19 mm, corresponding to approximately 2.5 pixels when using an EPS value of 79.89 µm. As a result, motion blur was kept to a minimum. The forward-scattering nature of the experimental setup reduces issues associated with phase-shift through the exposure time due to the movement of the object, as would be the case in a reflective holographic setup.
Fig. 2 shows a 3D flight track of a mosquito along with four best-focus intensity reconstructions of the flying mosquito in the flight chamber. The mosquito can be seen to fly through the flight chamber in the z-direction (from the back at ~ −1000 mm to the front at ~ −0 mm) before probing at the glass surface of the front of the flight chamber (4−7.5 seconds). Several features of the mosquito in these specific intensity reconstructions, such as the legs, body, and wings, can be resolved and identified, and the orientation of the mosquito could be calculated if required. However, the relatively low frame-rate of the camera (30 Hz) compared to the wing beat (700 Hz) means that the captured positional-phase in the wing-beat cycle is random. Despite this, in a time-series of images, some statistical moments could be extracted from each image and linked to mosquito orientation against time. This could provide potential scope for future experiments to assess mosquito orientation with respect to plumes of CO2, attractants, and repellents.
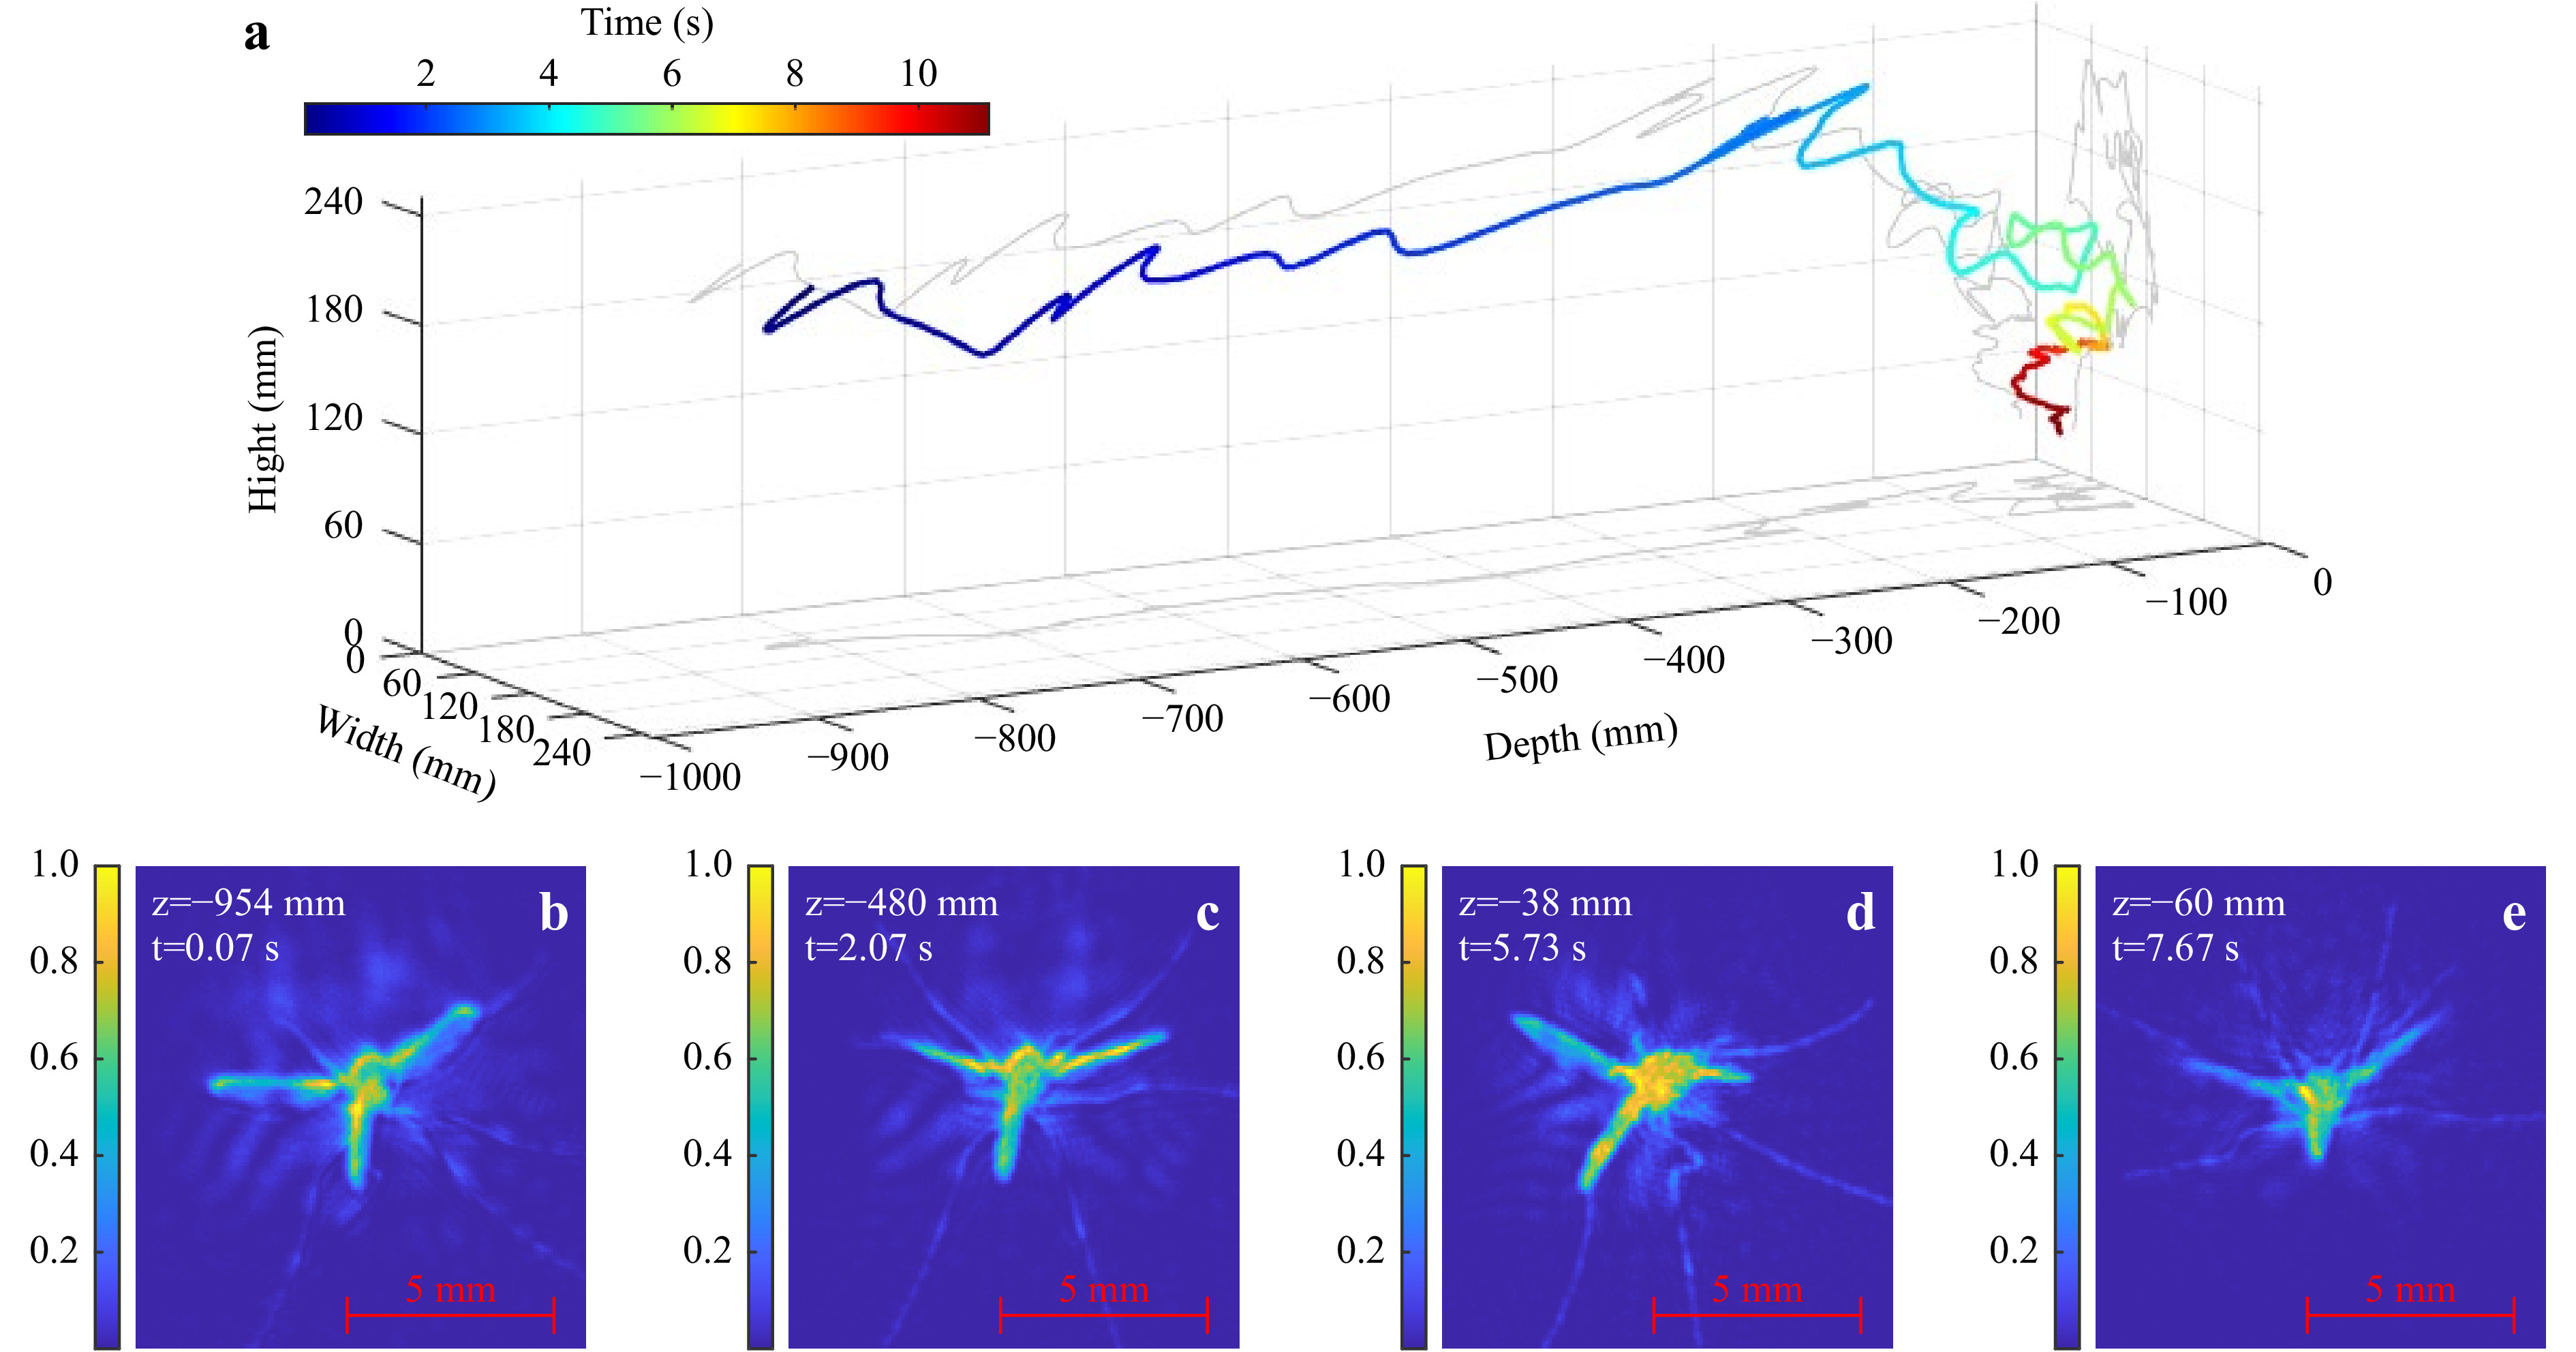
Fig. 2 a Experimental 3D flight track of a mosquito flying through the chamber and probing at the glass (grey denotes 2D projections). b−e Best-focus intensity reconstructions of mosquito at specified times (colour denotes normalised intensity in range [0 1]). Note: Animations of mosquito flight tracks are provided as Supplementary Information.
As previously mentioned, there is a keen interest in mosquito-bednet interaction. As such, an investigation into obscured mosquito localisation of a mosquito released behind a bednet was performed. Fig. 3 shows reconstructions of two mosquitoes obscured by a bednet: one in full flight (Fig. 3a, b), and the other crawling on the net (Fig. 3c, d). For each of the reconstructions, a moving background subtraction and a stationary background subtraction was performed (both described later in Background Removal of Bednet). A moving subtraction works well for free-flying mosquitoes and eliminates the requirement for a perfectly still bednet during the recording. However, Fig. 3c shows that the moving background subtraction is not suitable for use with a mosquito resting or crawling at a low speed on the net. The stationary background subtraction reconstructions feature a small amount of speckle noise compared to the moving background subtraction reconstructions due to the small movement of the bednet between the background net recording and the frame of interest.
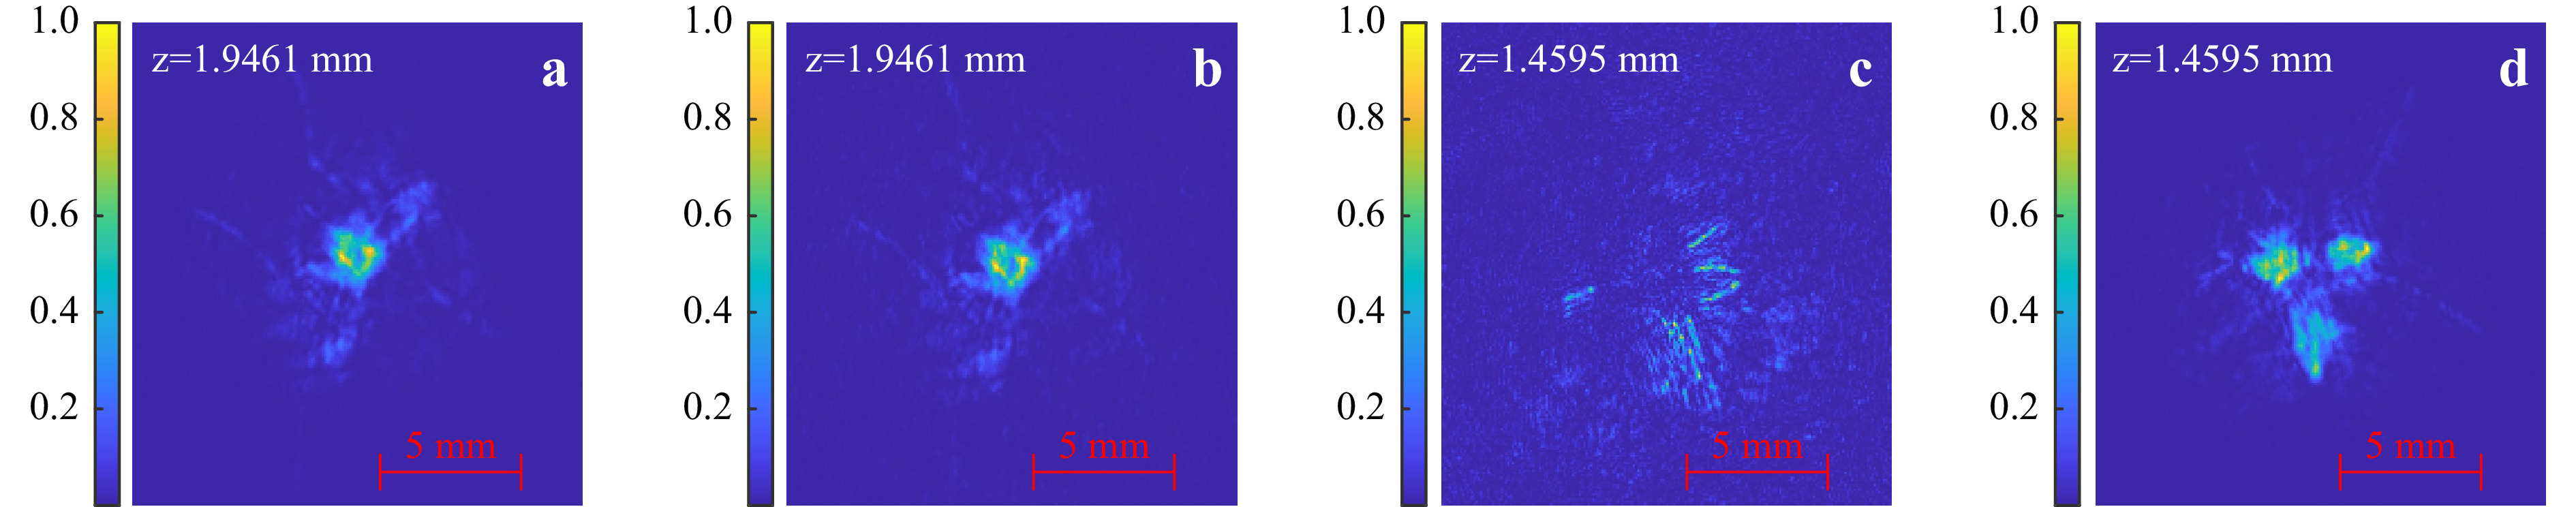
Fig. 3 Intensity reconstructions of a mosquito obscured by a bednet (color denotes normalised intensity). Flying mosquito with a moving frame and b stationary background subtraction. Mosquito crawling on net with c moving frame and d stationary background subtraction.
-
Examining laboratory-based mosquito-host interaction has previously provided useful insights into quantifying mosquito flight behaviour31, and indicates that useful data can be extracted from experiments which are not full-room-scale in size. The following techniques can be applied to similar experimental setups comprising a mosquito situated behind a single layer of bednet in a laboratory setting. Further work on methods to localise a mosquito obscured by multiple layers of bednet will be the subject of future research.
For efficiency in data collection, simulations were performed to assess the concepts introduced, and then physical validation data was collected on a smaller field-of-view to examine the z-axis resolution limits, but at the same EPS as the large FoV data described in Large Field of View Mosquito Reconstructions.
-
For a more detailed examination of mosquito-bednet interaction close to the net, the obvious solution is to orientate the optical recording setup such that the bednet does not obscure the mosquitoes with respect to the camera. However, while examining interaction with a barrier-style bednet where there are multiple net interfaces orthogonal to one another6, or in the case of examining mosquito-bednet-hole interaction34, this may not be feasible. In this case, background subtraction of the bednet is necessary - either from a pre-recorded stationary bednet-only background, or using a moving-frame subtraction technique. The background removal technique exploits the well-known phenomena where partial holograms can be used to reconstruct an entire scene35, 36. The partial holograms in this case are from the sections of the bednet that do not block diffracted light from the mosquito (i.e. the holes). Using a stationary background for subtraction offers the advantage of localising mosquitoes that have landed, although a significant constraint of this method is that the net must remain stationary between recording the bednet-only background hologram and the recording of mosquito interaction with the bednet. A moving background-subtraction technique (i.e.
$ I_{F}-I_{(F-n)} $ where I is the intensity hologram, F is the frame of interest and n is the number of frames prior) allows for some bednet movement during recording, but the diffraction pattern of a stationary mosquito is lost by the subtraction as can be seen previously in Fig. 3c. Further techniques to join tracks that end and start in the same position could be implemented, but reconstruction of mosquito orientation would be lost during this time.To implement this background removal, a number of assumptions were made. Firstly, it is assumed that the detector is linear and that the optical fields sit within the linear range of the detector. Background removal (or net removal) can either be computed by subtraction (
$ I_O - I_{BG} $ ) or division ($ I_O / I_{BG} $ ). Removal by division yields a more mathematically correct technique, as the wavefronts of the object and background add coherently at the hologram plane. However, the subtraction approach has been found to work well for obscured object localisation, resulting in a smoother and less-noisy focus metric curve with respect to the z-axis.The negatively valued pixels (using subtraction) in the mosquito position on the hologram produce a positive intensity on back propagation to the object space. The reconstructed mosquito is positively valued, while the background is close to zero (except for the diffracted waves). This makes the positively-valued reconstructed object contribute more to the focus metric calculations – while the close-to-zero background contributes less to the focus metric calculation – resulting in a more robust focus metric curve. For the background division method, the resultant background is close to 1, so any variations in the background due to noise and/or the twin-image will have a higher contribution to the focus metric calculation.To demonstrate this, Fig. 4 shows the Tamura of intensity focus metric curves of a mosquito flying behind a bednet using both background removal methods, for two frames in the time domain. For both frames, the subtraction-based focus metric (solid line) retains a single maximum close to the plane of best-focus. As such, the background subtraction technique was preferred for obscured object localisation. However, for the second frame, the dashed blue line indicates that the division-based method has failed to identify the plane of best-focus of the mosquito. Evidence of a local variation in the curve at the plane of best focus implies that further image processing of holograms using the divide method may yield successful results, and investigating the interplay between focus metric calculations and background removal methods is the subject of future study (i.e. testing different combinations).
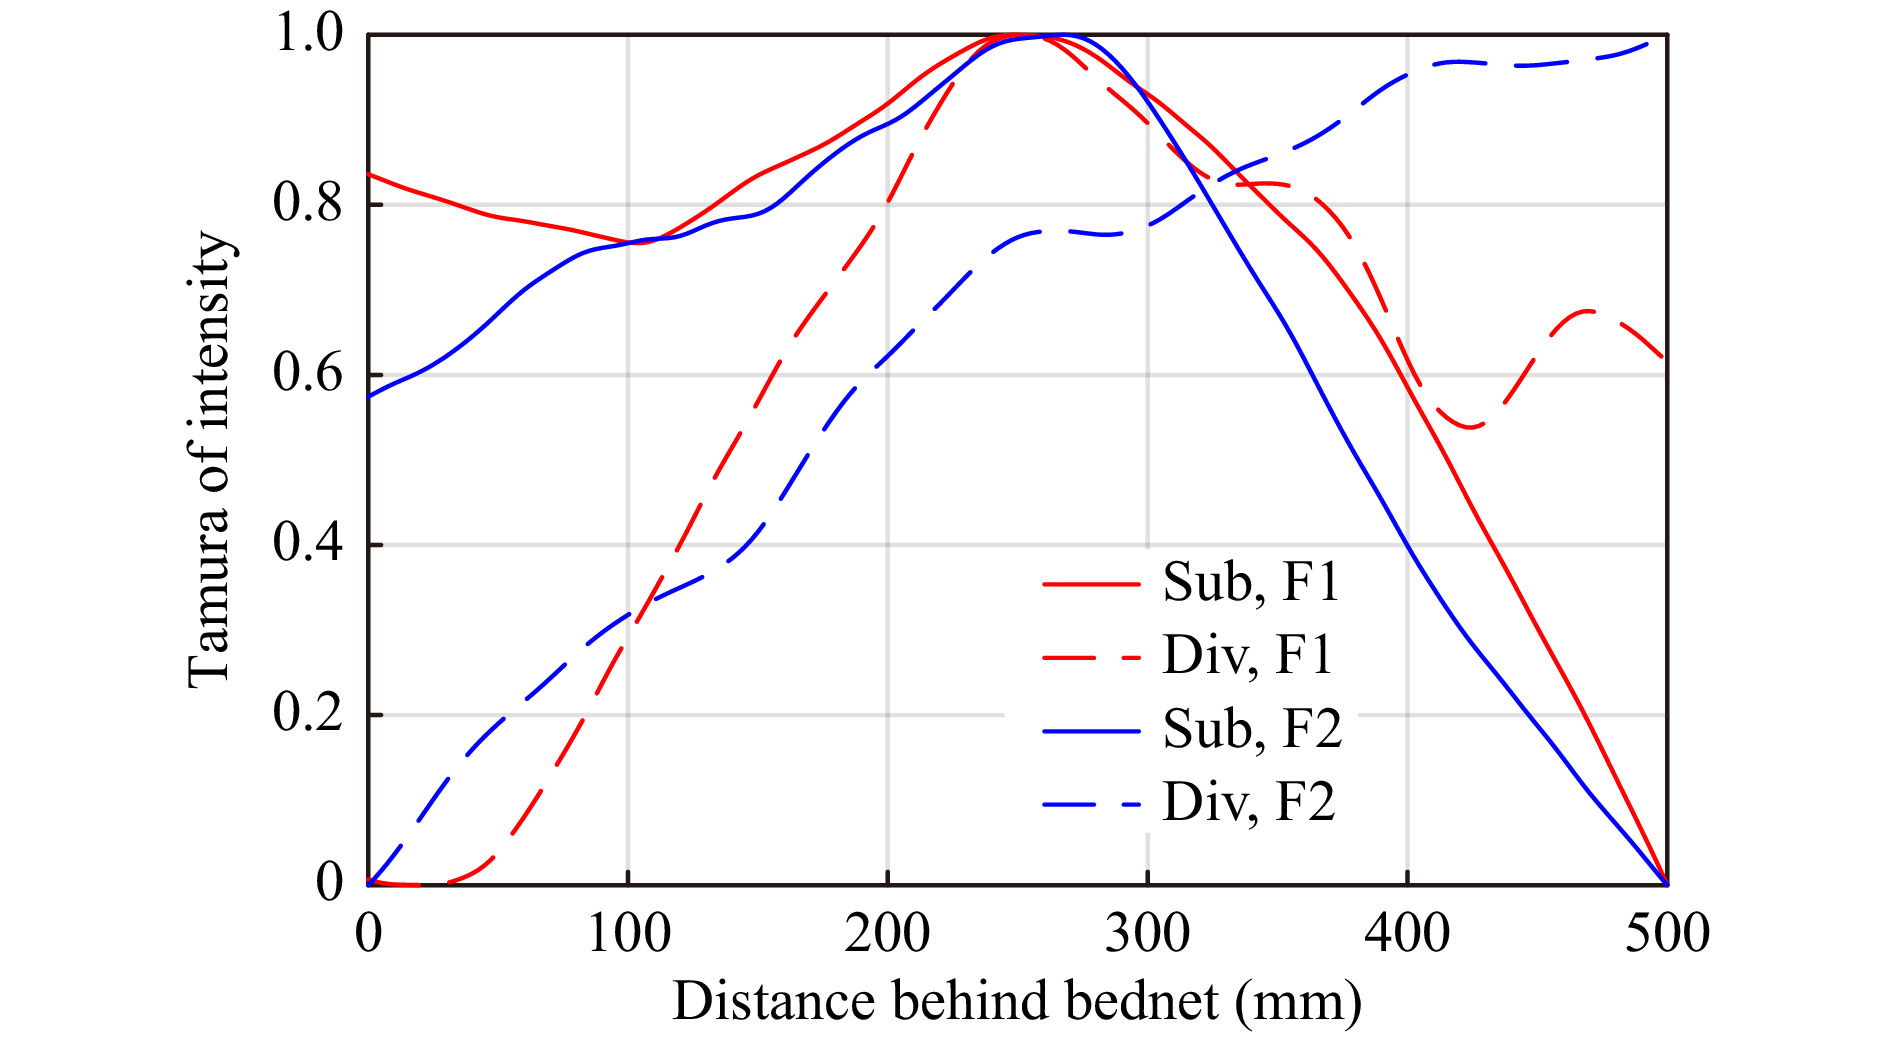
Fig. 4 Tamura of Intensity focus metric curves vs distance behind a bednet for an obscured mosquito using the subtraction (Sub) and division (Div) background removal techniques for two video frames (F1, F2).
From the non-obscured mosquito data in Supplementary Video 2 (see Supplementary Information), the mean z-axis position and standard deviation for frame-to-frame position difference for 180 frames (6 s) of mosquito resting at the end of the video was
$ -566.622\;\pm\;1.729 $ mm and$ -567.465\;\pm $ $ 1.222 $ mm for the division and subtraction methods, respectively. The z-axis reconstruction plane increments were 2 mm, so the standard deviation is less than the distance between two reconstructed planes for both methods. However, the perceived detail and quality of intensity reconstruction for the subtraction method was deemed to be better than background removal using division, and so the subtraction method was preferred in both the case of a mosquito not obscured by a bednet and of a mosquito obscured by a bednet.Fig. 5a shows the simulated results of localisation error (in z) vs z-axis position of a mosquito positioned 0−1000 mm behind a bednet, while Fig. 5b shows the focus metric curve (after bednet subtraction) of a mosquito positioned with a mosquito-bednet separation of
$ z= $ $ 1000 $ mm. The mean localisation errors were 1.16 mm, 5.17 mm, and 7.11 mm for EPS values of$ \Delta{x}_e=58.60 $ µm,$ \Delta{x}_e=78.13 $ µm, and$ \Delta{x}_e=97.67 $ µm, respectively.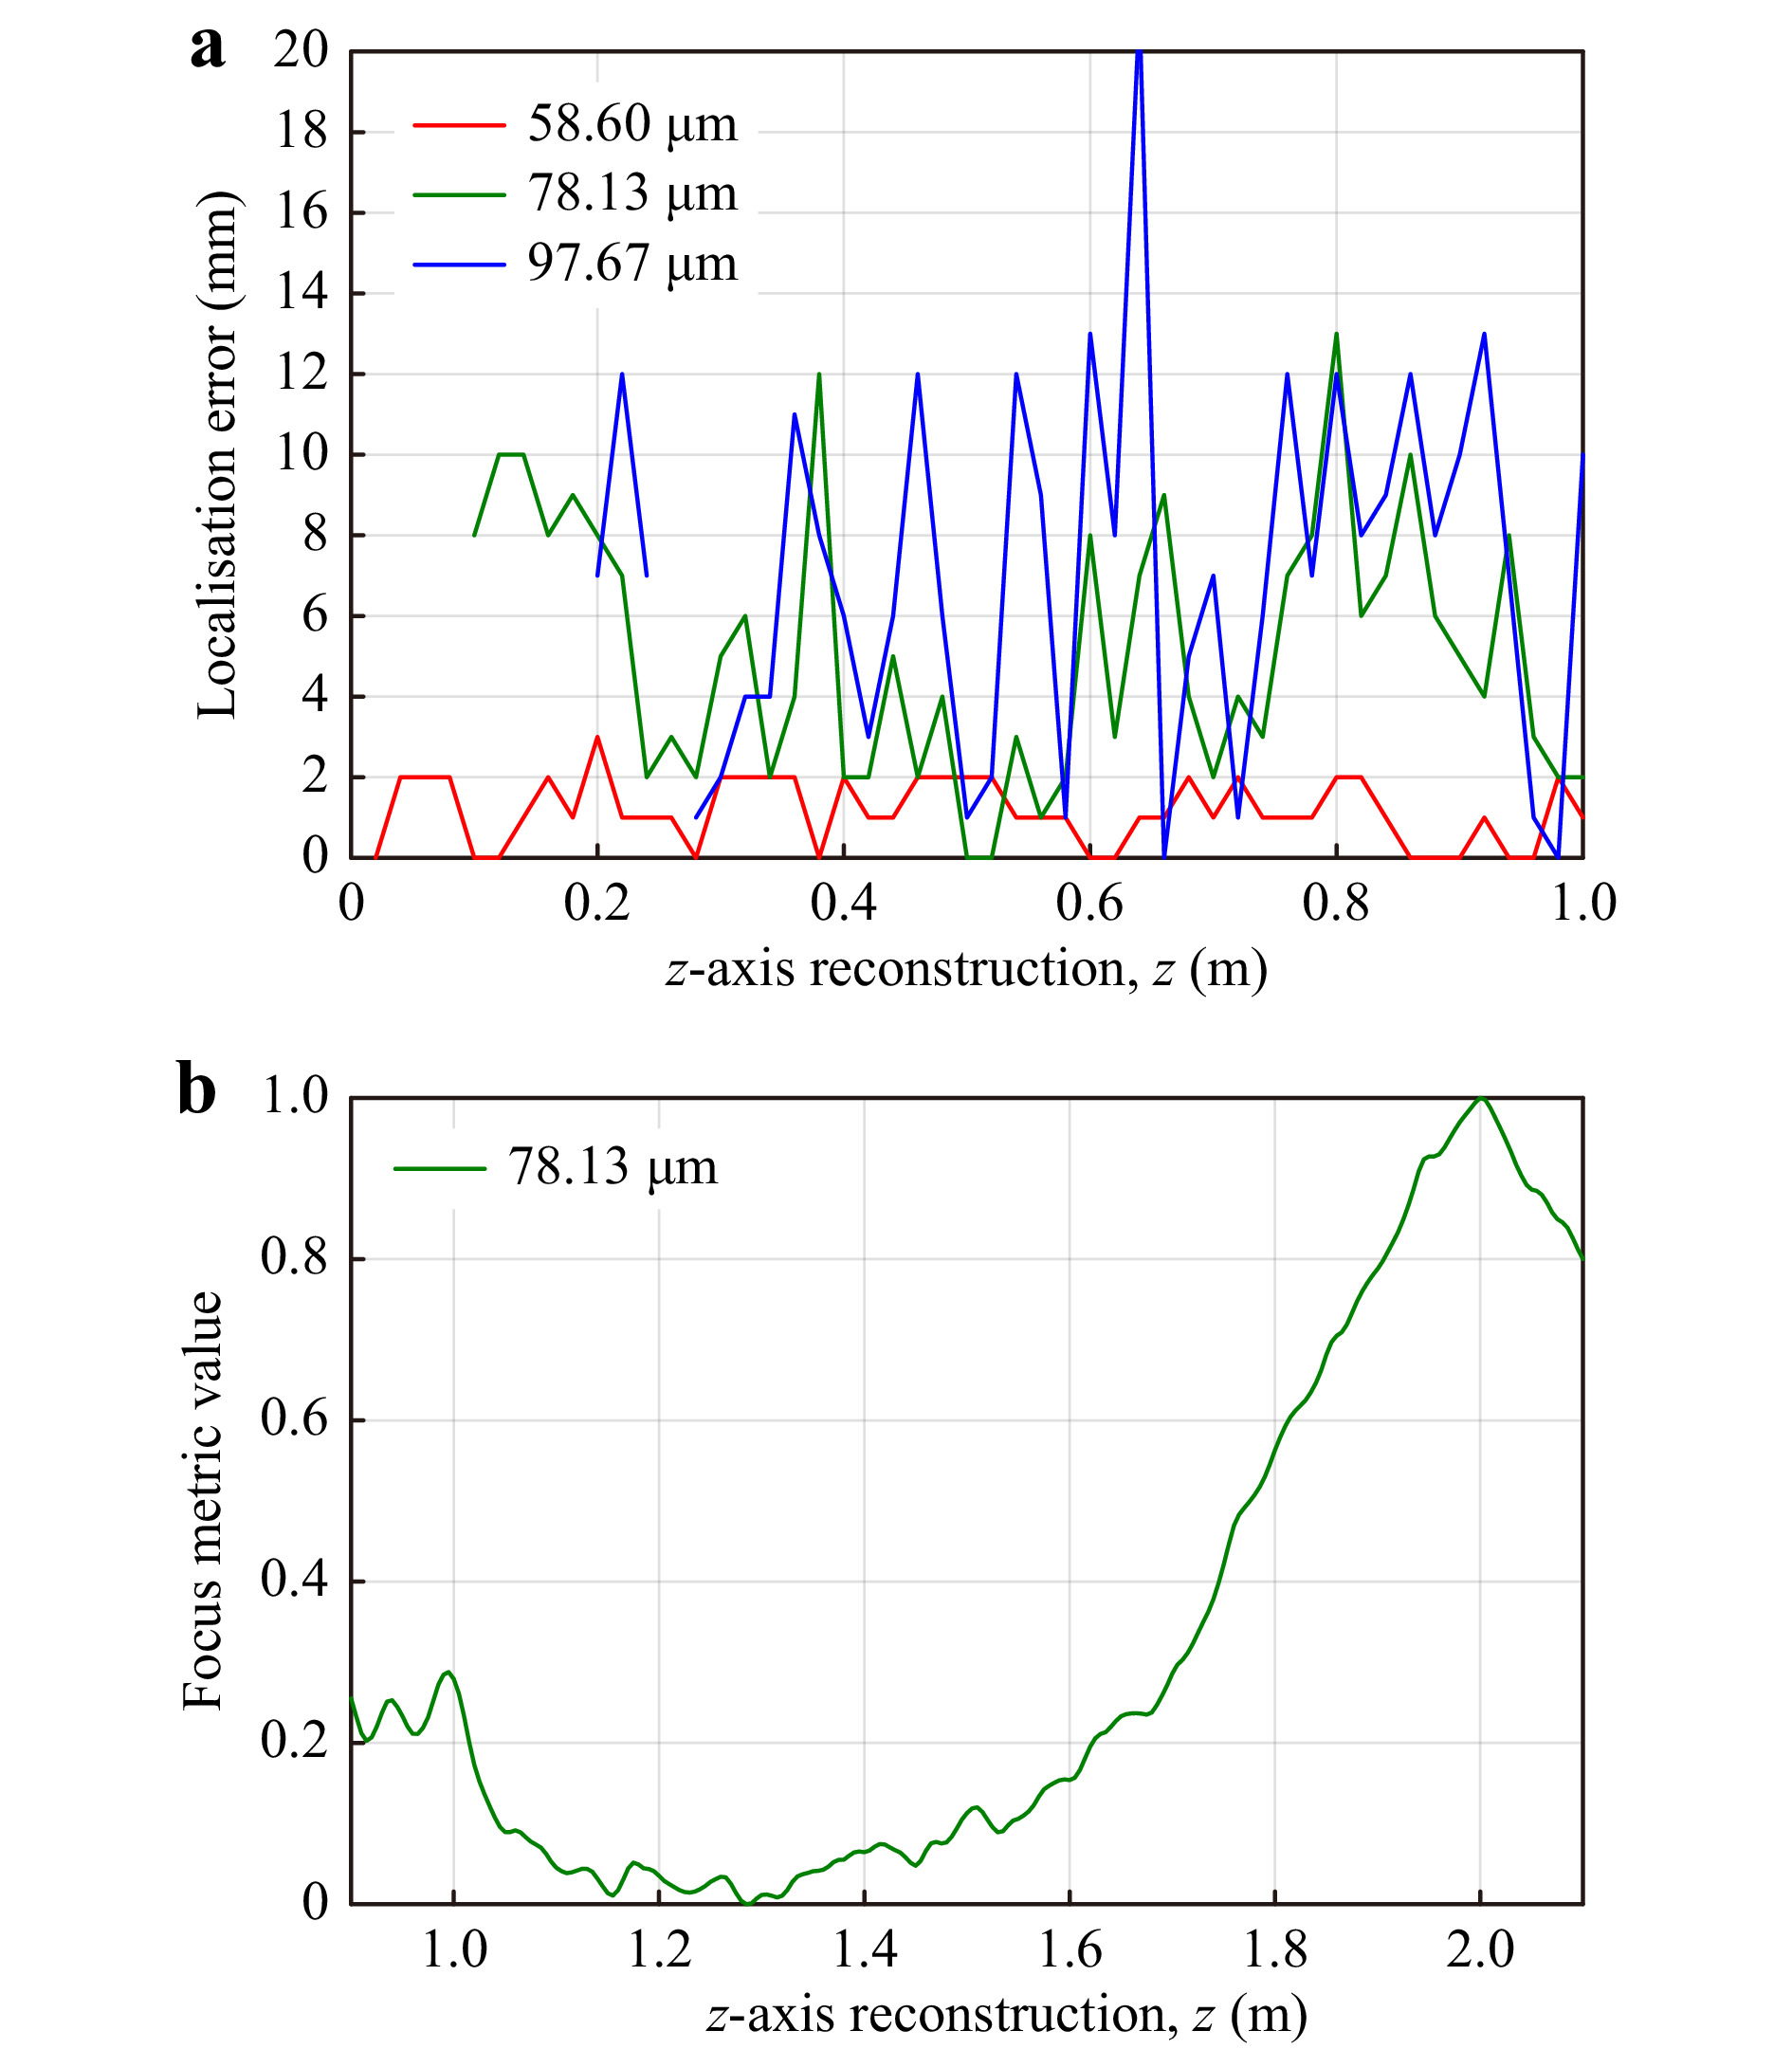
Fig. 5 a Axial placement error,
$ z_{err} $ vs mosquito-bednet z-axis separation,$ z_s $ , for three effective pixel sizes:$ \Delta{x}_e=58.60, 78.13, $ $ 97.67 $ µm using bednet subtraction - simulated data. b Focus metric curve (ToI) for a mosquito-bednet z-axis separation of 1000 mm at$ \Delta{x}_e=78.13 $ µm.Fig. 6a shows the difference hologram obtained when an intensity recorded bednet-only hologram is subtracted from a mosquito-bednet hologram at the hologram plane (both recorded at an EPS of
$ \Delta{x}_e=78.13 $ µm). The subtraction at the hologram plane is more computationally efficient than subtracting at reconstructed planes, as it is a direct intensity-only subtraction. The difference hologram is then back-propagated, rather than computing two sets of back-propagation operations from the bednet-only hologram and combined mosquito-bednet hologram before subtraction. There is no mathematical difference in the complex reconstruction between a difference hologram being back propagated to a specific plane, as compared to both holograms being back propagated to the same plane before subtraction.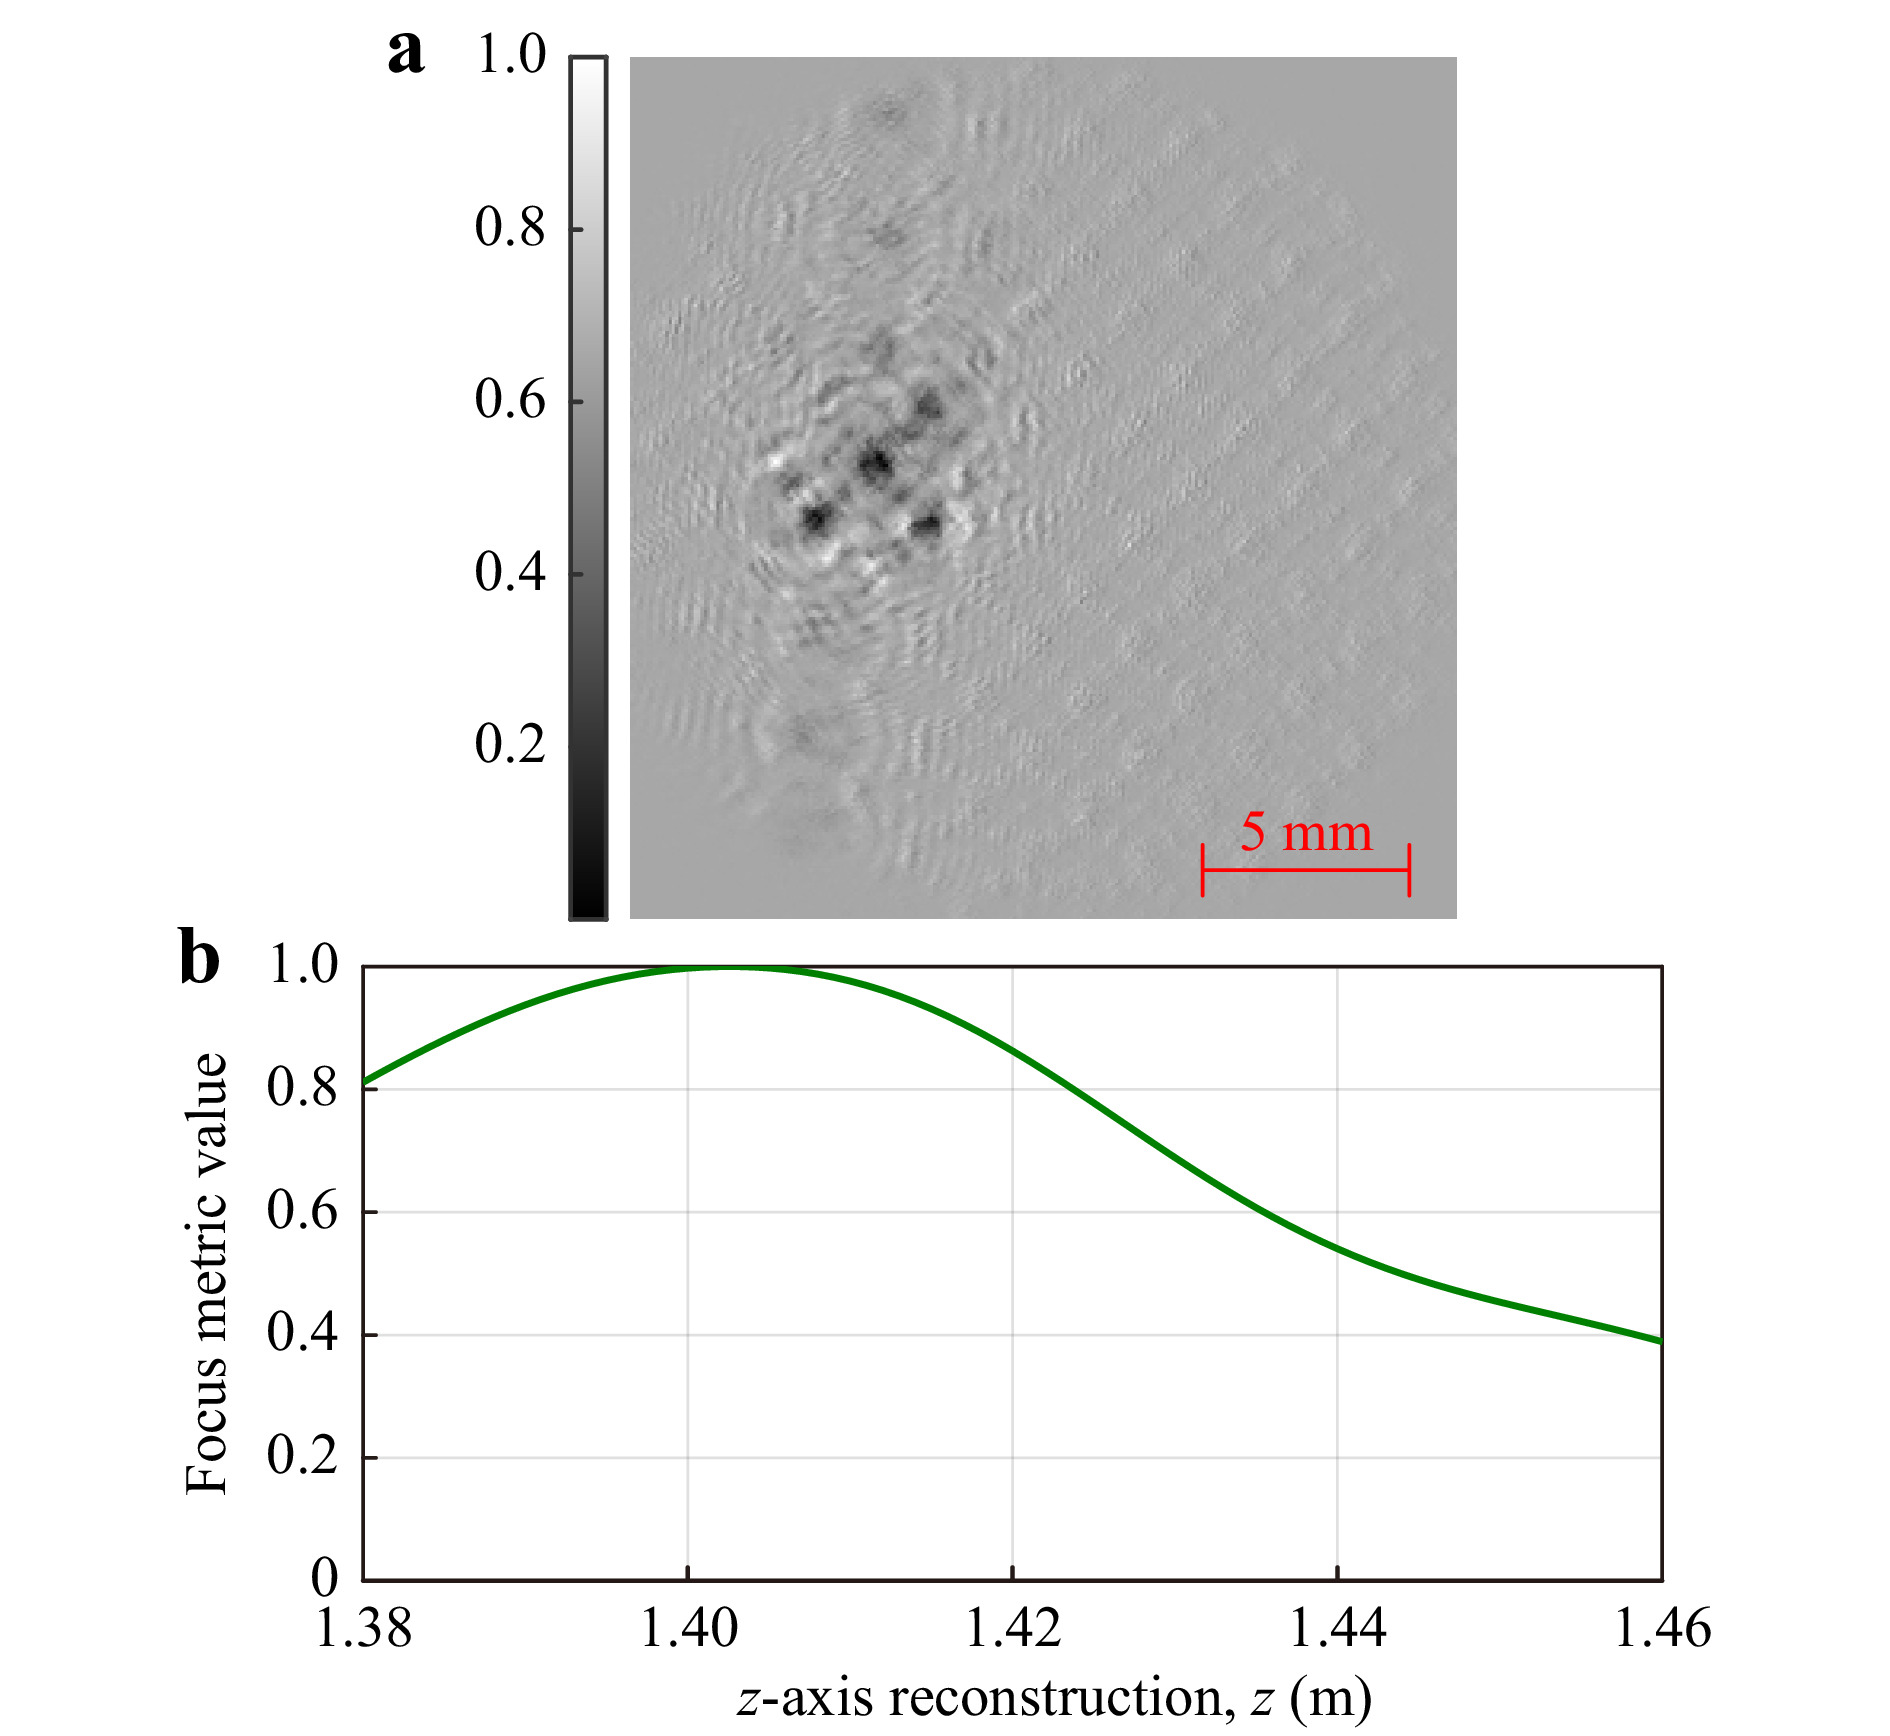
Fig. 6 a Difference hologram between mosquito-bednet hologram and bednet-only hologram (greyscale denotes normalised intensity in range [0 1]). Mosquito
$ z_s=3 $ mm behind a bednet positioned at$ z=1.40 $ m and b resulting ToI focus metric curve.In this case, the mosquito was positioned 3 mm behind a bednet positioned at
$ z=1.40 $ m. The ToI focus metric curve in Fig. 6b shows the calculated mosquito z-axis position. The maxima of the focus metric curve localised the mosquito at$ z=1.405 $ m, yielding an error of$ z_{err}=2 $ mm.Fig. 7a shows physical results for the z-axis localisation error vs mosquito-bednet separation for each EPS value. The graph shows no definite trend as
$ z_s $ increases, although the method failed to resolve mosquitoes for$ z_s<45 $ mm for an EPS of$ \Delta{x}_e=97.67 $ µm. The mean localisation error for$ z_s\geq45 $ mm was calculated for fair comparison between EPS values. Errors of 2.75 mm, 4.75 mm, and 9.04 mm were obtained for EPS values of 58.60 µm, 78.13 µm, and 97.67 µm, respectively. Fig. 7b shows the intensity reconstruction at the plane of best focus of a mosquito positioned$ z_s=3 $ mm behind the bednet. Qualitatively, the reconstruction using an intensity-subtraction appears much sharper than the reconstruction using the CCoFM method, and some features of the mosquito can be identified, such as the wings (top right and left), body (centre), and legs (bottom left).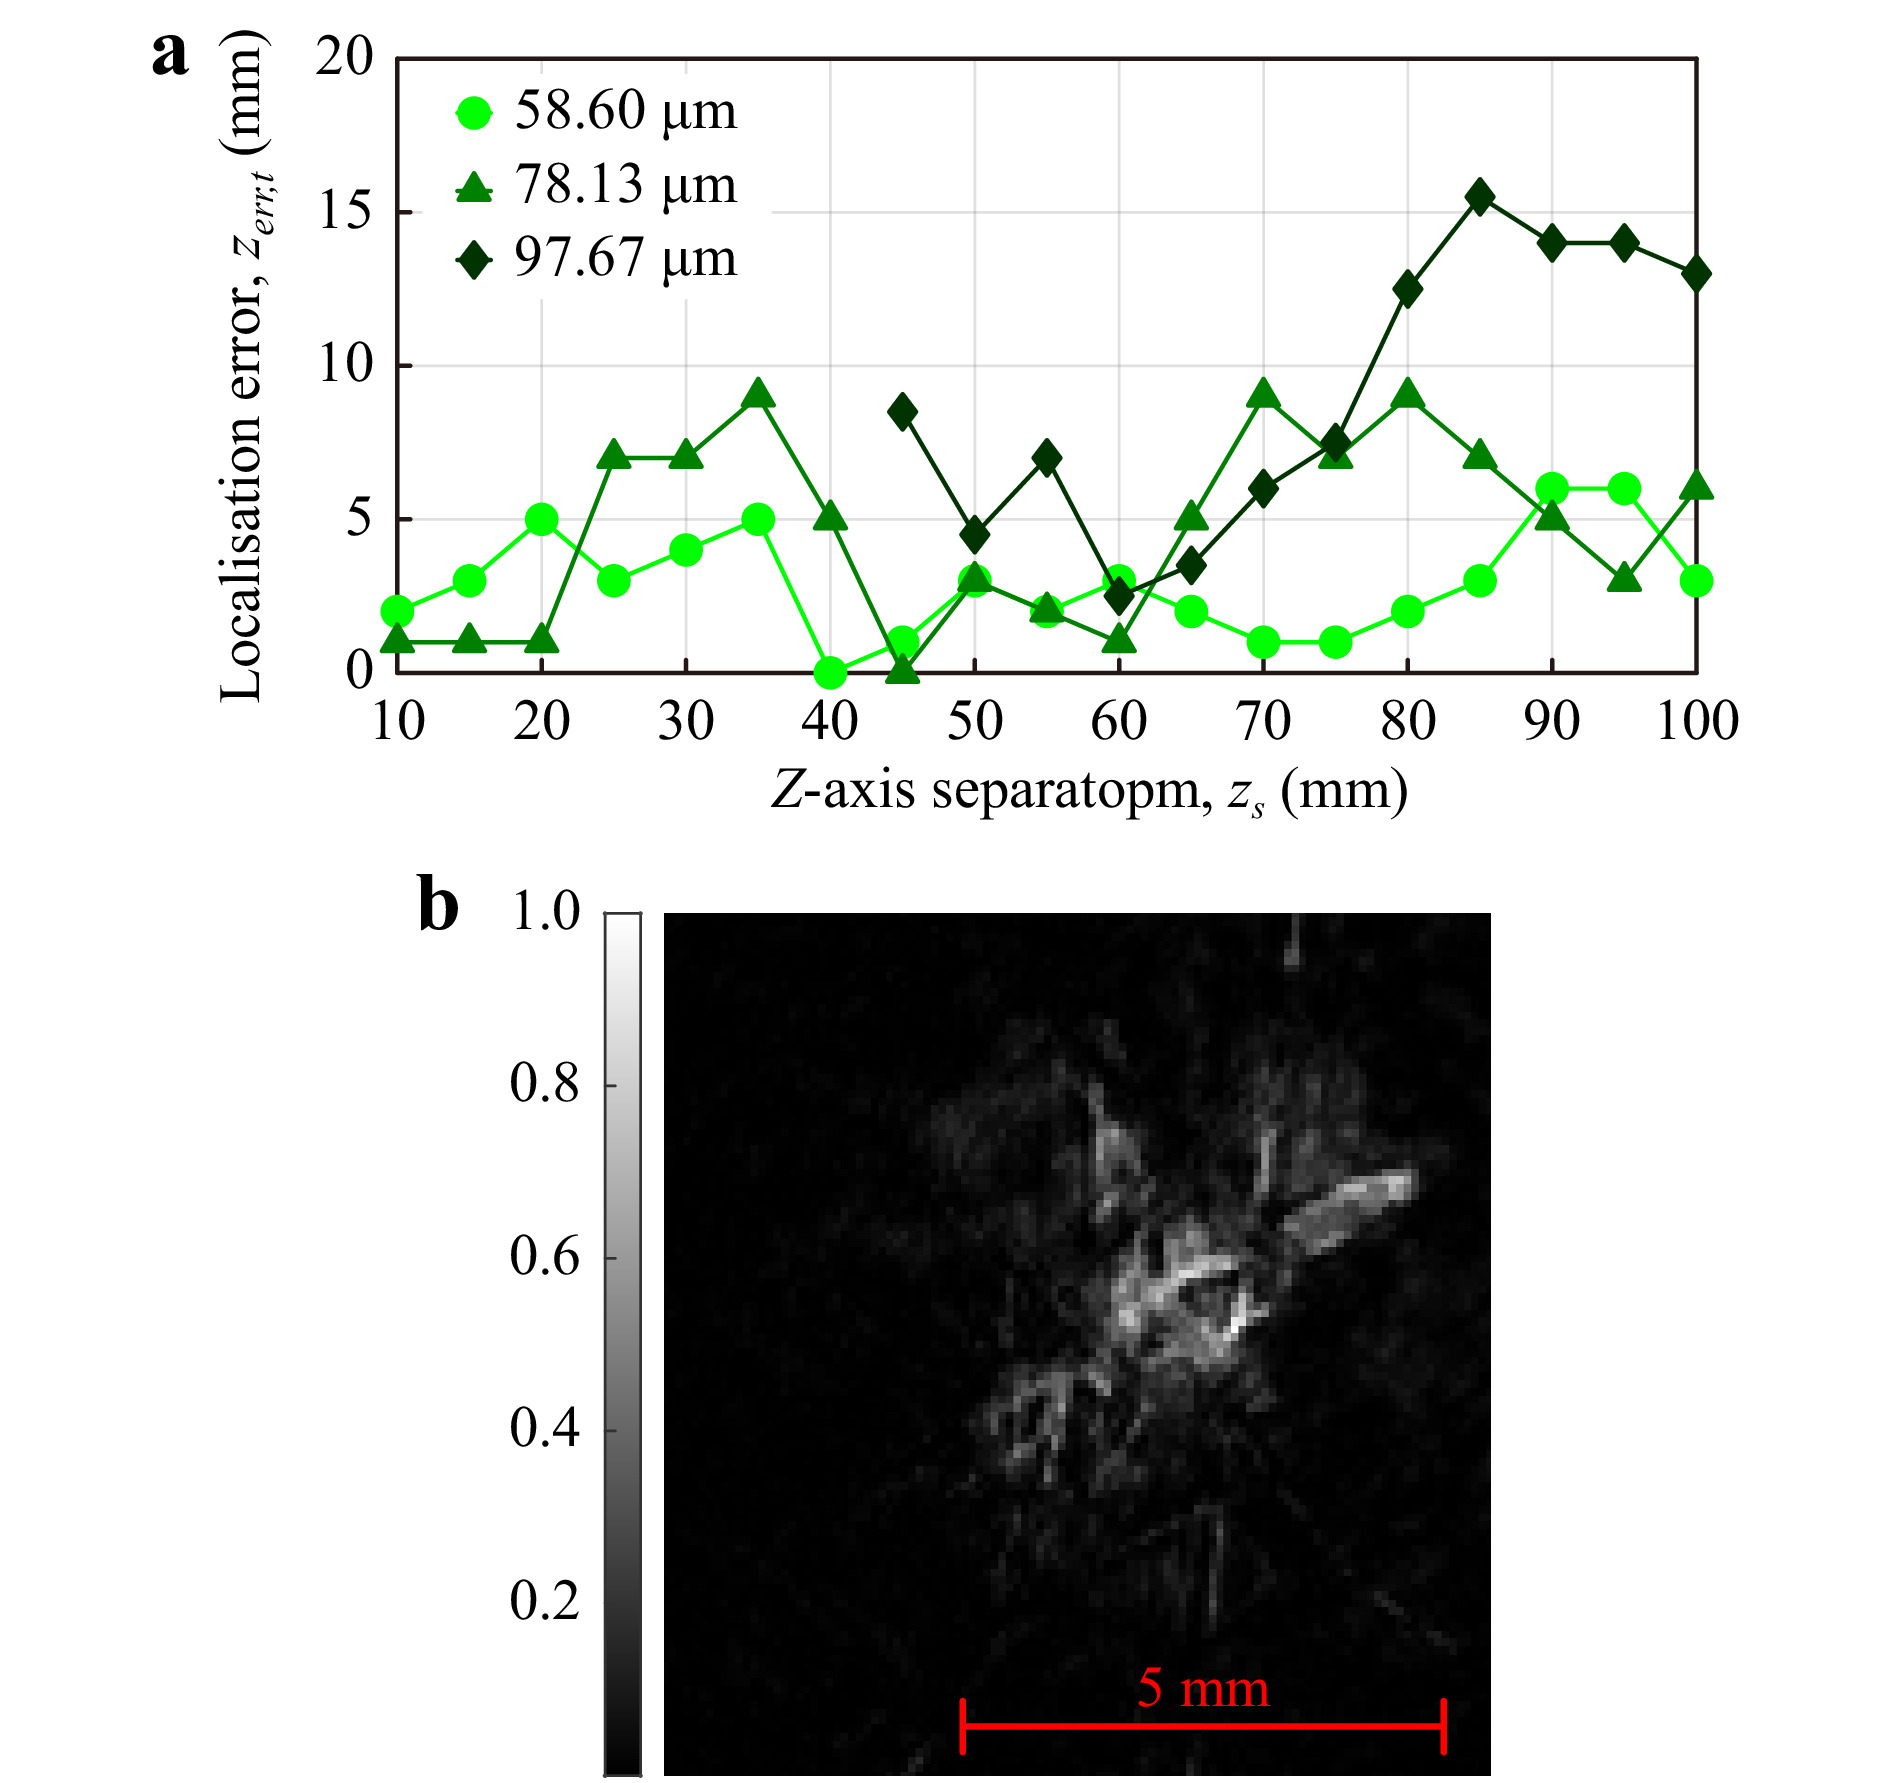
Fig. 7 a Axial placement error,
$ z_{err} $ vs mosquito-bednet z-axis separation,$ z_s $ , for three effective pixel sizes:$ \Delta{x}_e=58.60, 78.13, 97.67 $ µm using the background removal z-axis localisation. b Intensity reconstruction of a mosquito$ z_s=3 $ mm behind the bednet (greyscale denotes normalised intensity in range [0 1]). -
The Cascade-Correlation of Focus Metric (CCoFM) is suitable for applications where the bednet may move during recording and accurate localisation below a minimum resolvable z-axis distance is not required as long as the 'time-in-zone' can be attained by continuing to track the mosquito in 2D XY coordinates. This method could also be used to resolve multiple occluded mosquitoes in the axial direction with potential future applications in recording mosquito swarming behaviours.
Previous work on multi-object localisation28 indicates that the ToI and edge gradient focus metric curves appear to merge into an elongated curve with a single peak as the z-axis separation of multiple objects decreases. With a mosquito at 35 mm behind the bednet, the ToI focus metric curve becomes elongated (for the case where the bednet is not subtracted) and, at an EPS of 58.60 µm, no well separated maxima are observed. More detail on this feature is given in Materials and Methods.
Fig. 8a shows the z-axis localisation error vs mosquito-bednet z-axis separation for each of the EPS values obtained from physical data. As previously discussed, a different mosquito-only mask was used for each EPS value during the cross-correlation process, as the Q-value of the focus metric curve decreases as EPS increases. The CCoFM method failed to resolve the mosquito and bednet as separate objects in the z-direction for z-axis separations of 35 mm, 50 mm, and 60 mm for EPS values of 58.60 µm, 78.13 µm, and 97.67 µm, respectively. For fair comparison across all EPS values, the mean localisation error for
$ z_s\geq 60 $ mm was calculated, yielding results of 9.22 mm, 9.23 mm, and 10.78 mm. Fig. 8b shows the reconstructed image at the plane of best focus ($ z=1.45 $ m) of a mosquito 50 mm behind the bednet positioned at$ z=1.40 $ m, recorded with an EPS of 78.13 µm as an example of the z-axis resolution limit for this EPS using the CCoFM method. Qualitatively, it is hard to define the shape of the mosquito and the resultant sharpness of the mosquito reconstruction. However, the XY localisation method demonstrated in XY Localisation combined with the CCoFM z-axis method successfully identifies and determines the mosquito 3D positional coordinates.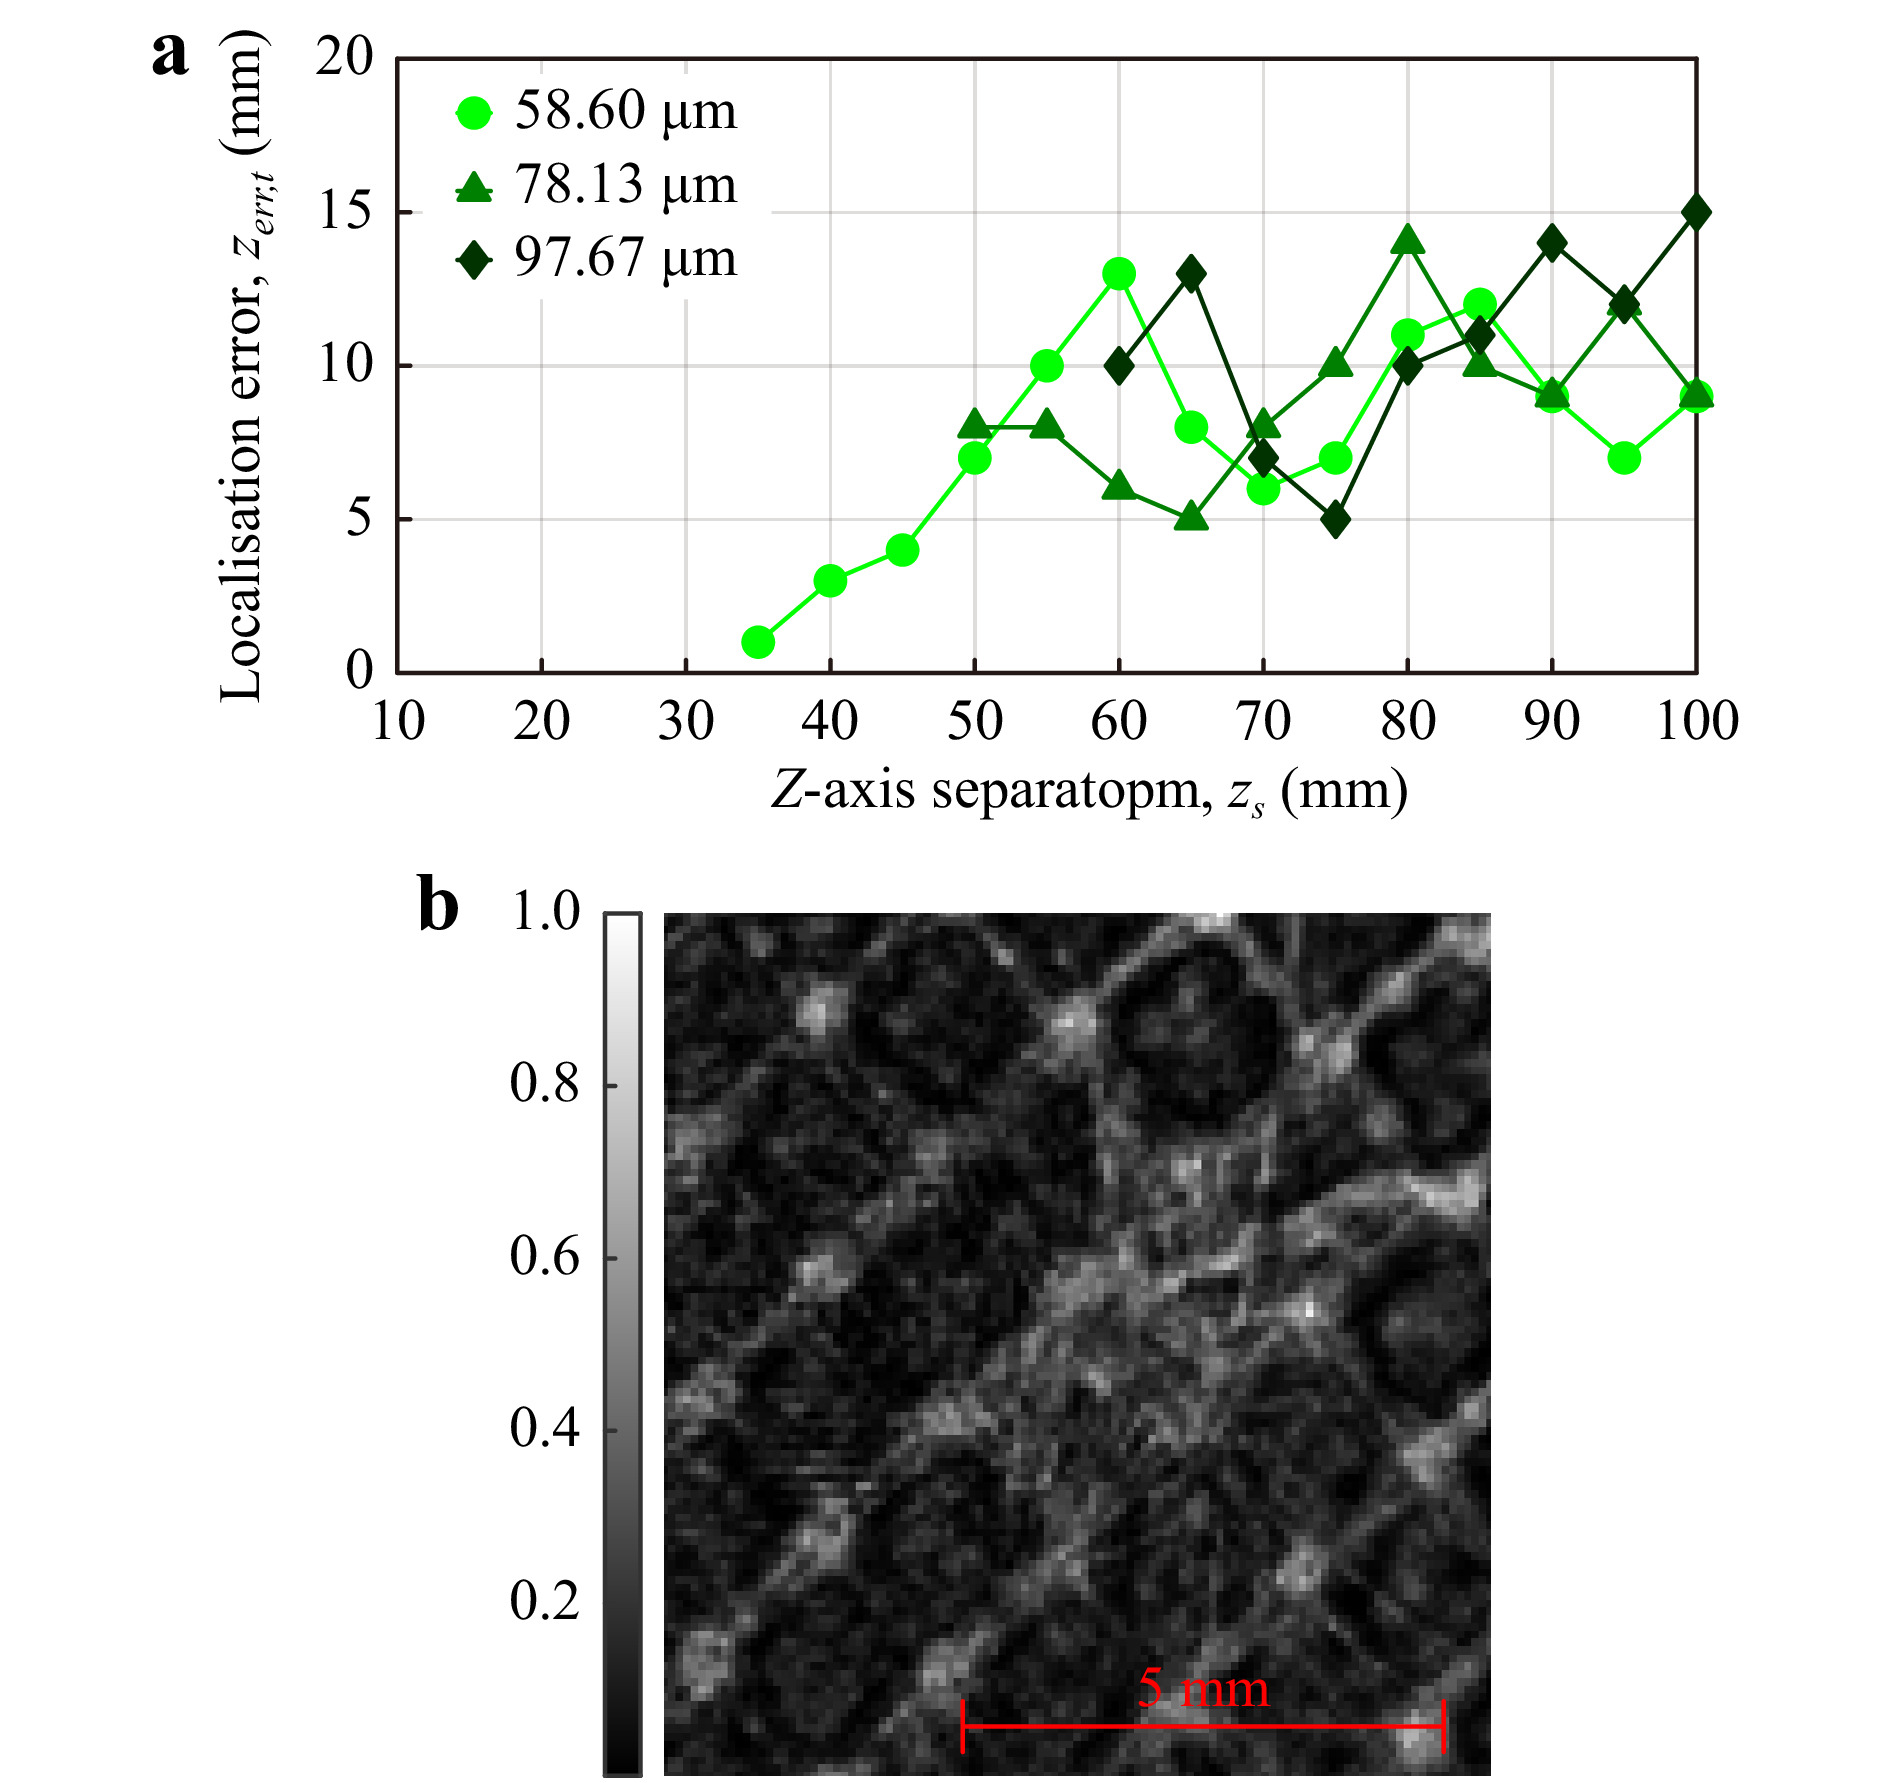
Fig. 8 a Axial placement error,
$ z_{err} $ vs mosquito-bednet z-axis separation,$ z_s $ , for three effective pixel sizes:$ \Delta{x}_e=58.60, 78.13, $ $ 97.67 $ µm using the CCoFM z-axis localisation - physical data. b intensity reconstruction of a mosquito$ z_s=50 $ mm behind the bednet (greyscale denotes normalised intensity in range [0 1]). -
A combination of physical and simulated results have been used to demonstrate that digital holography provides a suitable method for the 3D localisation of mosquitoes in a large field of view compared to similar previously reported digital holographic applications. The expansion on previous work on the assessment of effective pixel size vs localisation error and minimum resolvable distance between two objects provided the parameters to design a physical experimental large field of view setup (240 × 240 × 1000 mm). Intensity reconstructions of a free-flying mosquito recorded using this setup indicate that finer features of a moving mosquito can be defined, and the mosquito can be localised in 3D coordinates in a large field of view. Simulations allowed for a large number of data points to be collected on object localisation of a mosquito obscured by a bednet, and the upper z-axis resolution limit of the background removal technique was defined. The use of physical data to validate the method and assess the lower z-axis resolution limits indicate that the methods presented in this paper perform well with real data.
The use of an effective pixel size (imaging resolution) throughout this manuscript allows the recording volume to be scalable in terms of optical hardware components. When scaling the optical hardware, the effective pixel size, wavelength, and mosquito size are retained. However, by using a camera with a larger number of pixels, high-quality Fresnel lenses or holographic optical elements may provide a method to scale the recording volume to a larger size. However, it is suspected that a Fresnel lens would produce a large amount of forward scattering onto the hologram that would likely impact on the reconstruction and localisation accuracy of a mosquito. A feasibility study on the use of Fresnel lenses and/or holographic optical elements as a hardware option for increasing the recording volume will be conducted in future work.
Table 1 summarises the physical results presented earlier in the paper in terms of minimum resolvable distance between a bednet and a mosquito and mean localisation error for the two proposed z-axis localisation methods and each of the EPS values.
Method CCoFM Background Removal Resolvable
≥ zs, mmMean
zerr, mmResolvable
≥ zs, mmMean
zerr, mmΔxe = 58.60 µm 35 9.22 3 2.75 Δxe = 78.13 µm 50 9.23 3 4.75 Δxe = 97.67 µm 60 10.78 45 9.04 Table 1. Largest unresolvable z-axis separation and mean localisation error for the two proposed z-axis localisation methods and three effective pixel sizes - physical results.
The background removal of bednet can be used when precise mosquito-bednet 3D tracking very close to the bednet is required, but is strictly limited by the condition that the bednet cannot move between the bednet-only hologram being recorded and the end of the main recording of mosquito-bednet interaction. This limitation could be relaxed using a moving frame subtraction technique, although this method would not be suitable if the mosquito is resting, crawling, or moving very slowly in the lateral direction, as the diffraction patterns will subtract from one another. Examining the interaction between mosquitoes and holes in the surface of a bednet (a typical fault after regular bednet usage) is one potential application. A previous study used a method of having a very short depth of field that only covered the thickness of the net in the z-direction34. The mosquito would therefore go in and out of sharp focus as it crosses the XY plane of the hole. This paper examines the time between a mosquito entering a dwelling to successfully passing through the bednet hole but does not explore the flight kinematics in detail. The lack of true 3D positional data makes it difficult to determine if the mosquito is randomly bouncing or searching the bednet through subsequent contacts, or not making contact at all. The background removal method could improve a study such as this. The background removal has other novel biological applications: the process enables the 3D kinematics of a mosquito approaching a bednet to be accurately described up to the surface of a net (2D imaging has an error in the unknown third axis), as well as accurately recording insecticide dosages to a mosquito freely interacting with an insecticide-soaked net (rather than lab-based in-vitro insecticide dosage tests).
Fig. 9a, b show reconstructed images of the same mosquito from a mosquito-bednet hologram after bednet subtraction and without subtraction, respectively. In both cases, the mosquito was positioned
$ z_s=20 $ mm behind the bednet and recorded at an EPS of$ \Delta{x}_e=78.13 $ µm. Accurate reconstruction of the finer features of the mosquito, such as its wings, body, and legs, may make orientation calculations possible in future work, which may give further insights into mosquito-bednet-hole interaction. Fig. 9c, of the same mosquito not obscured by a bednet, is shown for qualitative comparison.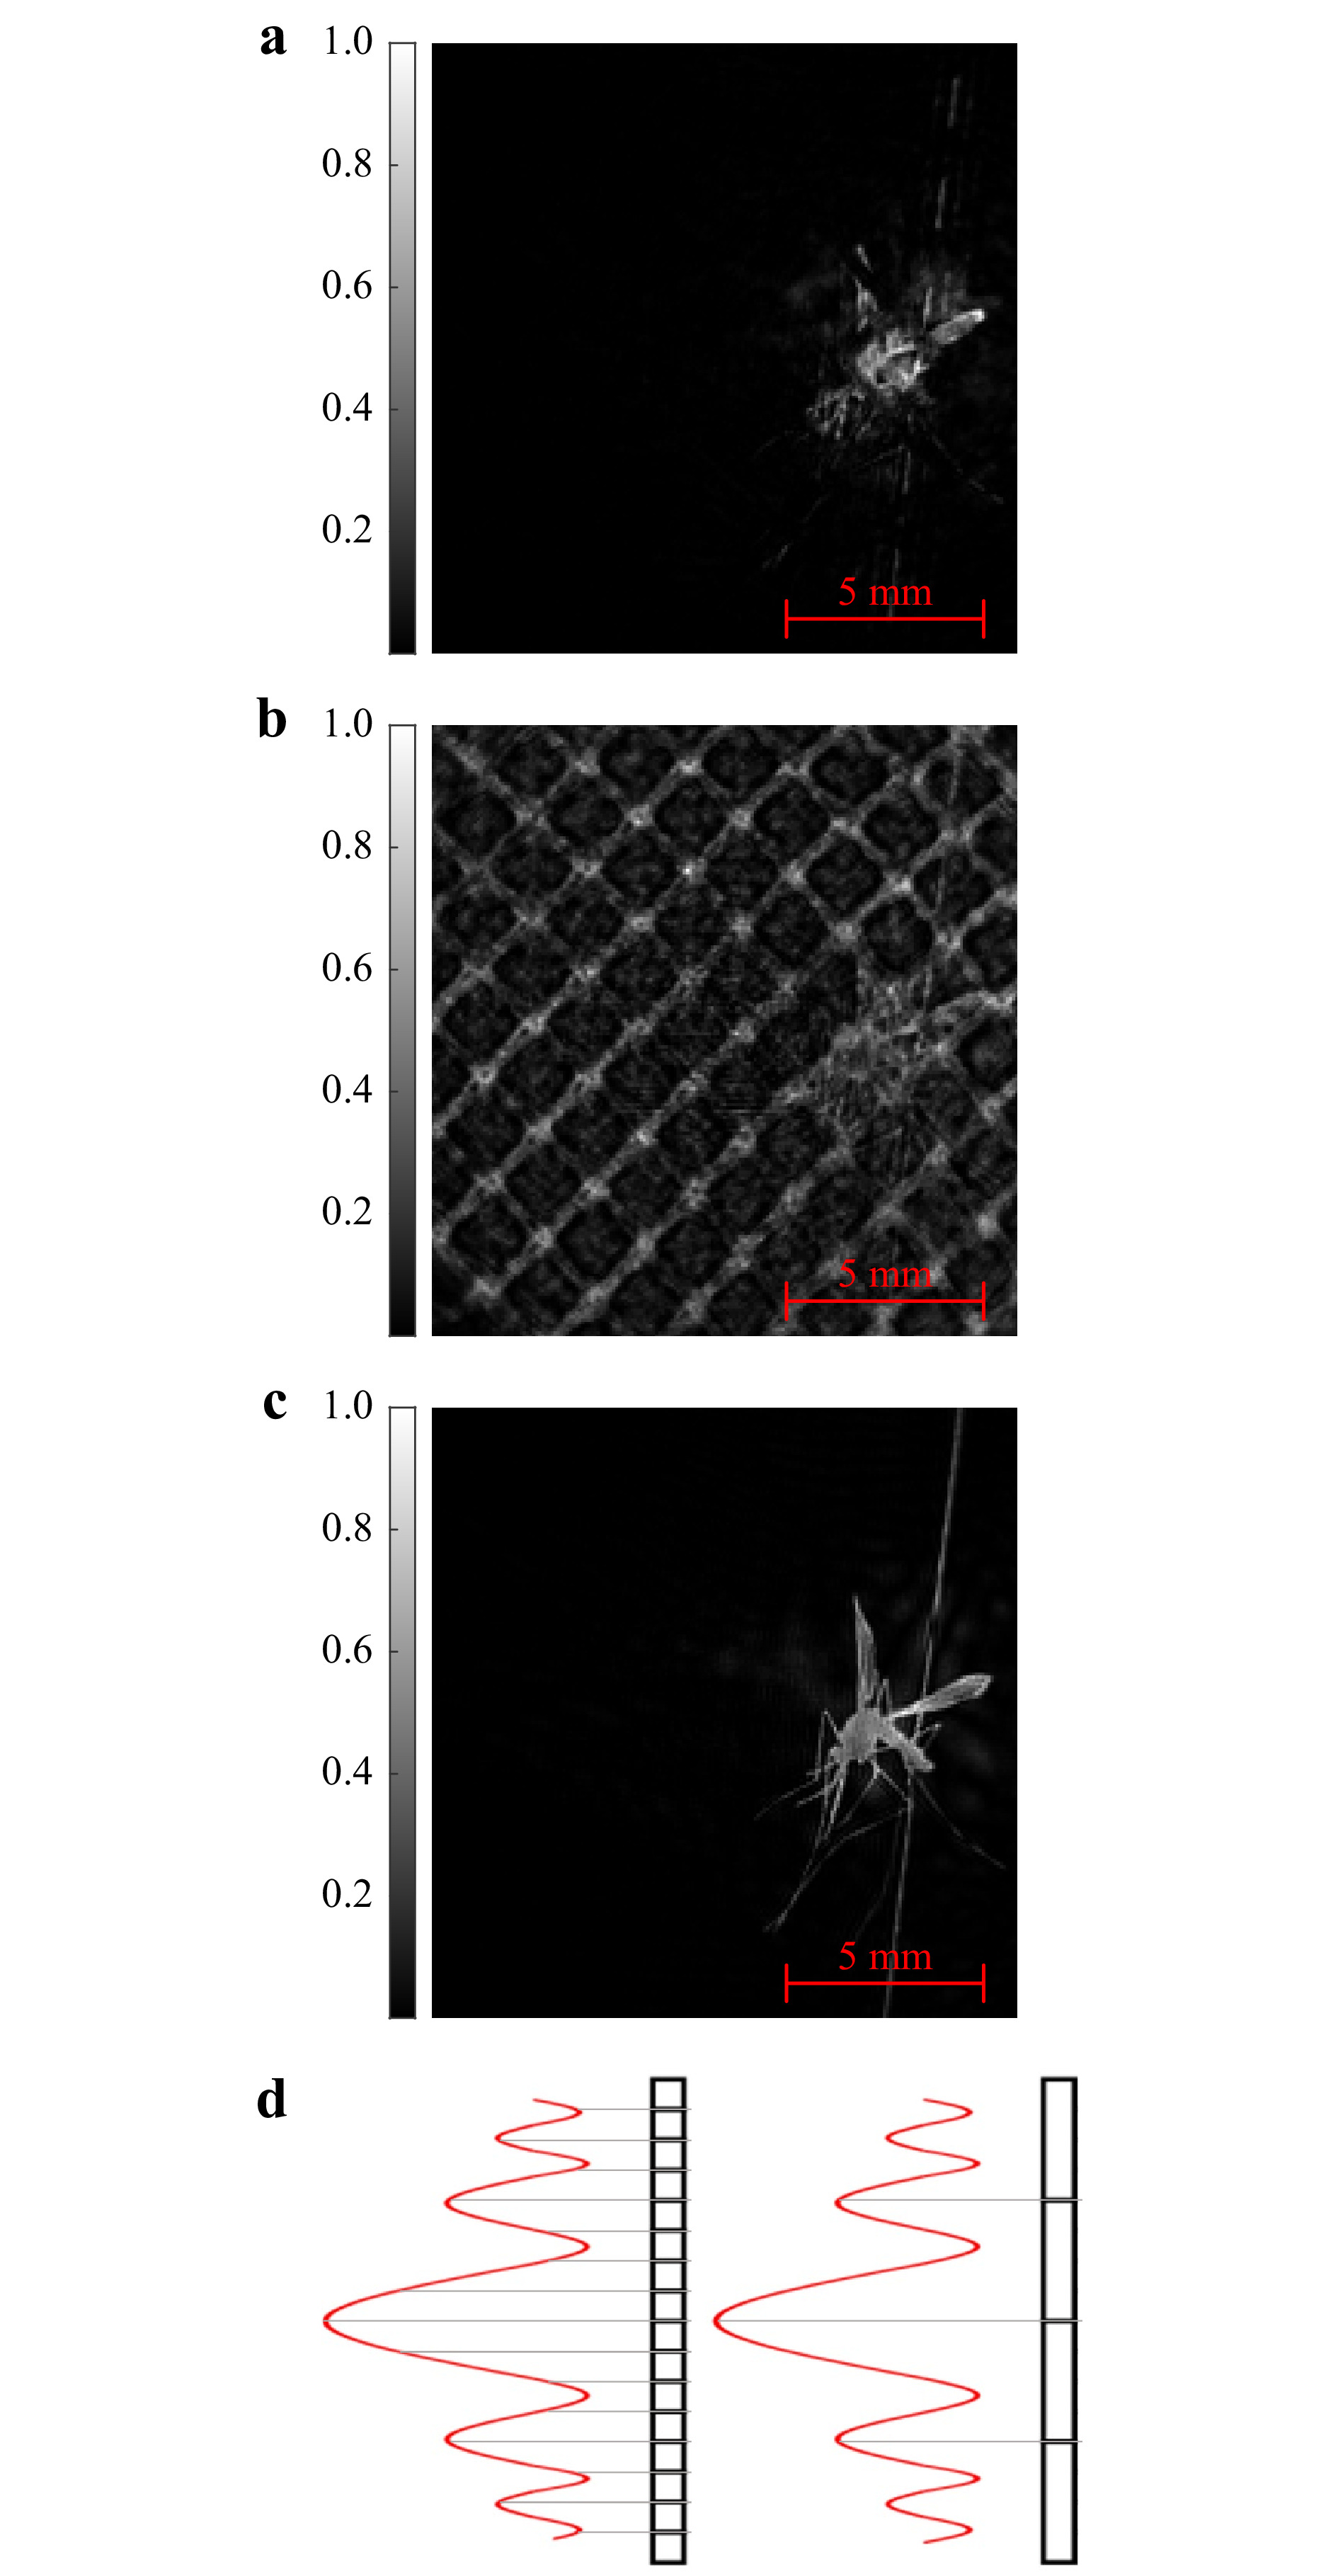
Fig. 9 Intensity reconstruction of a mosquito located
$ z_s=20 $ mm behind a bednet positioned at$ z=1.40 $ m a with and b without background net subtraction. c Reconstruction of the same mosquito recorded with no bednet (mosquito-only hologram). d Diagram to show sampling of diffracted wavefront with smaller and larger EPS.It is interesting to note the large change in minimum resolvable distance for the background removal method between EPS values of
$ \Delta{x}_e=78.13 $ µm and$ \Delta{x}_e=97.67 $ µm. As previously discussed, the EPS determines the sampling rate for which an interference pattern of a hologram is recorded and stored - Fig. 9d shows this qualitatively. The recorded diffraction pattern on the hologram plane is the superposition of the diffracted waves from: the mosquito, the bednet, plus the undisturbed reference wave. It is well known that the spatial extent in the XY plane of a diffraction pattern for a given object size increases as propagation distance increases. Therefore, increasing the object-to-hologram distance or, in this case, the mosquito-to-bednet distance may provide better distinction at the hologram between bednet and mosquito. Recording at a lower sampling rate (higher EPS) averages the combined signal, and if the Nyquist limit lies at an EPS value between$ \Delta{x}_e=78.13 $ µm and$ \Delta{x}_e=97.67 $ µm, the finer multi-object interference fringes between the mosquito and the bednet at lower z-axis separations may be lost. Further investigation into this, to determine if a critical$ \Delta{x}_e $ exists, may be conducted in future work.The minimum resolvable distance for the CCoFM method increases between each of the EPS values of 58.60 µm, 78.13 µm, and 97.67 µm, which is in-line with the result shown in Fig. 1 and was expected due to the decreasing Q-value in the single object focus metric curves as EPS increases. With a decreased Q-value, the superposition of two distinct curves into a single curve occurs at a larger z-axis separation and so a larger minimum resolvable distance is expected.
The CCoFM provides a methodology that is inherently temporally stable, as bednet background removal is not conducted and therefore movement of the bednet throughout the duration of a hologram time-series video recording will not influence the reconstruction and calculation of the focus metric curve. The downside of this method is that there are minimum resolvable distances between the bednet and mosquito, so accurate determination of close contact mosquito-bednet interaction is lost as the CCoFM second-pass focus metric becomes a curve with a single maxima. Fig. 10a shows the XY position of a dead mosquito manually moved in the XY plane over 30 frames (1 second) of a recorded video, where the z-axis position of the mosquito relative to the bednet was approximately
$ z_s=20 $ mm throughout the recording. Fig. 10b shows the CCoFM second-pass curves corresponding to three distinct frames, indicating a single peak for the mosquito-bednet reconstruction, meaning that resolving the two separate objects in the z-axis was unsuccessful using this method at this z-axis separation.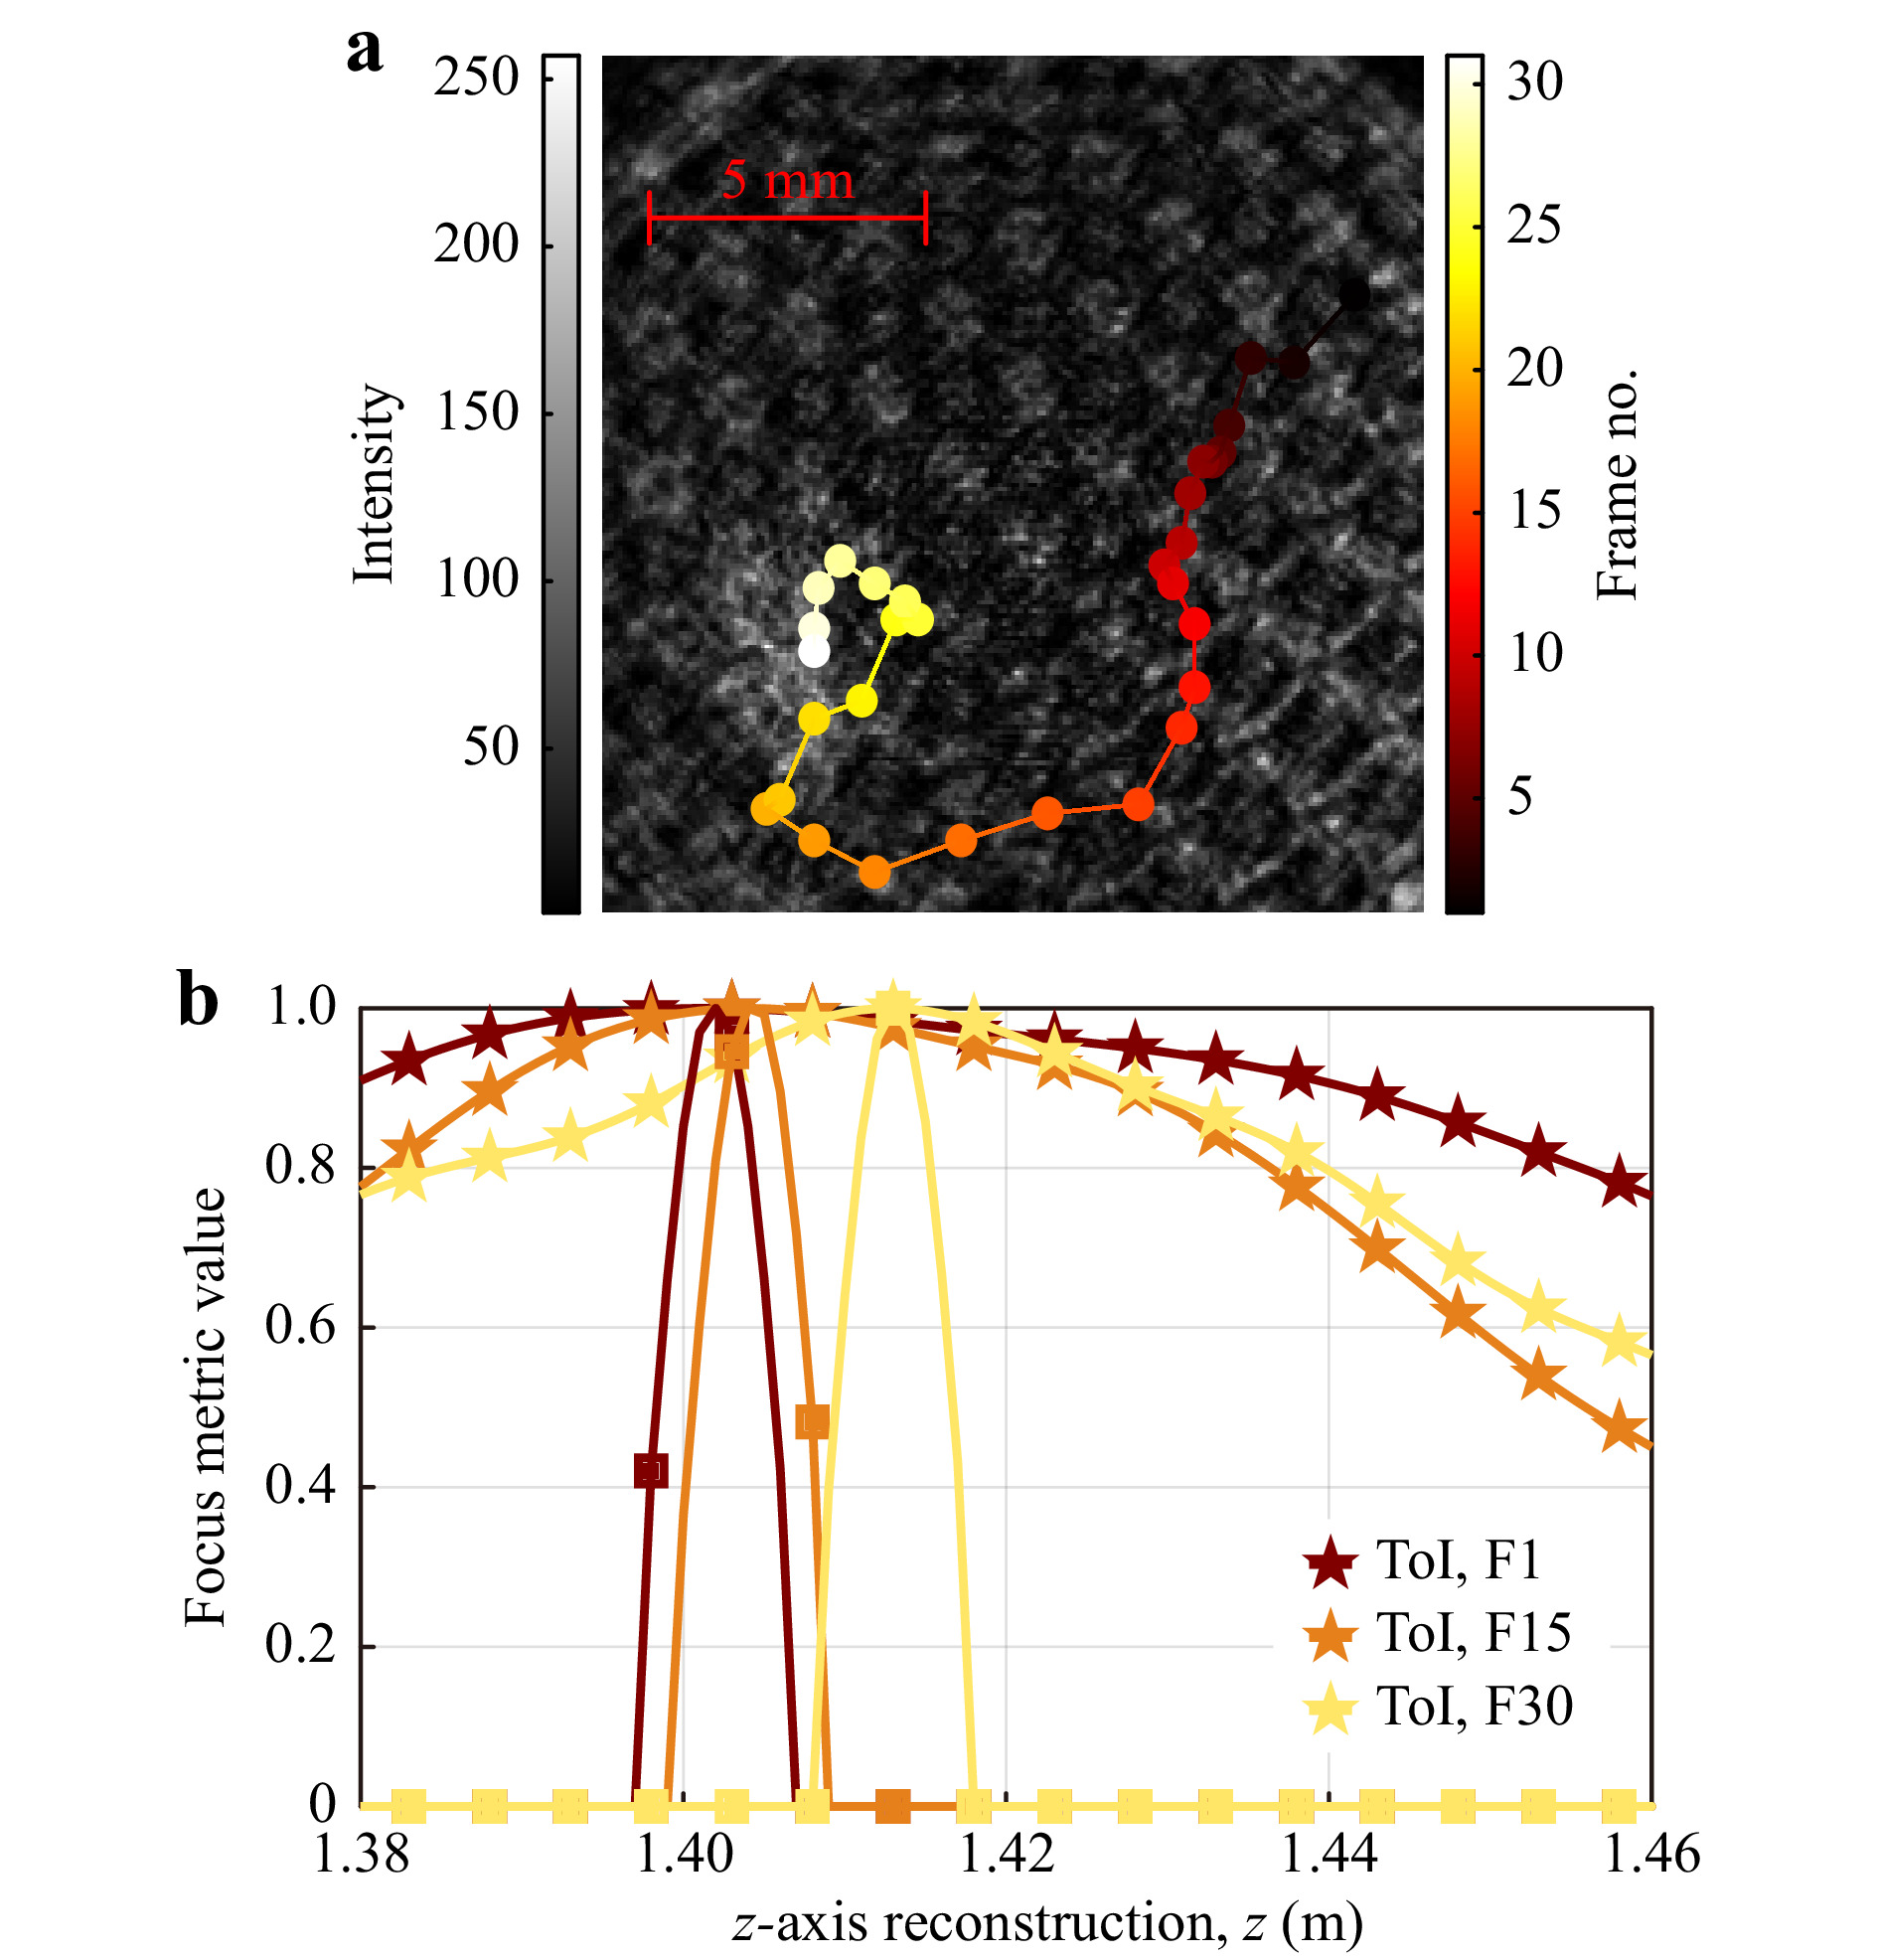
Fig. 10 a Time-series XY positions of a manually moved mosquito located
$ z_s\approx20 $ mm behind a bednet positioned at$ z=1.40 $ m. b Tamura of Intensity focus metric (stars) and second-pass cross-correlation (squares) displaying a single peak (Frames 1, 15, 30).Although the z-axis separation was not resolved in the case above, it can be concluded that a mosquito localised in XY featuring a single maxima in the second-pass CCoFM curve is located at
$ z_{mos}<z_{res} $ , where$ z_{res} $ is the minimum resolvable distance of that particular setup as shown in Table 1. A time-series mosquito position dataset with this condition included would allow a single mosquito to be tracked pre-, during, and post- bednet interaction even though the precise 3D interaction for$ z_{mos}<z_{res} $ would not be determined. In previous studies, mosquito behaviour has been quantified into distinct categories, with movement close to the bednet below a certain velocity threshold classified as ‘resting’37. The CCoFM method combined with an appropriate tracking algorithm could therefore be useful in accurately determining resting time(s) and estimating a pseudo-dosage of insecticide that a mosquito receives.In this paper, we have demonstrated that digital holography offers the potential to examine 3D mosquito flight behaviour in a large volume where conventional imaging systems may be less effective. A physical experimental setup for the large field of view (240 × 240 × 1000 mm) recording of in-line digital holograms was presented. Intensity reconstructions of mosquitoes in full-flight were also presented, demonstrating that 3D localisation of a flying mosquito and reconstruction of smaller fast-moving features, such as the legs, body, and wings, was possible using digital holographic techniques. Applying this methodology to a time-series of holograms allows the accurate determination of mosquito tracks in 3D coordinates. Simulations and physical data were used to examine the concept of localisation of a mosquito obscured by a bednet, as accurately determining mosquito-bednet interaction is of particular biological importance in the development of intervention methods to reduce malaria transmission in humans. A novel Cascade-Correlation of Focus Metric was introduced for the accurate reconstruction and localisation of a mosquito occluded by a bednet and compared to a simple bednet subtraction technique. The benefits and limits of each approach were considered with regards to, experimental design, z-axis resolution limits, and upper limits for mosquito-bednet distance. Potential biological applications were also discussed, and it is anticipated that biologically significant experiments will be performed in future work. The result of this study is a scalable digital holographic methodology to examine mosquito flight in 3D at a level of accuracy previously only seen in 2D imaging of a smaller volume, and the ability to resolve 3D mosquito-bednet interaction of mosquitoes occluded by a bednet for the first time. For accurate and reliable kinematic analysis of mosquito flight close to a bednet, detailed 3D imaging is crucial to correct errors in the unknown third axis that are present when using 2D imaging, and digital holography offers a potential solution.
-
A continuous wave 130 mW CrystaLaser DL785-150-SO with a wavelength of 785 nm provides illumination of the scene by expanding and spatially filtering the beam through an objective lens and aperture (expansion optics, EO). Two neutral density filters are placed between the laser head and spatial filter, consisting of OD = 1.5 and OD = 0.3, which reduces transmission of light to 1.7%, equating to approximately 2 mW of power. This would allow a theoretical increase in area of 64 × (8 × radius) if utilising the full 130 mW of laser power available for the same power density interacting with the object.
The collimating optic (CO) provides plane wave illumination through the object volume. The laser light is subjected to forward scattering at the mosquito, and the combined mosquito-object wave and plane reference wave then propagates through free space. This combined wave is focused through a focusing optic (FO) and imaging optic (IO) in a two-component telecentric system onto a sensor (CCD), where the interference pattern is recorded as a digital hologram. A schematic of the collimated cylindrical probe volume and telecentric demagnification system is shown in Fig. 11.
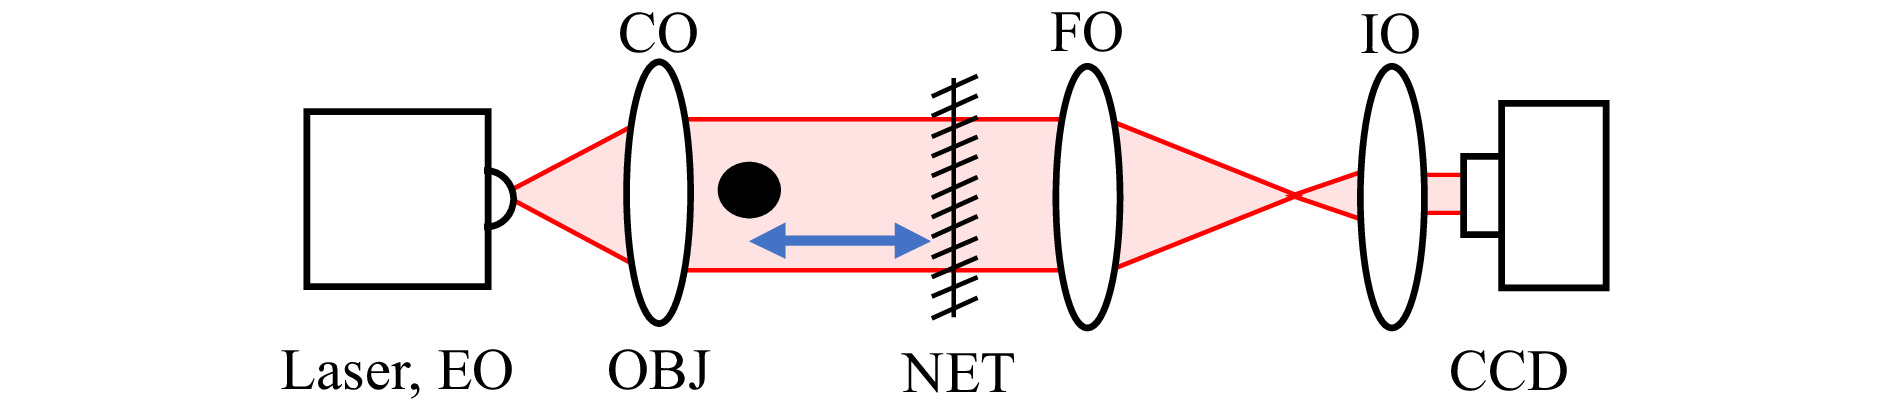
Fig. 11 Experimental setup for optical recording of a digital in-line hologram with a demagnifying two-lens telecentric system. CO: collimating optic, FO: focusing optic, IO: imaging optic, CCD: sensor array.
In the large-scale experiment (see Large Field of View Mosquito Reconstructions), the collimating optic (CO) and focusing optic (FO) were 355 mm diameter off-axis parabolic mirrors with a focal length of 2540 mm, set up in a Z-type interferometer configuration. The imaging optic was a 25.4 mm diameter plano-convex lens with a focal length of 175 mm, providing a demagnification factor (
$ M_D $ ) of 14.53 × and an effective pixel size of 79.93 µm in the recording volume. The sensor was a Ximea CB120RG-CM 4096 × 3072 pixel camera with pixel size of 5.5 µm.For the bednet validation experiments (see Mosquitoes Obscured by a Bednet), the collimating optic was a 25.4 mm plano-convex lens with a focal length of 500 mm, and the two-component telecentric system consisted of 25.4 mm plano-convex lenses with 500 mm and 50 mm, 400 mm and 30 mm, and 500 mm and 30 mm focal lengths to yield effective pixel sizes of 58.60 µm (
$ M_D=10.00\;\times $ ), 78.13 µm ($ M_D=13.33\;\times $ ), and 97.67 µm ($ M_D=16.67\;\times $ ), respectively. These EPS values were chosen based on the results shown in Fig. 1 and previously conducted work28. The sensor was a Dalsa Genie Nano M1920 1936 × 1216 camera with a pixel size of 5.86 µm. These validation experiments were conducted before access to the OAP mirrors was possible, and are included to provide proof-of-concept physical data of the obscured-mosquito localisation techniques at a comparable EPS to the larger field-of-view experiments in Large Field of View Mosquito Reconstructions. This smaller system can be scaled to a larger recording volume by increasing the number of pixels on the sensor and using larger collimating and focusing optics, while maintaining the effective pixel size, wavelength, and object size. -
To assess the noise levels in the background images, the first 100 frames of data were assessed from the 12-bit Ximea recordings with a time stationary scene. The mean intensity across the frames was 1865 with a spatial standard deviation of 255 gray levels. However, with background subtraction, the standard deviation decreased to 80 grey levels. Methods to reduce this speckle such as using a shorter coherence length light source to reduce multiple reflections and scattering between the two panes of glass in the flight chamber will be the subject of further study. The number of pixels above 80% of the saturation (i.e. 80% of 4095) and below 20% are 1 and 1182, respectively (out of 9 million), meaning that the assumption that the recording is within the linear range of the CCD/CMOS array is valid. When a mosquito is introduced, these numbers are 1 and 3782, respectively, due to the mosquito blocking out some of the light, and hence the larger number of dark pixels. Along the time-axis of the first 100 images, the pixel-to-pixel standard deviation, for a random sample of 5 pixels, is 17.51, 6.46, 14.20, 14.22 and 21.16 grey levels, yielding a noise level of 1.2% for the standard deviation of 21.16 compared to the same pixel's mean intensity.
Fig. 12 shows a typical cross-section of a mosquito signal after a background subtraction. The grey level minimum of the mosquito signal is −1621 with diffraction patterns giving local minima at −913 and −596 visible on the left hand side, significantly above the temporal noise level of approx 20 grey levels and spatial noise level of approx 80 grey levels.
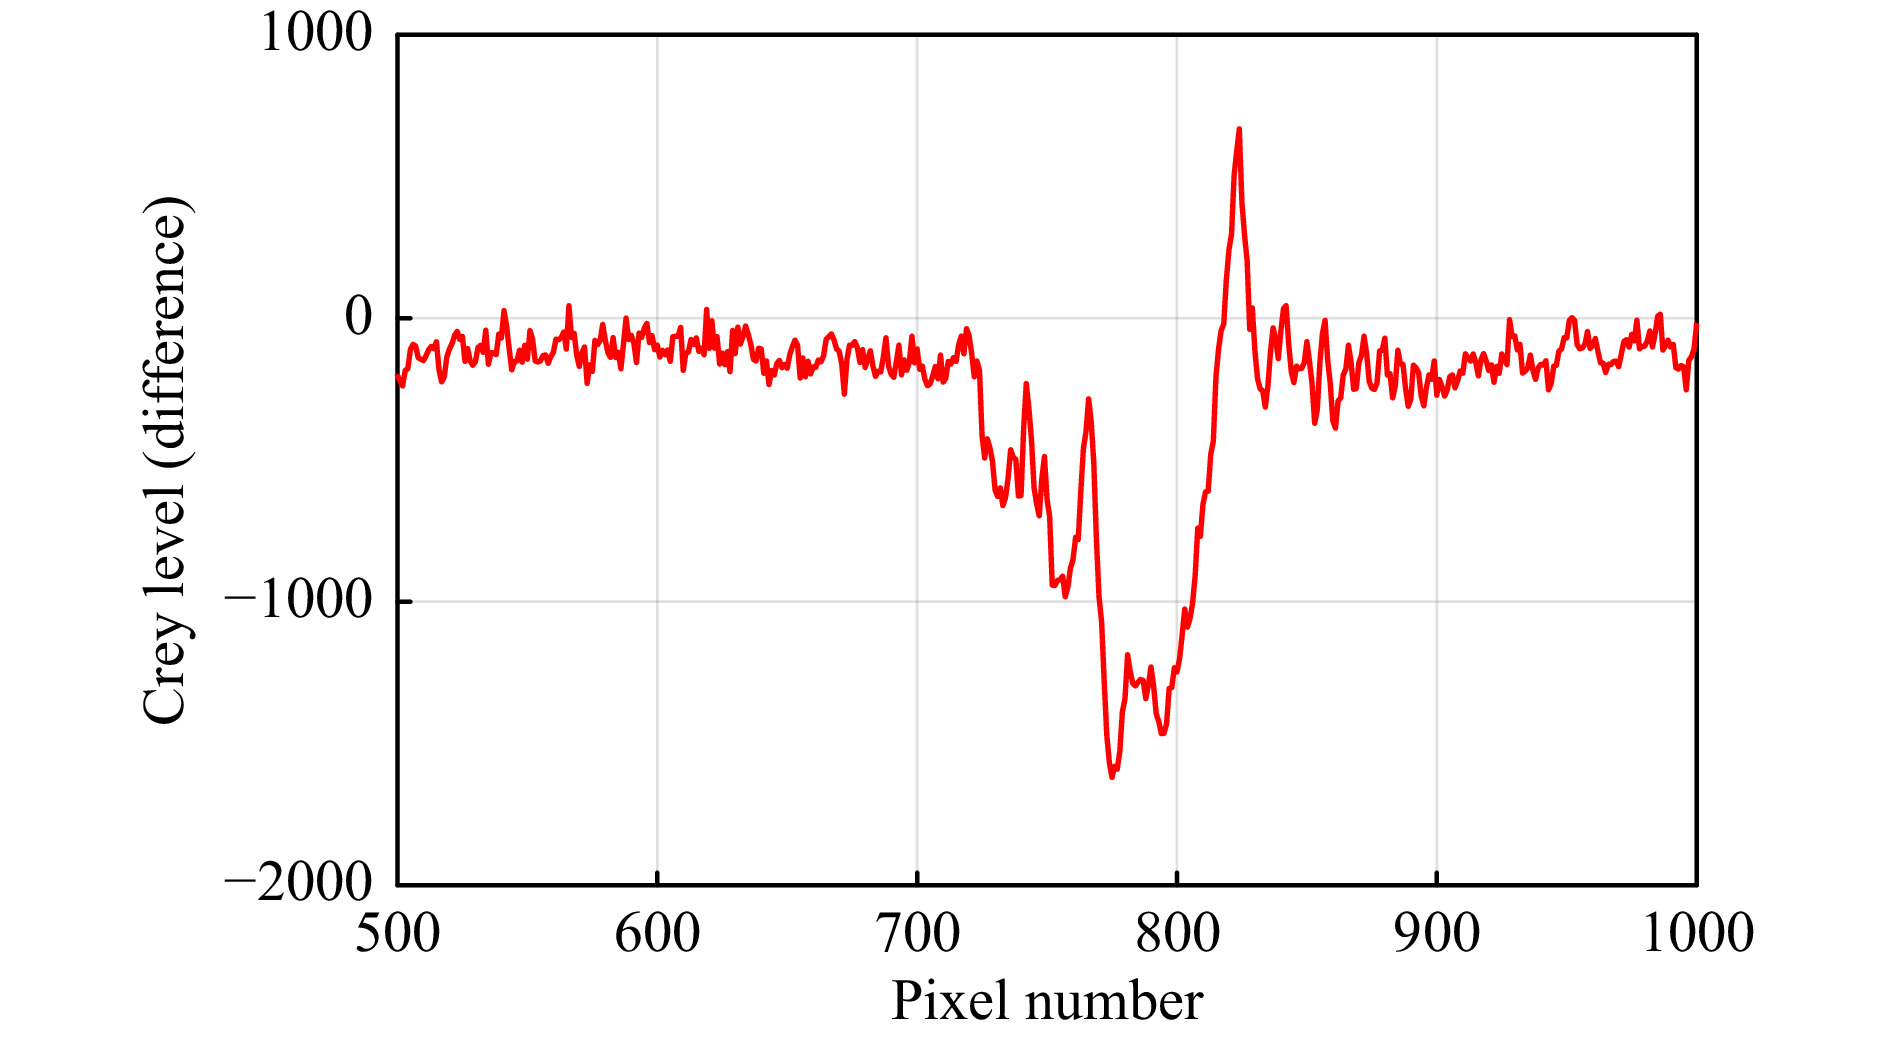
Fig. 12 Typical cross section of a mosquito hologram subject to background subtraction, indicating the grey level and pixel number.
-
Bednets are composed of nylon fibres, which have an index of refraction of n = 1.5 and an approximate diameter of 100 µm (or approximately 125λ at 785 nm), which are twisted into threads of approximately 4-5 fibres each. The threads are woven into a regular net with an aperture size of approximately 2.5 mm (approx. 3000λ). The aperture size is set to block passage of mosquitoes whilst allowing flow of air to the occupants. The nylon fibres are optically opaque and hence the optical field after transmission is governed by the components passing through the apertures in the net structure. Hence the bednet can be defined as a transmission function where
$ T_B (x,y)=0 $ for all locations B corresponding to the nylon fibres and$ T(x,y)=1 \; \forall \; (x,y) \notin B $ . Similarly, the mosquito can be considered as a transmission function$ T_M (x,y)=0 $ for all points M corresponding to the mosquito and$ T(x,y)=1 \; \forall \; (x,y) \notin M $ . The validity of these assumptions is supported by the comparisons between experimental and synthetic data used to evaluate the performance of the focus metric algorithms and in which the optical fields are manipulated by the aforementioned transmission functions.The smallest feature of interest in the physical experiments are the legs of a mosquito, which have a diameter of 80 µm (or 100λ at 785 nm)38. The forward scattering numerical aperture is given by
$ \theta=1.22\lambda/d $ , where λ is the wavelength, and d is the diameter of the object. This yields a forward scattering numerical aperture of$ {\rm{NA}}\sim0.012 $ . The much larger numerical aperture of the off-axis parabolic mirrors ($ {\rm{NA}}\sim0.07 $ ) means that the full scattering angle is captured, and the most relevant limiter of the optical system performance in this paper is the effective pixel size, which is a direct result of the discretised sampling of a diffraction pattern on a digital CCD/CMOS sensor. -
The reconstruction of a scene from a digitally recorded hologram requires the calculation of the resultant reconstruction images by applying the discrete propagation formulae between multiple planes in small increments (
$ z_{inc} $ ) away from the hologram. The degree of focus of a reconstructed scene is highest at the z-axis position of the axial object location at the time of recording. The 3D position of the object can therefore be determined from a single hologram. -
Reconstruction using the recorded digital holograms was achieved by performing a two-step thin-lens fourier transform operation to simulate propagation through the two-component telecentric system in reverse, with specific focal lengths according to the optics used to record the hologram. Back-propagation into the object space was performed using a Fresnel transfer function method39. The scene was reconstructed on multiple planes with a z-axis increment of
$ z_{inc}=2 $ mm and focus metrics were calculated for each mosquito found in a reconstructed plane. -
For a non-obscured free-flying mosquito, a simple thresholding technique can be used to identify the XY position of mosquitoes from a hologram. The hologram is thresholded to reveal distinctly bounded areas from the diffraction patterns of forward scattered objects, where the centre of mass of each area is the XY position of a mosquito.
However, for a scene involving a mosquito behind a bednet, additional image processing techniques are used to extract the lateral object position(s). In this case, a two-pass cascade-correlation technique is used. To explain the cross-correlation process, two intensity images need to be defined: a cropped mosquito-only mask,
$ I_M $ , (shown by the dashed line in Fig. 13a); and a combined mosquito and bednet recorded hologram,$ I_{M,B} $ (Fig. 13b). The first step is that$ I_M $ is cross-correlated against$ I_{M,B} $ , shown by: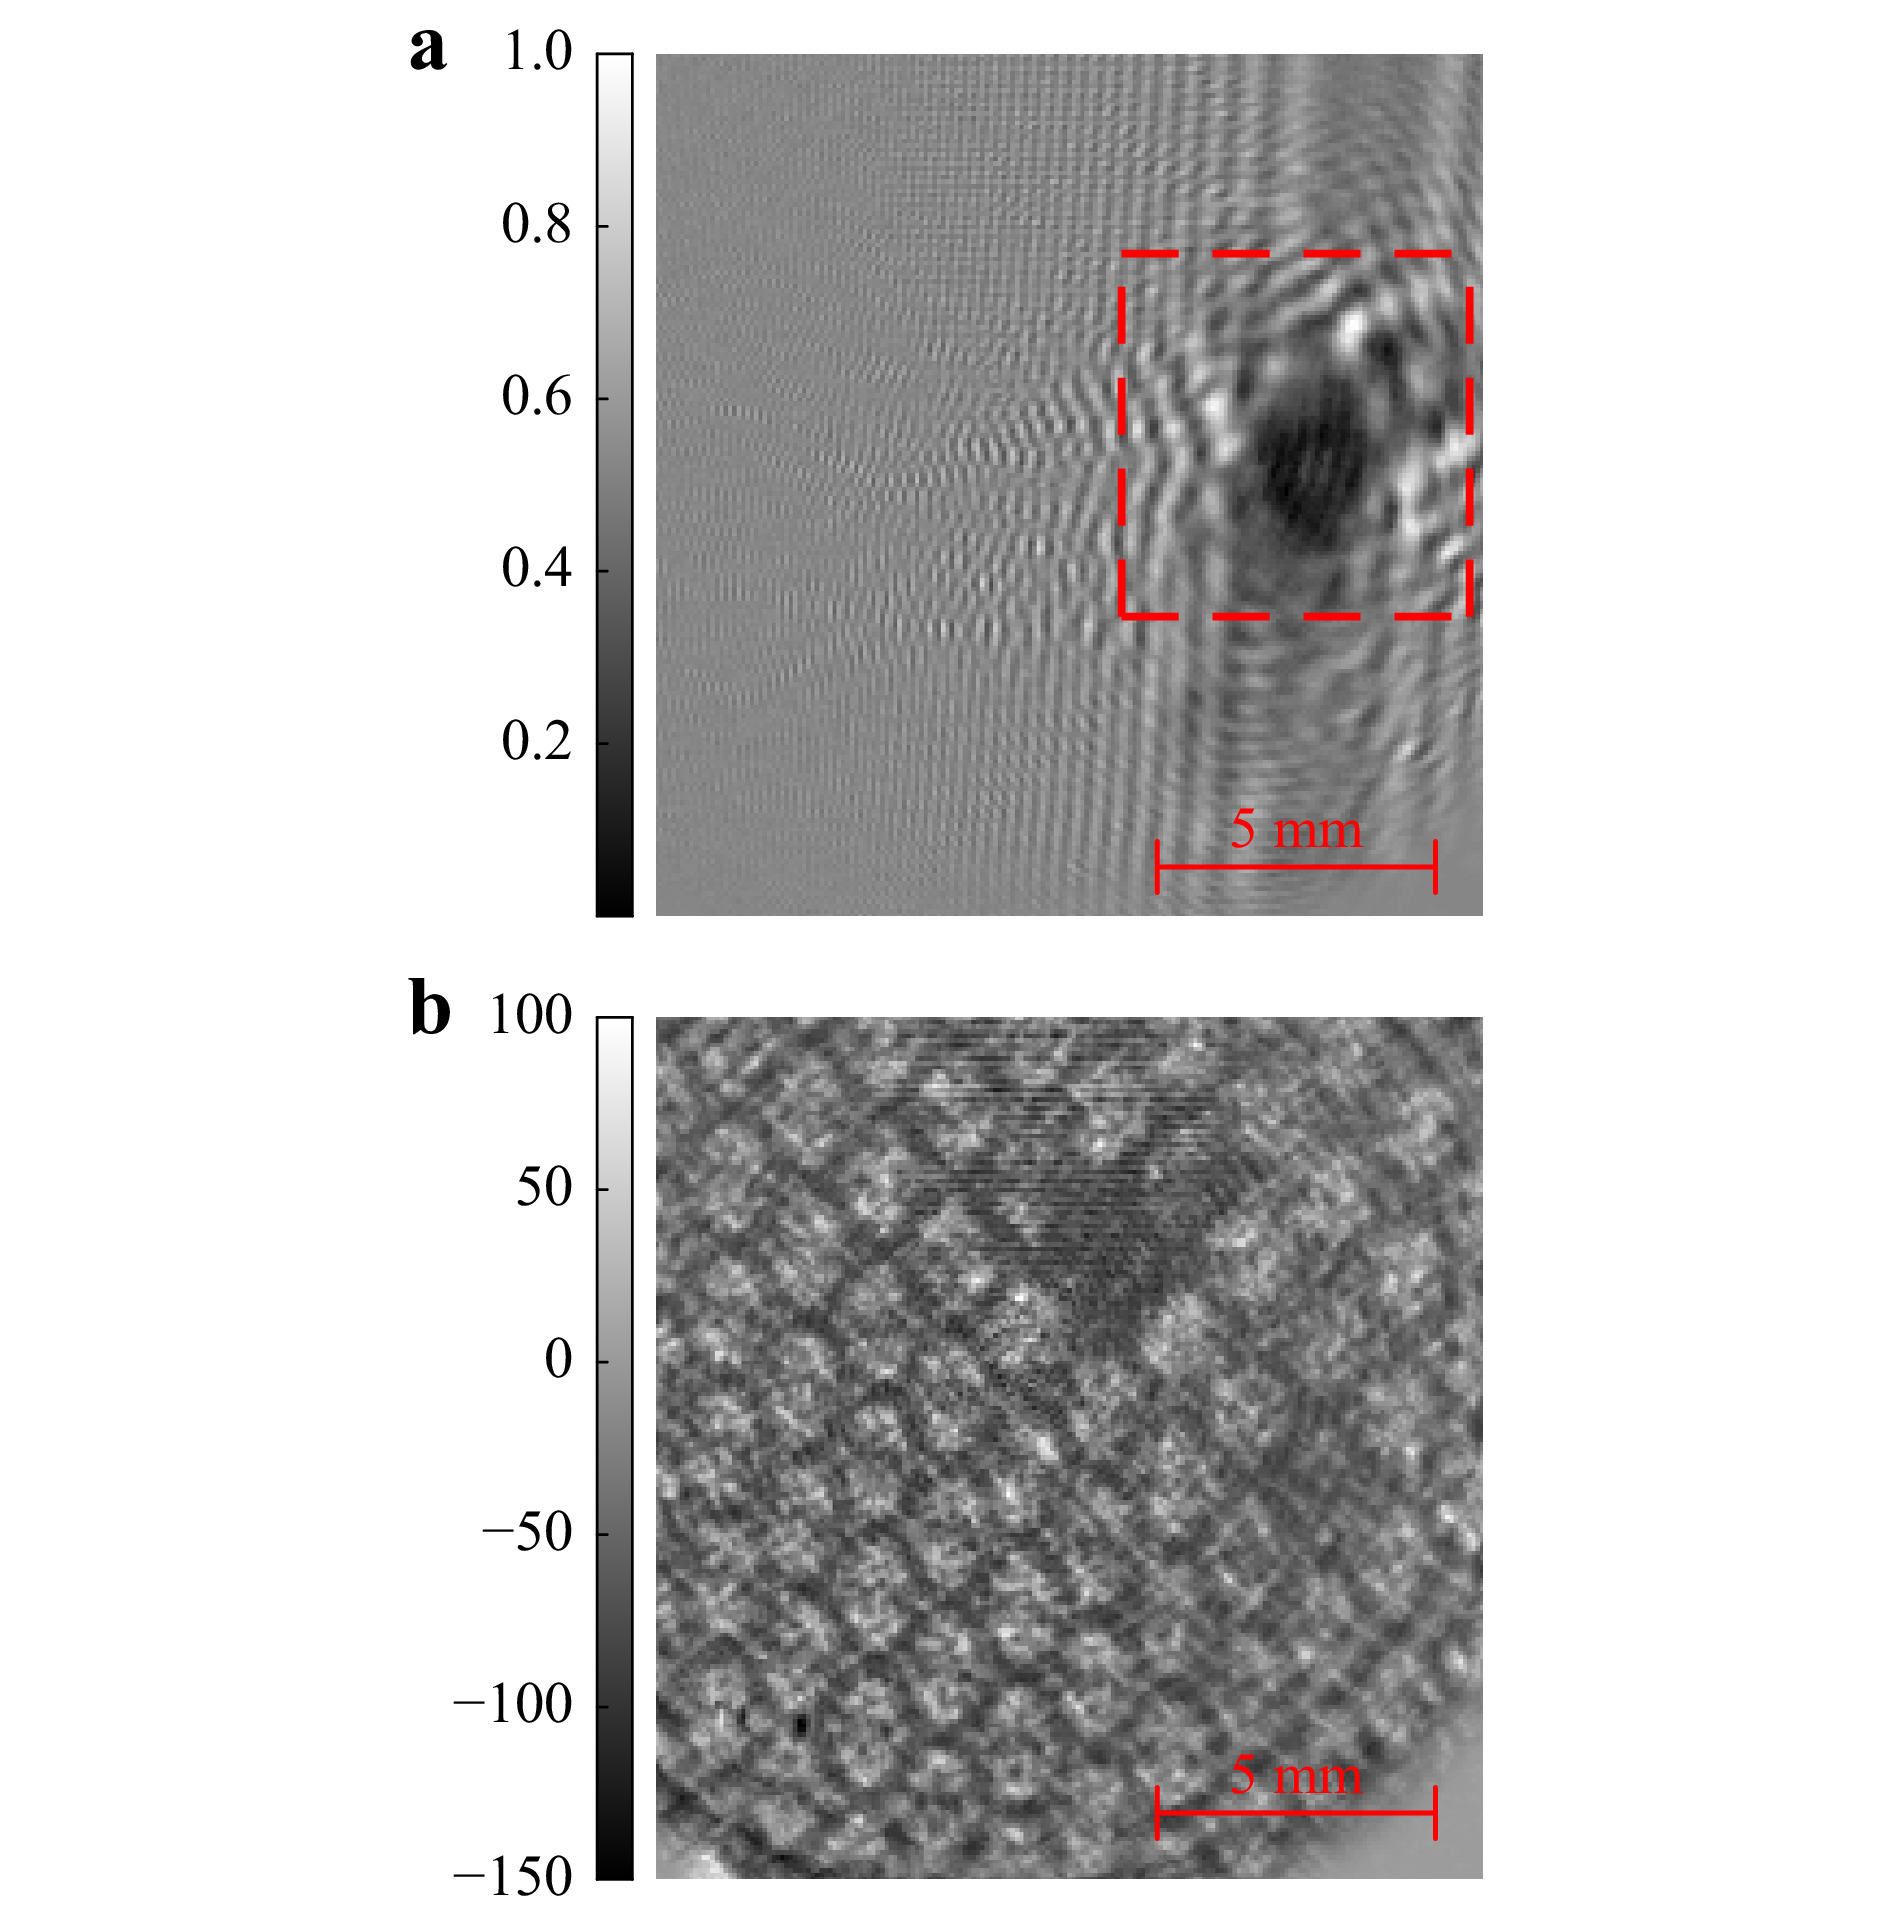
Fig. 13 a Mosquito-only hologram (mask outlined). b Mosquito-bednet hologram of mosquitoes 40 mm (left) and
$ 55 $ mm (right) behind a bednet at$ z=1.40 $ m.$$ C_1 = I_M*I_{M,B} $$ (1) Where
$ C_1 $ is the first-pass cross-correlation map shown in Fig. 14a. The primary peak in this cross-correlation map indicates the XY position of the mosquito, although several smaller peaks exist due to the holes in the bednet. Thresholding of the cross correlation map removes these smaller peaks, resulting in a thresholded map$ C_{1,t} $ . A threshold value of 0.18 was adequate to remove these smaller peaks without removing the primary peak. This threshold was found by cross-correlating the mask,$ I_M $ , with a bednet-only hologram,$ I_B $ , and the peak of this correlation map was found. The mask selection, in terms of mosquito orientation and distance from the hologram plane, is not as important as maybe expected. For example, for the case of a mosquito placed 100 mm behind a bednet positioned at$ z = 900 $ mm, a mask from a mosquito 1400 mm away from the hologram plane is more similar to the mosquito behind the bednet ($ z=1000 $ mm) than the bednet itself ($ z = 900 $ mm). The absolute similarity between the mask and target is not as important as the difference in correlation between the bednet and the mosquito - the cross-correlation peak indicating the mosquito position can be isolated from the background correlation map, especially after thresholding. Therefore, this mask can also be created using a simulated mosquito-only hologram or a pre-recorded reconstruction of an object of a similar size to a mosquito recorded at the same EPS and with the same incremental distance between reconstructed z-planes. To improve contrast and further refine the lateral position, a secondary mask is formed by an auto-correlation of$ I_M $ , such that: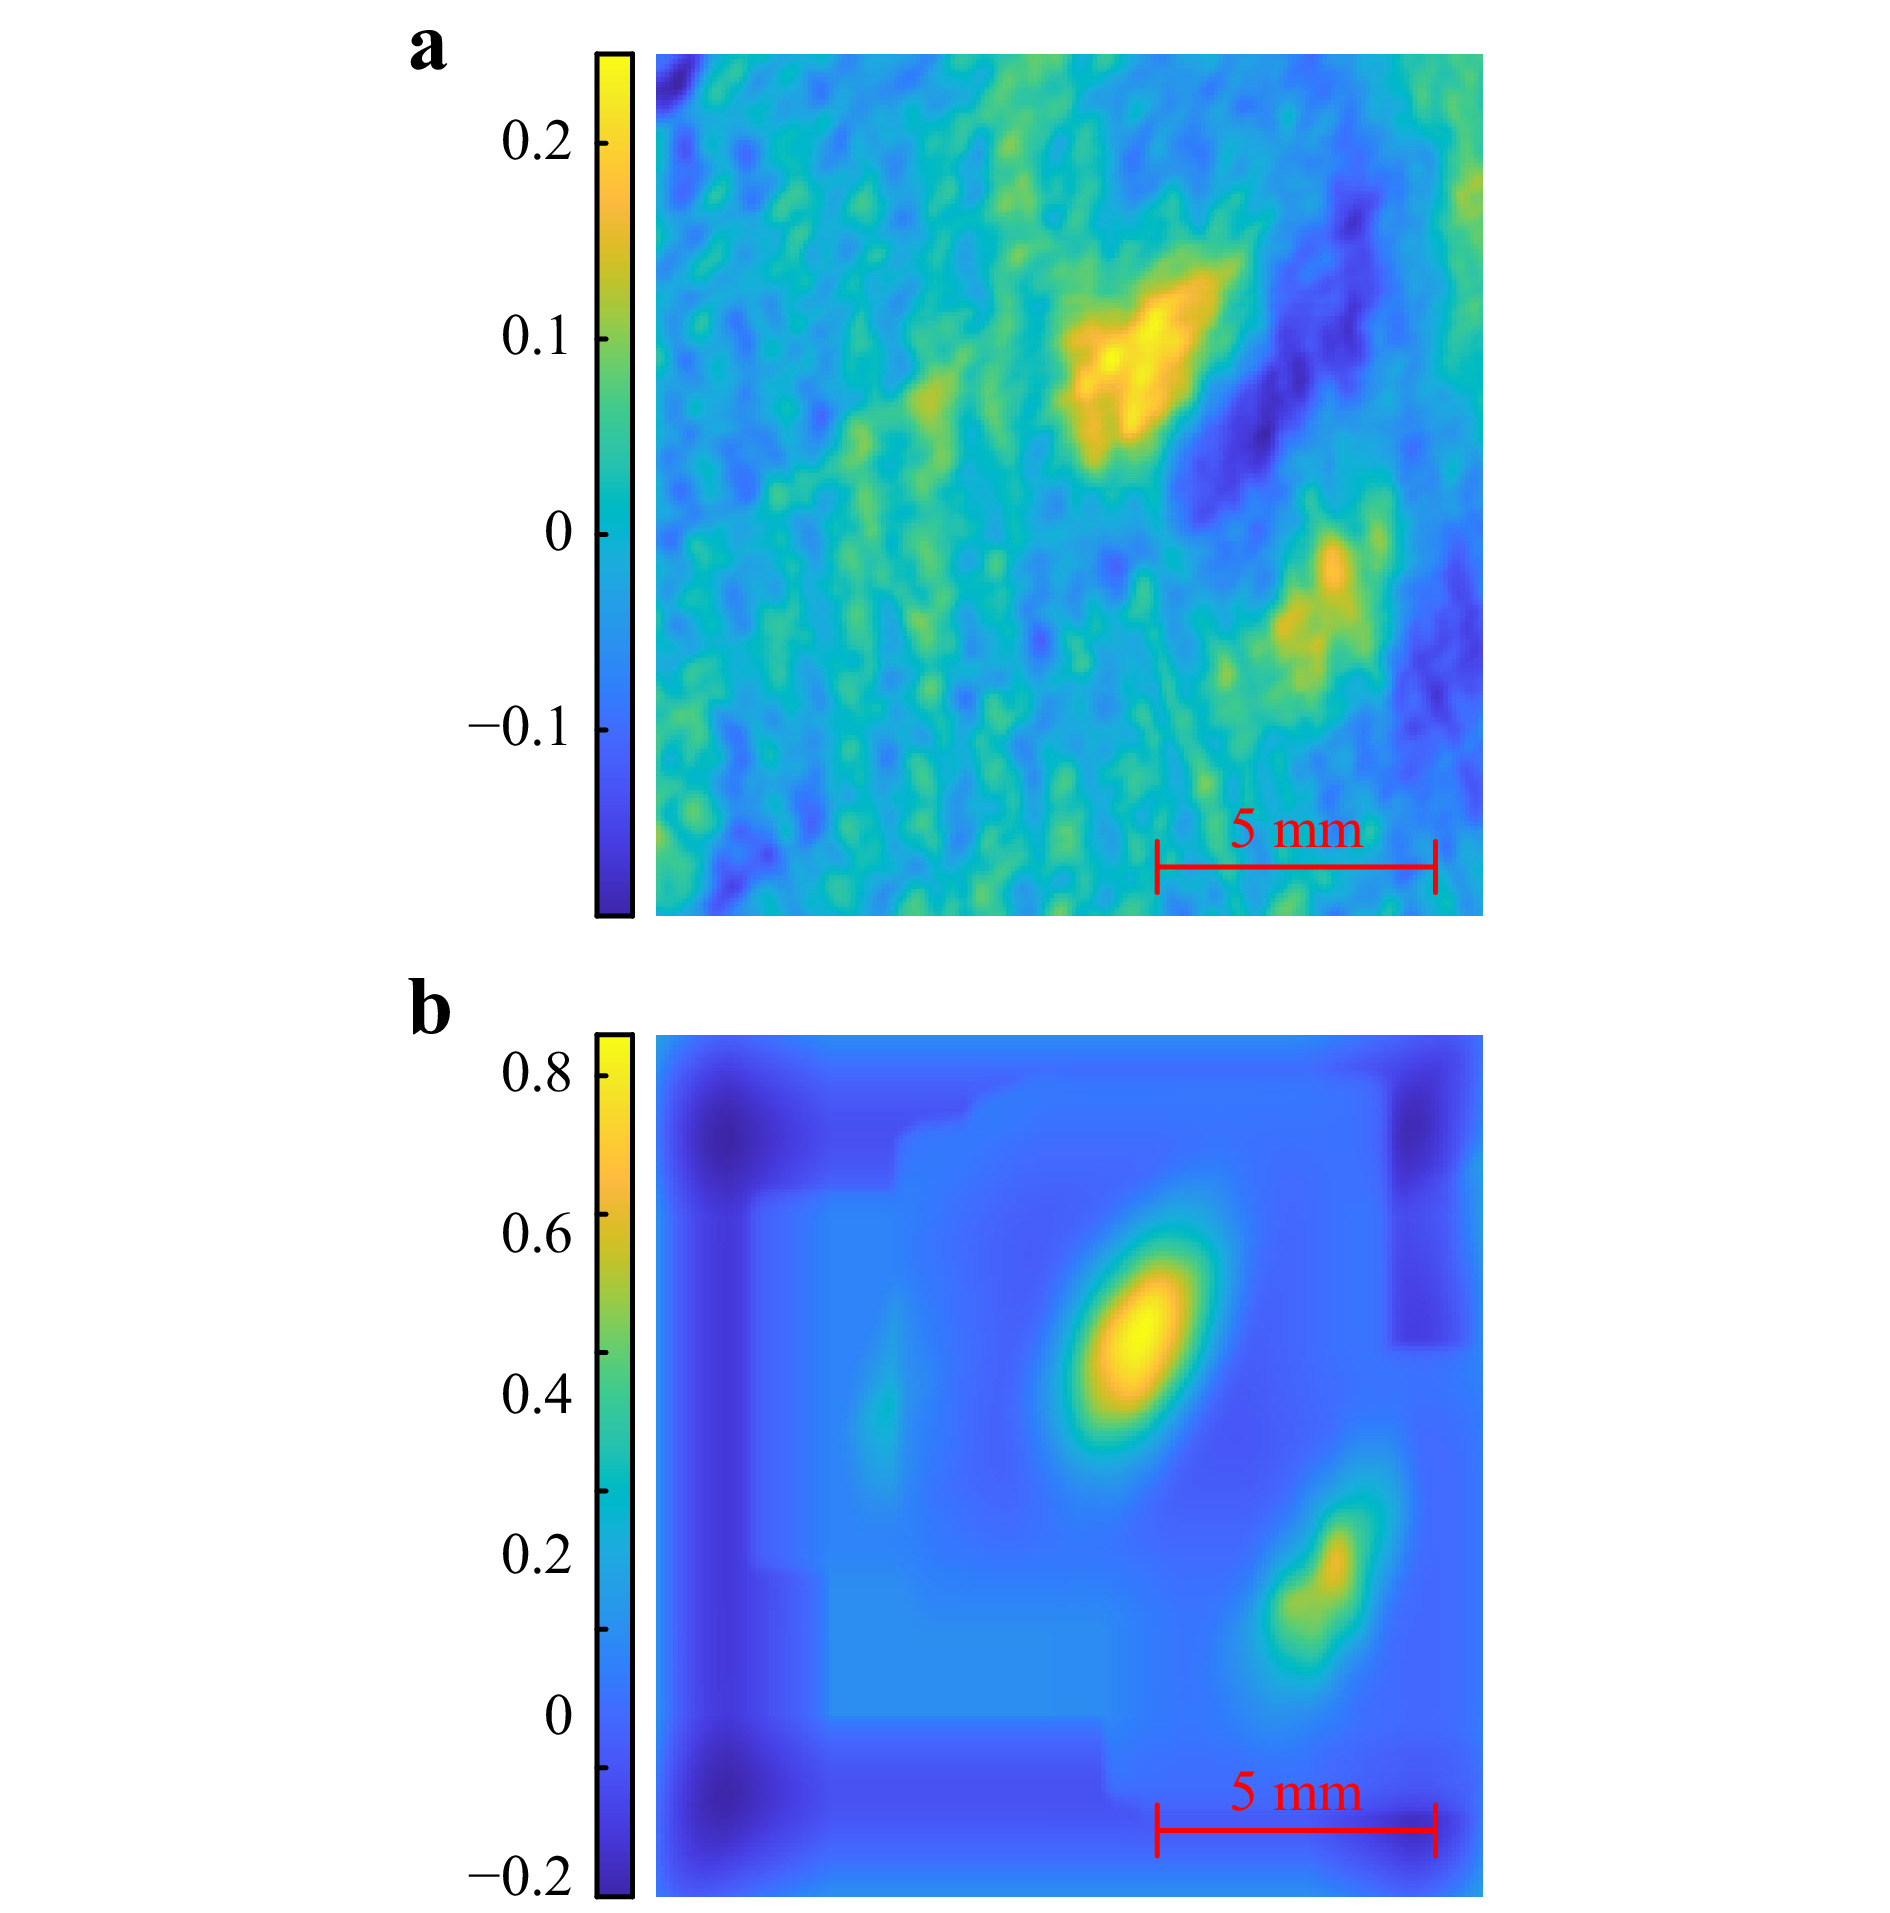
Fig. 14 a First-pass cross-correlation between mask and mosquito-bednet hologram. b Second-pass cross-correlation map, indicating the mosquito XY positions.
$$ I_{M2} = I_M*I_M $$ (2) This step calculates a 2D gaussian function using the original mask, and this secondary mask is cross-correlated against the thresholded first-pass cross correlation by:
$$ C_2 = I_{M2}*C_{1,t} $$ (3) where C2 is the second-pass cross correlation map as shown in Fig. 14b. This correlation map indicates the position of two mosquitoes behind the bednet. Intuitively, the easier to spot mosquito in Fig. 13b corresponds to a stronger cross-correlation in Fig. 14b.
-
The peak of a focus metric determines the Z-axis position of a reconstructed object. Previous work indicates that the proposed particle signature function focus metric25, 28 works well for resolving multiple objects, as shown in Effect of Imaging Resolution on Localisation Accuracy, but is less effective in the case of a mosquito obscured by a bednet due to the disturbed reference wave diffracting through the lattice-structure. Fig. 15a, below, shows the focus metric curves of a dead anopheles gambiae mosquito placed
$ z=55 $ mm behind a bednet positioned at$ z=1.40 $ m (mosquito on the right in Fig. 13b). Examining the edge-gradient and Tamura-of-Intensity focus metric curves reveals that these methods are less susceptible to the phase profile created by the disturbed reference wave through the lattice-structured bednet and that the ToI focus metric has two maxima in the approximate z-axis positions of the bednet and mosquito. The phase-based particle signature function focus metric curve contains additional peaks which give false-positive mosquito positions.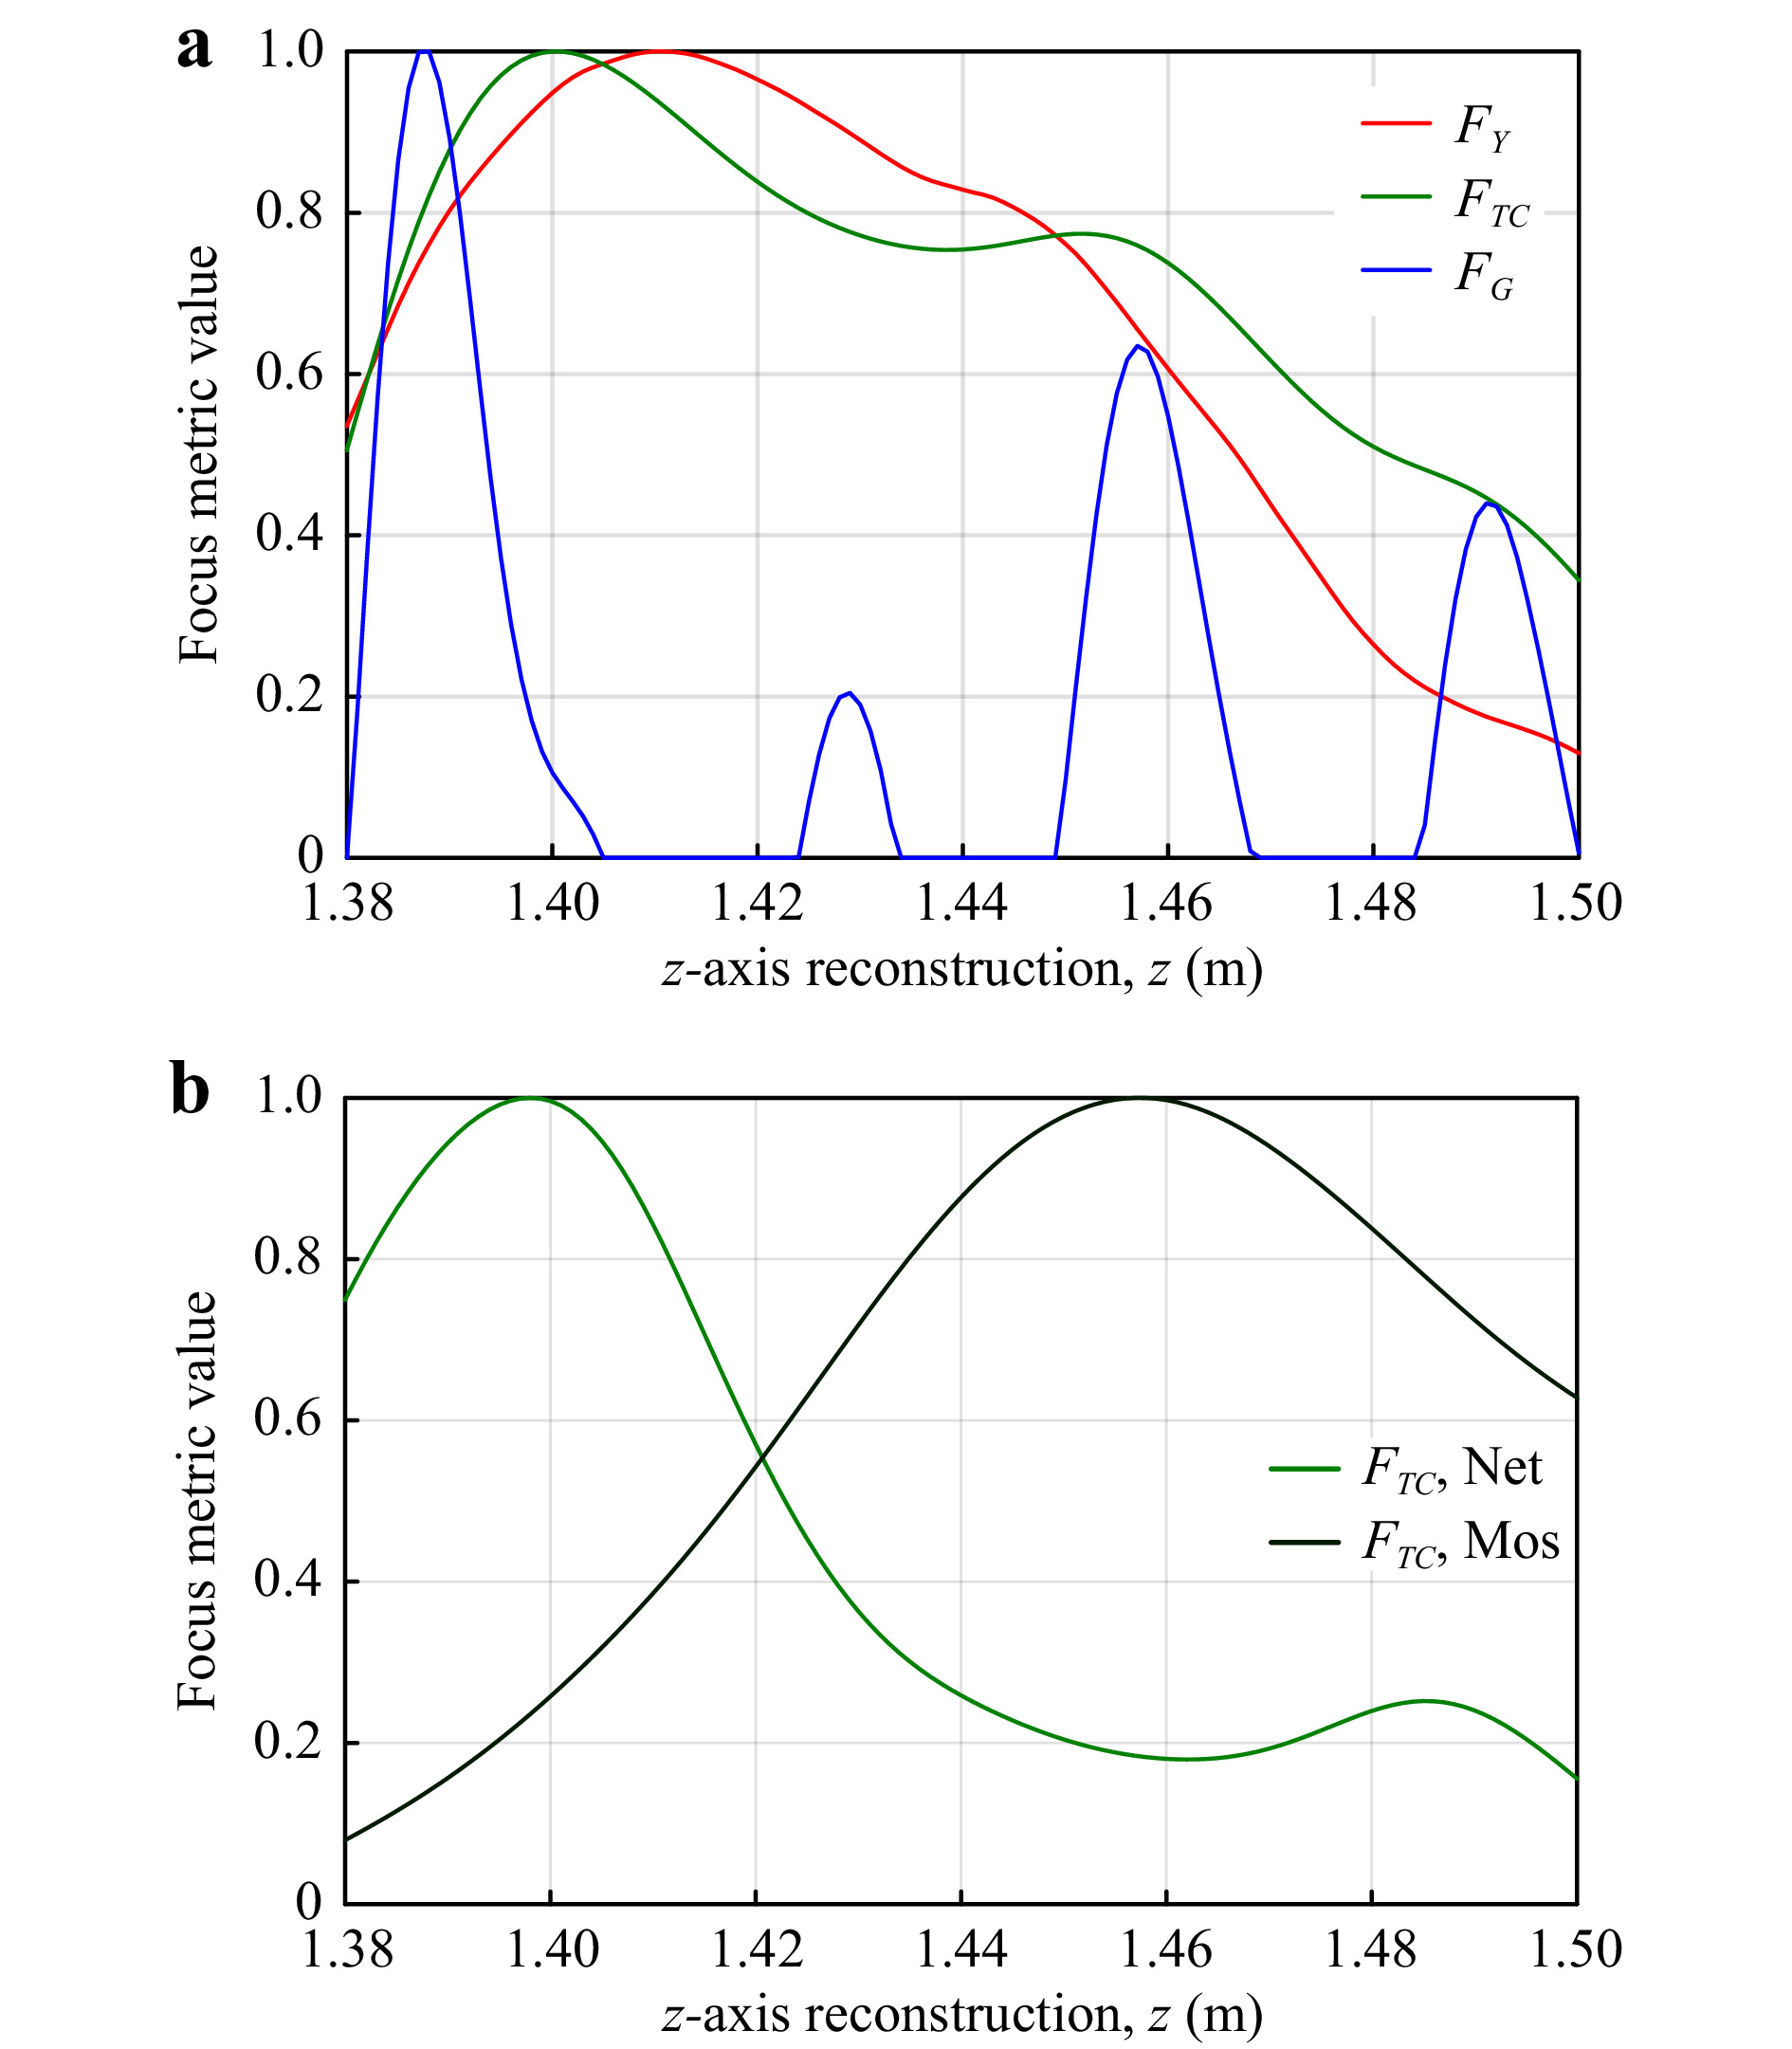
Fig. 15 a Focus metric curves from reconstruction of a mosquito-bednet hologram (net at
$ z=1.40 $ m, mosquito at 1.455 m), and b bednet-only and mosquito-only holograms.Fig. 15b shows the focus metric curves obtained via reconstruction of a bednet-only hologram (Net) and mosquito-only hologram (Mos), where all three focus metrics localise the bednet and mosquito z-axis positions, but only the data for the ToI metric is displayed. Comparing this to Fig. 15a, it is apparent that the mosquito-bednet graph appears to resemble a superposition of the two separate curves in the ToI and edge-gradient based focus metrics. The later method proposed in Alternative Method: Cascade-Correlation ofFocus Metric (CCoFM) aims to resolve these combined curves as they merge into a single elongated peak at lower z-axis separations between the bednet and mosquito.
-
Simulations were used in Mosquitoes Obscured by a Bednet to determine the limits of the proposed methods. Simulated holograms were created by taking in-focus images of a mosquito and bednet separately. The images were both binarised, and the mosquito image was forward propagated using a Fresnel Transfer Function39 up to the position of the bednet (for any desired mosquito-bednet separation). The resultant complex hologram was multiplied by the binarised bednet image to simulate the strands of the bednet (as 0 intensity) blocking some parts of the forward propagating light. This combined image was then propagated the desired distance to the back focal plane of a two-component telecentric system. A pair of fourier transform operations simulated propagation through the system and onto a CCD. The image was then resized onto the correct number of pixels as required by the demagnification factor, and the absolute value of each pixel was determined to simulate intensity data (rather than complex-valued amplitude-phase data). The intensity was remapped in integer values [0 4095] to simulate a 12-bit recording device. For back-propagation and object reconstruction, the same process was used as for the physical data.
-
The CCoFM follows a similar methodology as the XY localisation technique described in XY Localisation. First, a mosquito-only focus metric mask,
$ F_M $ , is defined by cropping a Tamura of Intensity focus curve from the reconstruction of a mosquito-only hologram at the dashed lines shown in Fig. 16a. This mask can also be obtained from simulated data of an object of similar size, or from a mosquito positioned in a different z-axis position. An important point to note on mask selection is that the z-axis reconstruction increment ($ z_{inc} $ ) and effective pixel size ($ \Delta{x}_e $ ) must be the same for both the mask and reconstruction of interest, and the mask should be appropriately symmetrical. A combined mosquito and bednet focus metric,$ F_{M,B} $ , as shown in Fig. 16b, appears to be the superposition of the bednet-only focus metric and mosquito-only focus metric shown in Fig. 16a. Cross correlating$ F_M $ and$ F_{M,B} $ yields the cross correlation map$ F_{C1} $ :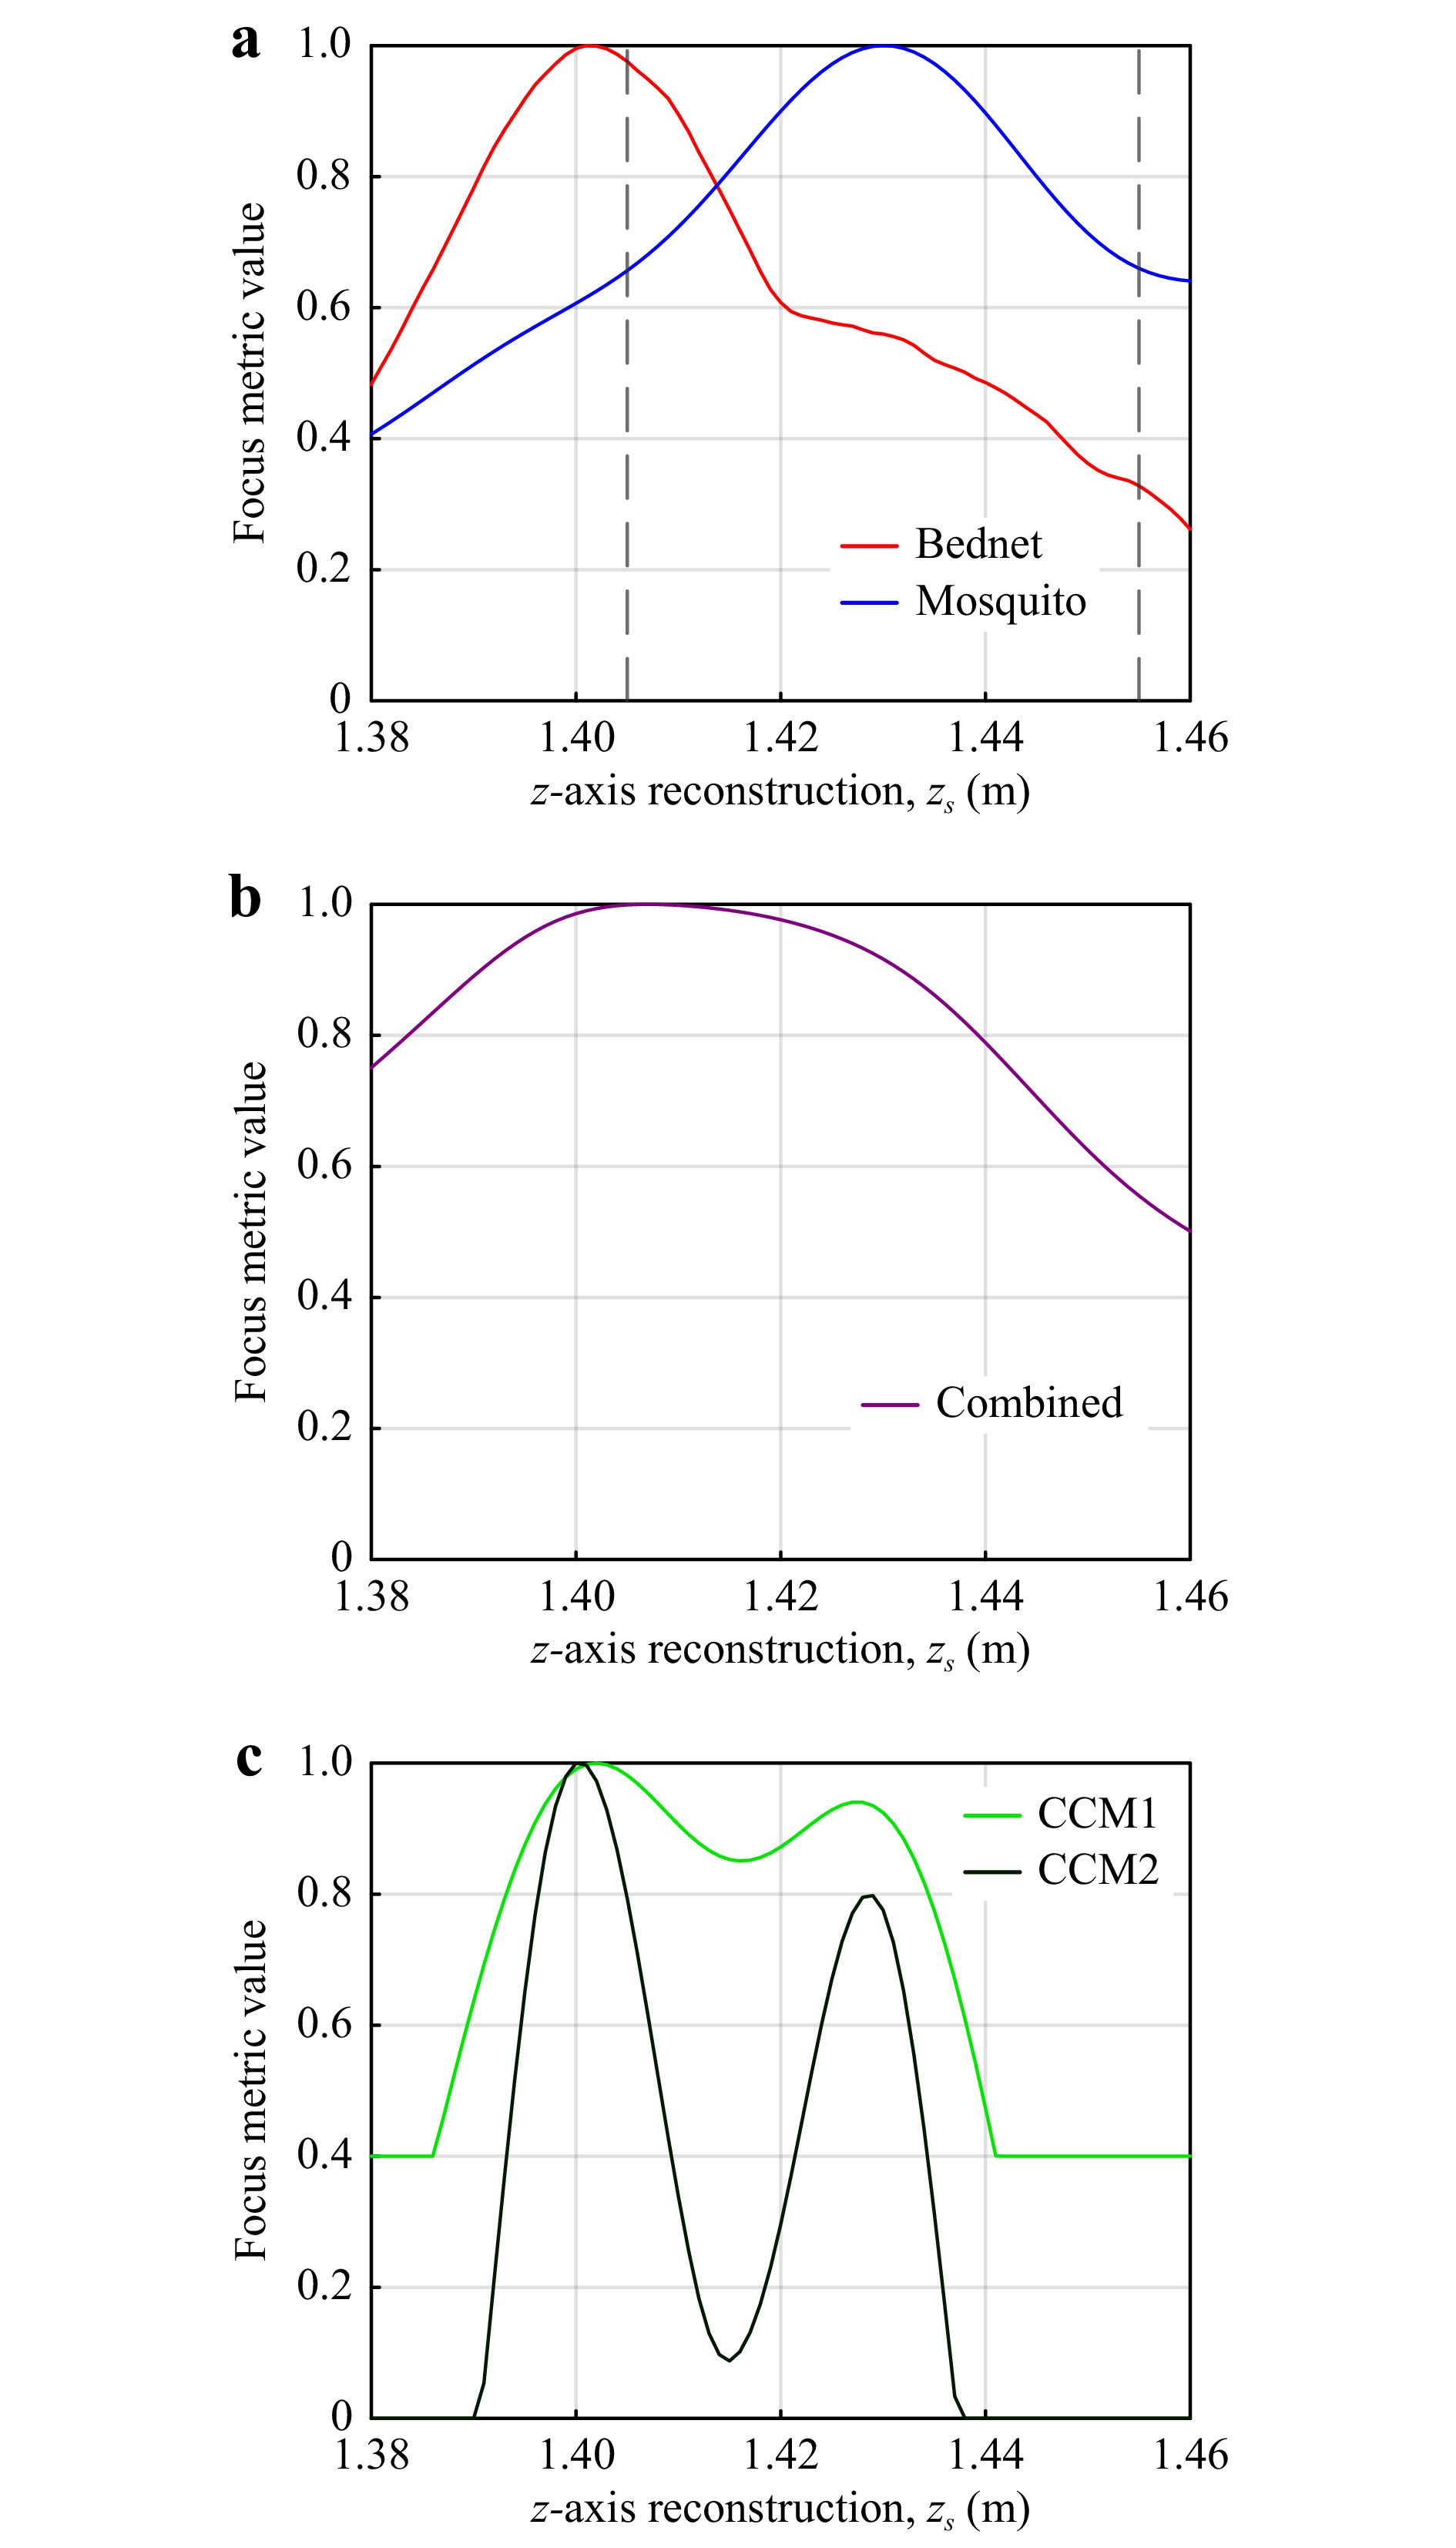
Fig. 16 Tamura-of-Intensity focus metric vs z-axis reconstruction distance: a separate single object curves of mosquito and bednet; b obtained curve of mosquito behind bednet; c cross-correlation curves demonstrating improved z-axis localisation and separation of the two objects.
$$ F_{C1} = F_M*F_{M,B} $$ (4) This cross-correlation map is then thresholded to retain values > 0.4 as shown by CCM1 in Fig. 16c and assigned as
$ F_{C1,t} $ . An autocorrelation of the mask$ F_M $ yields a secondary mask,$ F_{M2} $ :$$ F_{M2} = F_M*F_M $$ (5) The secondary mask,
$ F_{M2} $ , is cross-correlated against the thresholded first-pass cross correlation map$ F_{C1,t} $ to yield a final cross-correlation map,$ F_{C2} $ , with two well-separated maxima indicating the bednet and mosquito z-axis positions as shown by CCM2 in Fig. 16c. -
This work was supported by the Engineering and Physical Sciences Research Council under Grant Number EP/N509796/1. A UK Medical Research Council award (MRC: MR/M011941/1) also contributed to this work.
The application of digital holography for accurate three-dimensional localisation of mosquito-bednet interaction
-
Matthew L Hall1, ,
 ,
, - Katherine Gleave2,
- Angela Hughes2,
- Philip J McCall2,
- Catherine E Towers1,
- David P Towers1
- Light: Advanced Manufacturing 3, Article number: (2022)
- Received: 28 October 2021
- Revised: 23 February 2022
- Accepted: 24 February 2022 Published online: 09 June 2022
doi: https://doi.org/10.37188/lam.2022.020
Abstract: Understanding mosquito interaction with long-lasting insecticidal bednets is crucial in the development of more effective intervention methods to protect humans from malaria transmission. As such, a 240 × 240 × 1000 mm laboratory setup for the in-line recording of digital holograms and subsequent in-focus reconstruction and 3D localisation of mosquitoes is presented. Simple bednet background removal methods are used to accurately localise a mosquito obscured by a bednet in 3D coordinates. Simulations and physical data demonstrate that this method is suitable for mosquitoes positioned 3−1000 mm behind a bednet. A novel post-processing technique, involving a cascade-correlation of a Tamura of Intensity focus metric extracted from digitally reconstructed scenes, accurately localises mosquitoes positioned 35−100 mm behind a bednet from a single digital hologram. The result of this study is a scalable digital holographic methodology to examine mosquito-bednet interaction in 3D at a level of accuracy previously only seen in 2D imaging of mosquitoes in a much smaller volume.


Rights and permissions
Open Access This article is licensed under a Creative Commons Attribution 4.0 International License, which permits use, sharing, adaptation, distribution and reproduction in any medium or format, as long as you give appropriate credit to the original author(s) and the source, provide a link to the Creative Commons license, and indicate if changes were made. The images or other third party material in this article are included in the article′s Creative Commons license, unless indicated otherwise in a credit line to the material. If material is not included in the article′s Creative Commons license and your intended use is not permitted by statutory regulation or exceeds the permitted use, you will need to obtain permission directly from the copyright holder. To view a copy of this license, visit http://creativecommons.org/licenses/by/4.0/.

 DownLoad: