


-
Transparent substances are widely encountered in various aspects of life and include water1,2, cell cytoplasm3, and the atmosphere4. Furthermore, transparent materials such as glass5 and plastics6,7 are commonly utilised in industry. For example, the production of thin films8 and displays9 relies heavily on transparent materials. In addition, transparent materials play crucial roles in optics, where they are applied as lenses, prisms, and other instrument components10.
The quality of a transparent object significantly affects its performance in application. Indeed, optical defects and faulty elements can negatively affect the required optical path or image quality and even damage other components11–13. Thus, the effective measurement of transparent objects is crucial for ensuring the desired quality and functionality. Contact measurement methods14,15 commonly employ a profiler, but may have limited accuracy owing to the required probe size. Though atomic force microscopy can be employed to obtain more detailed measurements, this method can scratch the object surface, introducing secondary errors and damage. As a result, the use of non-destructive measurement methods that do not damage the measured object is preferred. Optical measurement is considered an ideal non-destructive approach, although the complex optical properties of transparent objects make such measurements challenging. As defining the measurement target is the first step in determining the appropriate measurement method, the meaning of “transparent” must be defined.
-
Transparency is typically determined by the balance between the directly transmitted and scattered light passing through a medium, which are respectively measured in terms of transmittance and haze16–18. Transmitted light conveys information indicative of clarity and transparency, whereas scattered light degrades quality, resulting in haze. Consequently, defining transparency using a single numerical standard is challenging, as each application scenario has its own criteria for “transparency”. For example, the transmittance rate that defines “transparency” for transparent heaters is greater than 90%19, whereas that for transparent solar cells and organic photovoltaics20,21 is typically approximately 20% and that for transparent paper22 is approximately 60%. Typically, an object is considered transparent if the transmitted light accounts for more than 50% of the incident light in most application scenarios23,24. The concept of transparency typically discussed in relation to measurement applications refers to situations in which the signal-to-noise ratio of the reflected or scattered light passing through the object is relatively low, rendering conventional measurement methods ineffective and necessitating the development of new techniques for measuring transparent objects.
Transparency is also relative to the specific wavelength range considered. Indeed, the Fresnel equations indicate that transmittance and reflectance are related not only to the incidence angle but also to the refractive index (RI) of the medium, and the RI is wavelength dependent, as described by the Lorentz dispersion model and defined by the Helmholtz equation:
$$ {n}^{2}=1+{\sum _{j}}\frac{{b}_{j}{\mathrm{\lambda }}^{2}}{\left({\mathrm{\lambda }}^{2}-{\mathrm{\lambda }}_{j}^{2}\right)+{g}_{j}{\mathrm{\lambda }}^{2}/\left({\mathrm{\lambda }}^{2}-{\mathrm{\lambda }}_{j}^{2}\right)} $$ (1) where $ {b}_{j} $, $ {g}_{j} $, $ {\mathrm{\lambda }}_{j} $, and $ j $ are constants determined by the medium itself. As a result, the transmittance of a medium does not only depend on its own properties but also the wavelength of the incident light.
In summary, transparency is difficult to quantify using a single numerical value such as transmittance and must be interpreted within the context of each specific application. This review considers transparent objects to be those in which the transmitted light exceeds the absorbed or scattered light, rendering conventional measurement methods ineffective, and is focused on methods for measuring such objects accordingly. Moreover, as transparency is a wavelength-dependent concept, this review focuses on methods for measuring objects that are transparent within the visible-light range (400-700 nm), which are more common and have greater research significance. However, techniques that are suitable for measuring objects transparent to visible light can often be adapted to inspect objects transparent to other wavelengths.
-
Transparent objects pose a significant challenge for optical detection because of their associated complex refraction and reflection phenomena. Typically, transparent objects are observed in air, where the incident light encounters several situations simultaneously, as illustrated in Fig. 1:
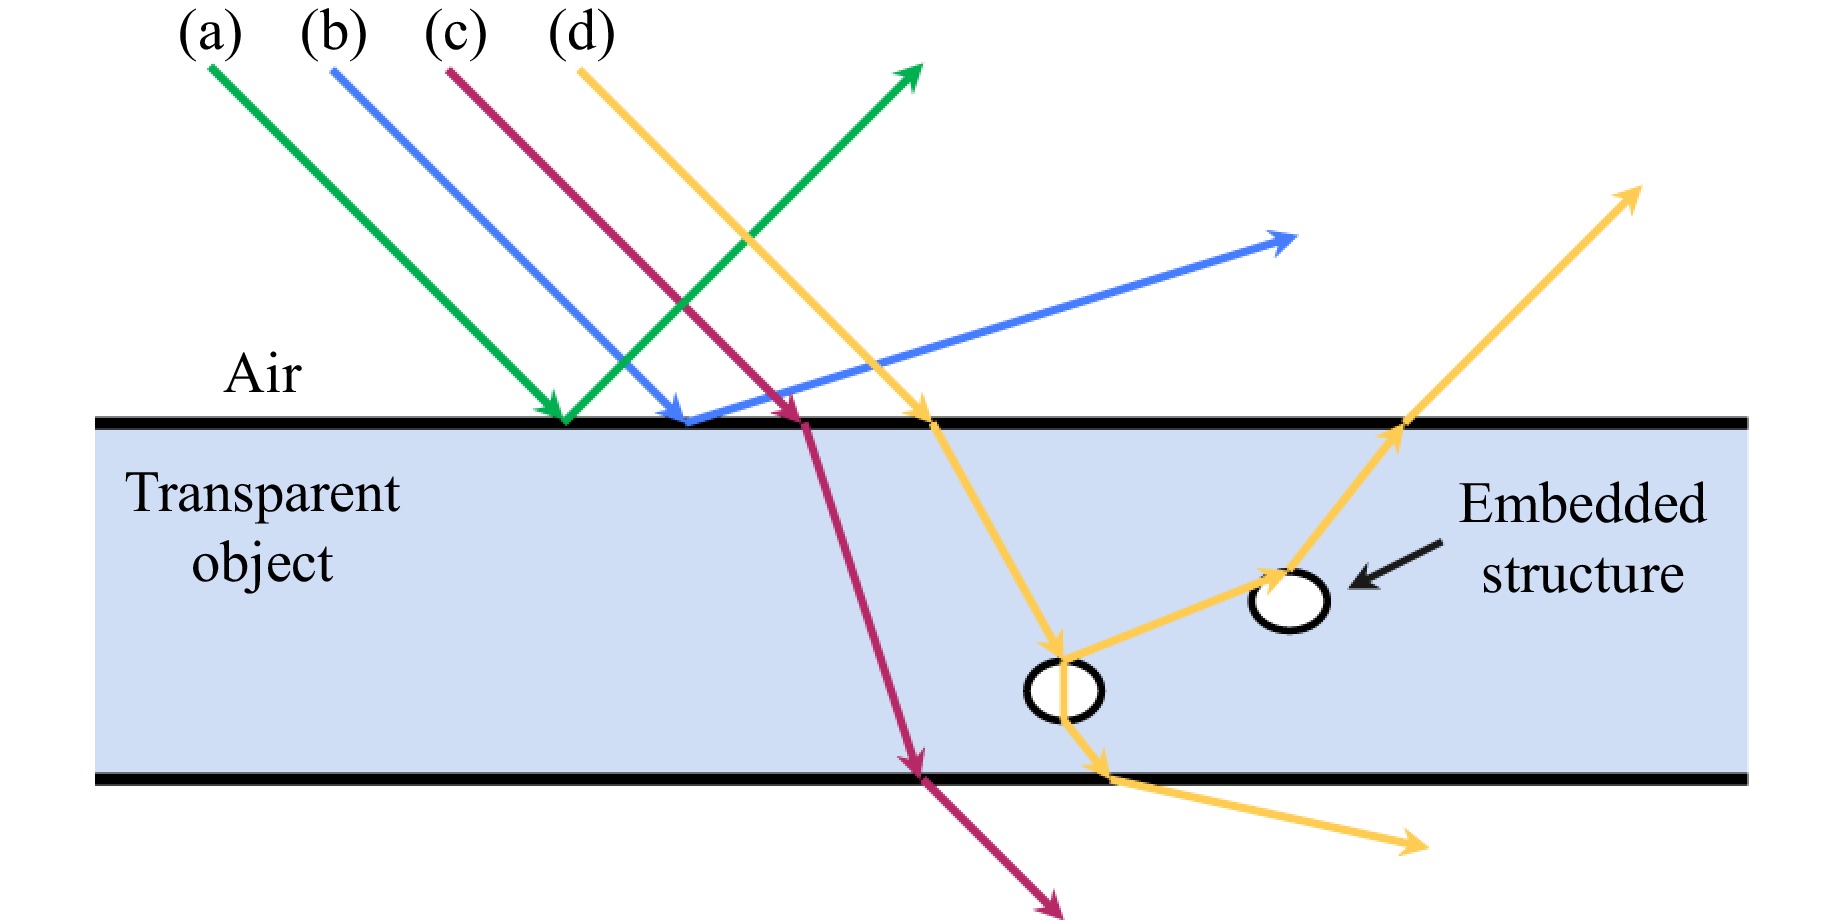
Fig. 1 Complex refraction and reflection phenomenon in transparent objects. Lines (a)–(d) denote specular reflected light, scattered light, transmitted light, and complex refracted and reflected light interacting with embedded structures, respectively.
(a) specular reflection, which occurs when the incident light is directly reflected
(b) direct scattering
(c) refraction inside the object as the light passes through
(d) refraction and interaction with structures embedded within the object, which result in complex reflected and refracted light that is often of low intensity.
Thus, the effective measurement of transparent objects necessitates capturing refracted or reflected light. The modulation and influence of a transparent object on incident light can be understood by analysing the changes in light intensity, phase, polarisation, and spatial angle. Such analyses provide detailed information describing the surface morphology, internal structure, and RI distribution of the observed transparent object, enabling quantitative measurements.
Because measurement techniques and methods are often closely related to the scale of measurement, this review categorises measurement methods based on their deployment on macro-, micro-, and general scales, as shown in Fig. 2. The specific requirements for different measurement targets are also discussed to address the relationship between the scale and measurement method and compare the advantages and limitations of each method. Finally, the review concludes with a summary of potential improvements to these methods.
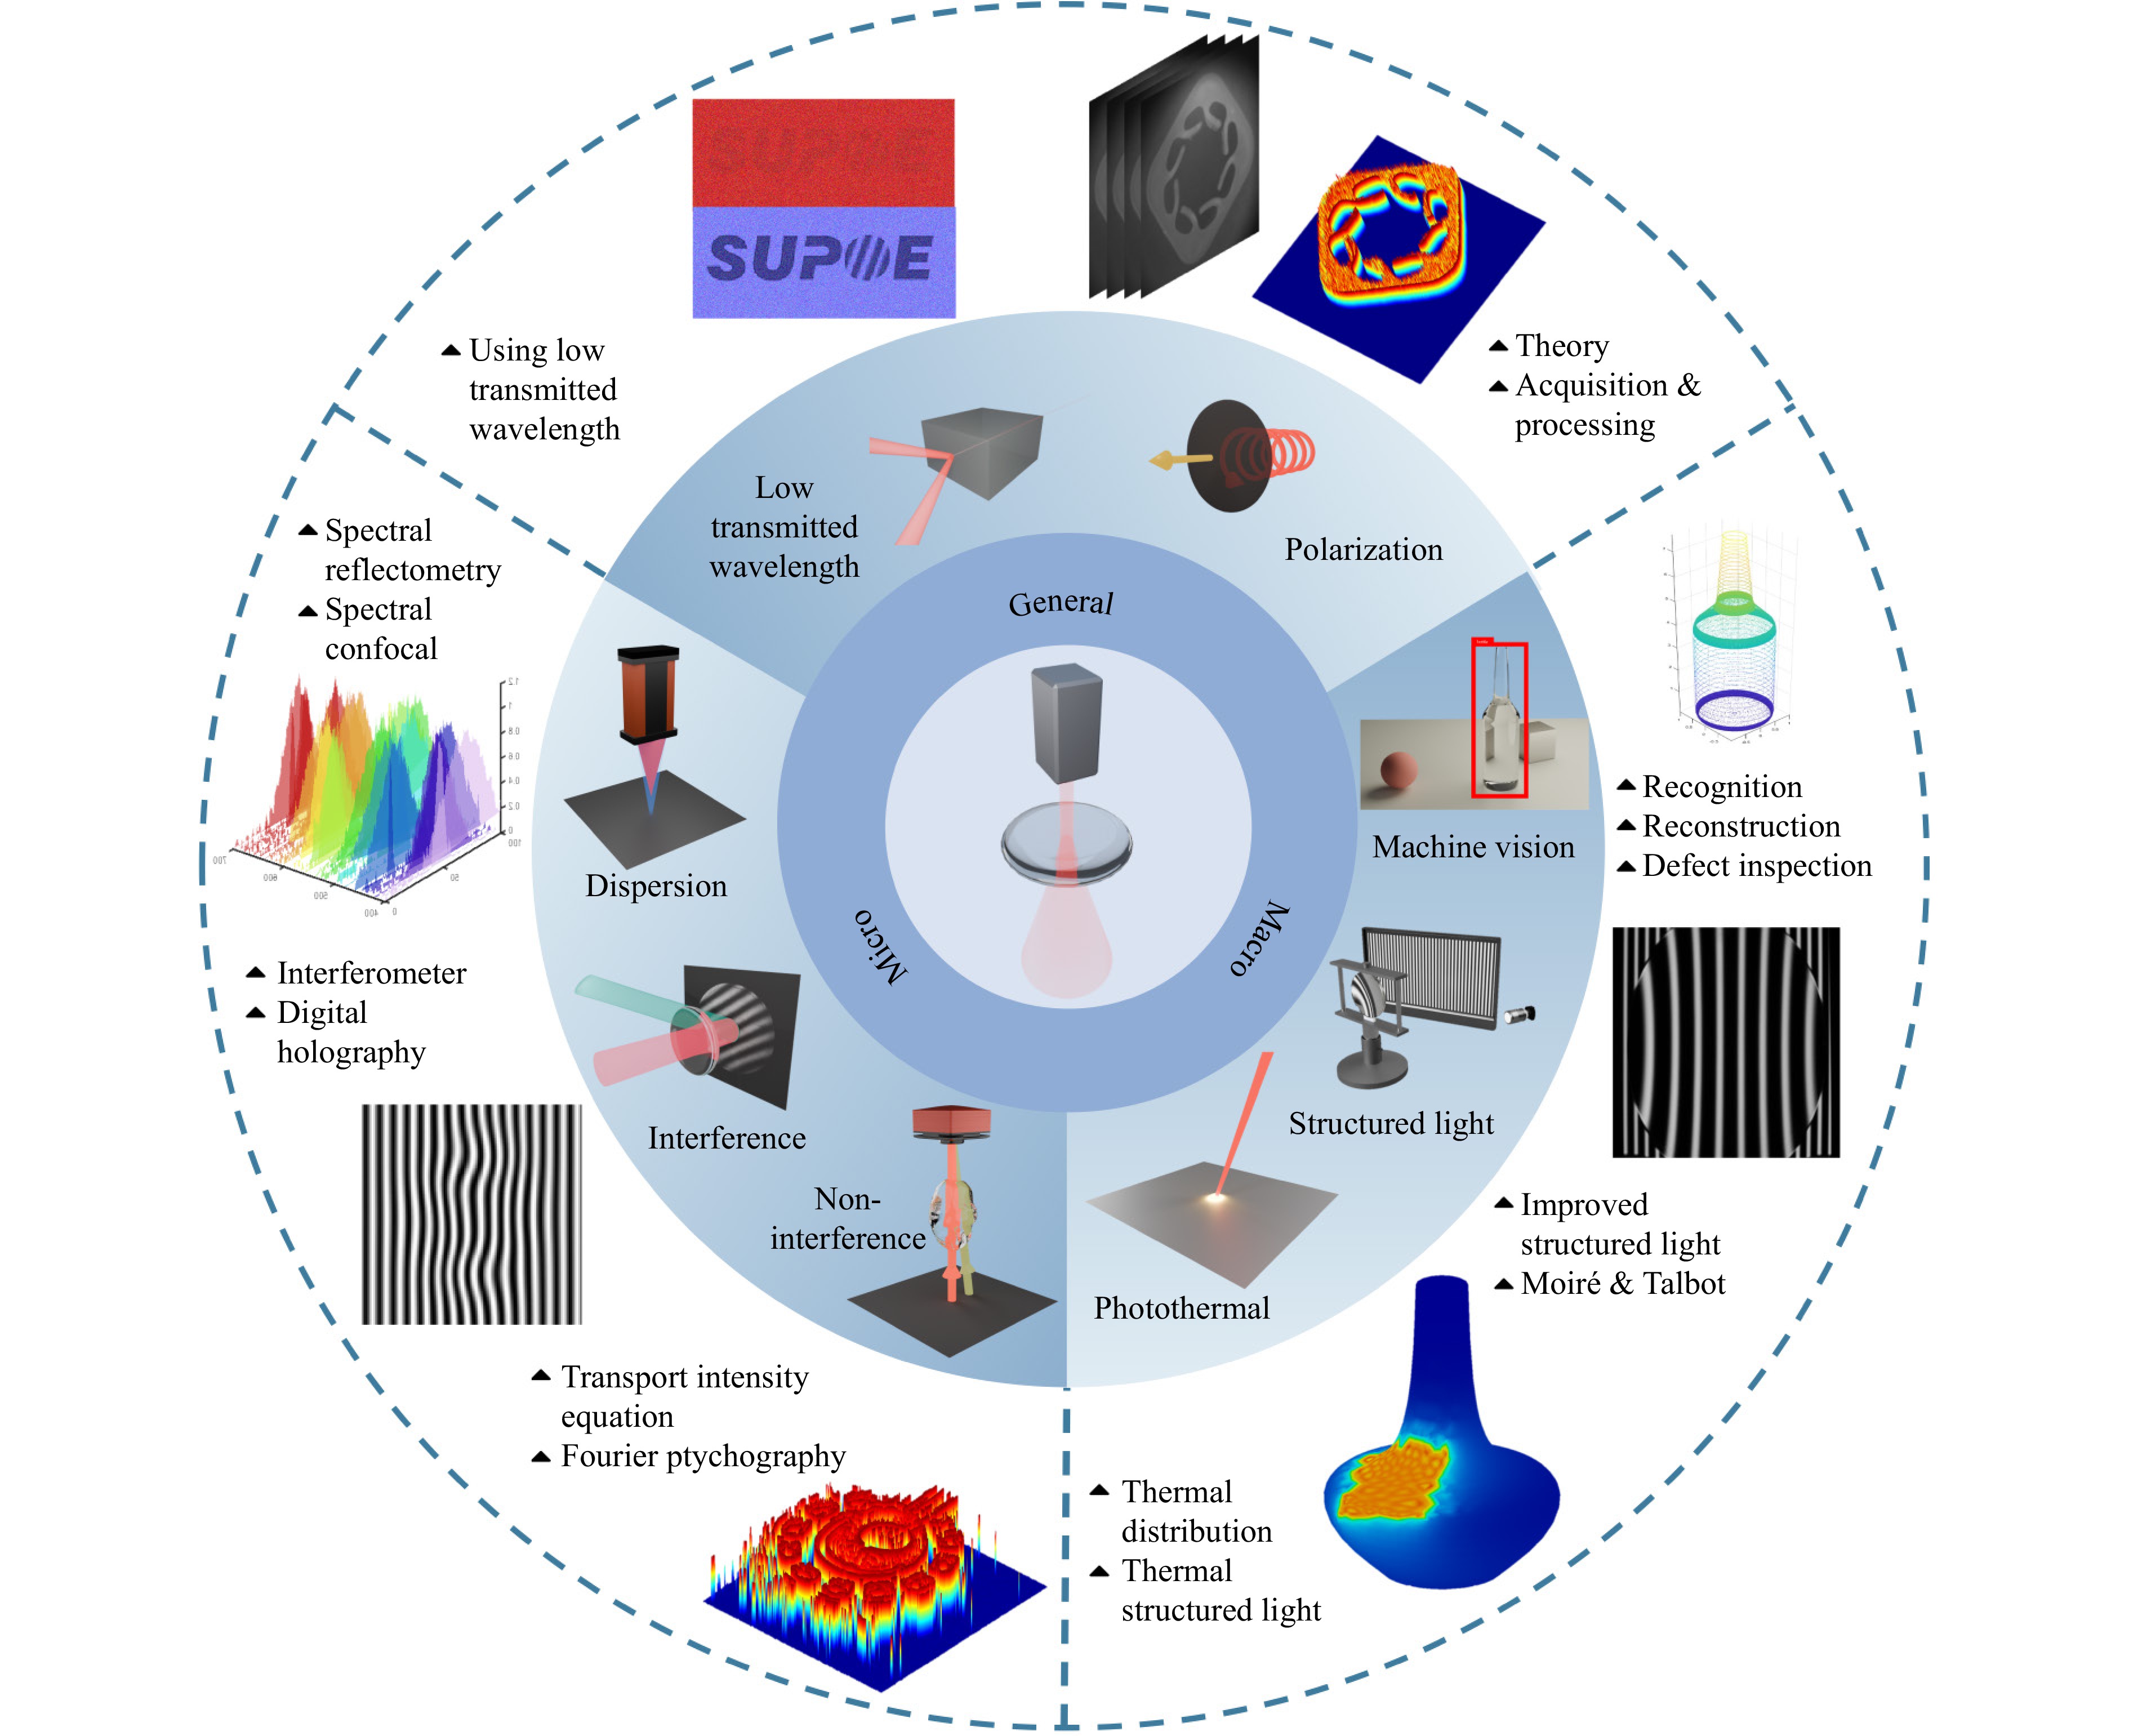
Fig. 2 Overview of non-destructive optical measurement methods for transparent objects.
-
This section discusses optical measurement methods for macro-scale objects, which typically range in size from centimetres to millimetres and even microns. Macro-scale transparent object measurement plays a significant role in various applications, including autonomous driving and industrial robotics. For example, the accurate identification of transparent objects such as glass walls is essential for the safe operation of autonomous vehicle, assisted vision, and automatic navigation systems; distinguishing between glass and plastic containers is a vital task for laboratory automation; transparent object recognition is crucial for waste sorting and item classification; and precise reconstruction and defect detection are critical in industrial contexts such as the manufacture of glass display substrates.
The key challenge associated with obtaining macro-scale measurements is to achieve both speed and accuracy. The following sections accordingly discuss machine vision methods according to application, then conventional and improved structured light techniques before exploring innovative approaches that utilise photothermal principles.
-
The increasing demand for higher accuracy and efficiency in workpiece inspection has led to the widespread use of machine vision methods. These methods typically capture images using charge-coupled devices or complementary metal oxide semiconductor sensors, then conduct image analyses to extract the geometric dimensions, defects, and other relevant information describing the object being measured. Different system architectures have been employed according to the specific measurement target. This section focuses on transparent object recognition and segmentation as well as reconstruction. Defect detection, which is critical in industrial manufacturing, is discussed separately because of its special identification requirements.
-
There is a considerable demand for transparent object recognition and segmentation in the robotics and autonomous vehicle fields. Segmentation and recognition problems typically require the identification of object features. In 2005, McHenry et al. proposed a transparent object feature recognition method that utilises the distortion along the edges of the transparent object and the inherent highlighting phenomenon on its surface to realise segmentation25; however, this approach is limited by the environmental conditions in which it is employed. Researchers have proposed recognition and segmentation methods that capture additional types of information to address this limitation. In 2015, Xu et al. proposed a light-field distortion feature26 that provides a new model for the visual recognition of transparent objects, as shown in Fig. 3. This method was subsequently applied to realise the segmentation of transparent objects27. In addition to using light-field information to improve segmentation results28–30, depth information has also been applied. Missing depth information has been integrated into a Markov random field to segment transparent objects31 with improved results. Indeed, various methods for describing the transparent object features extracted from the light field and depth information have been proposed to enable effective recognition and segmentation.
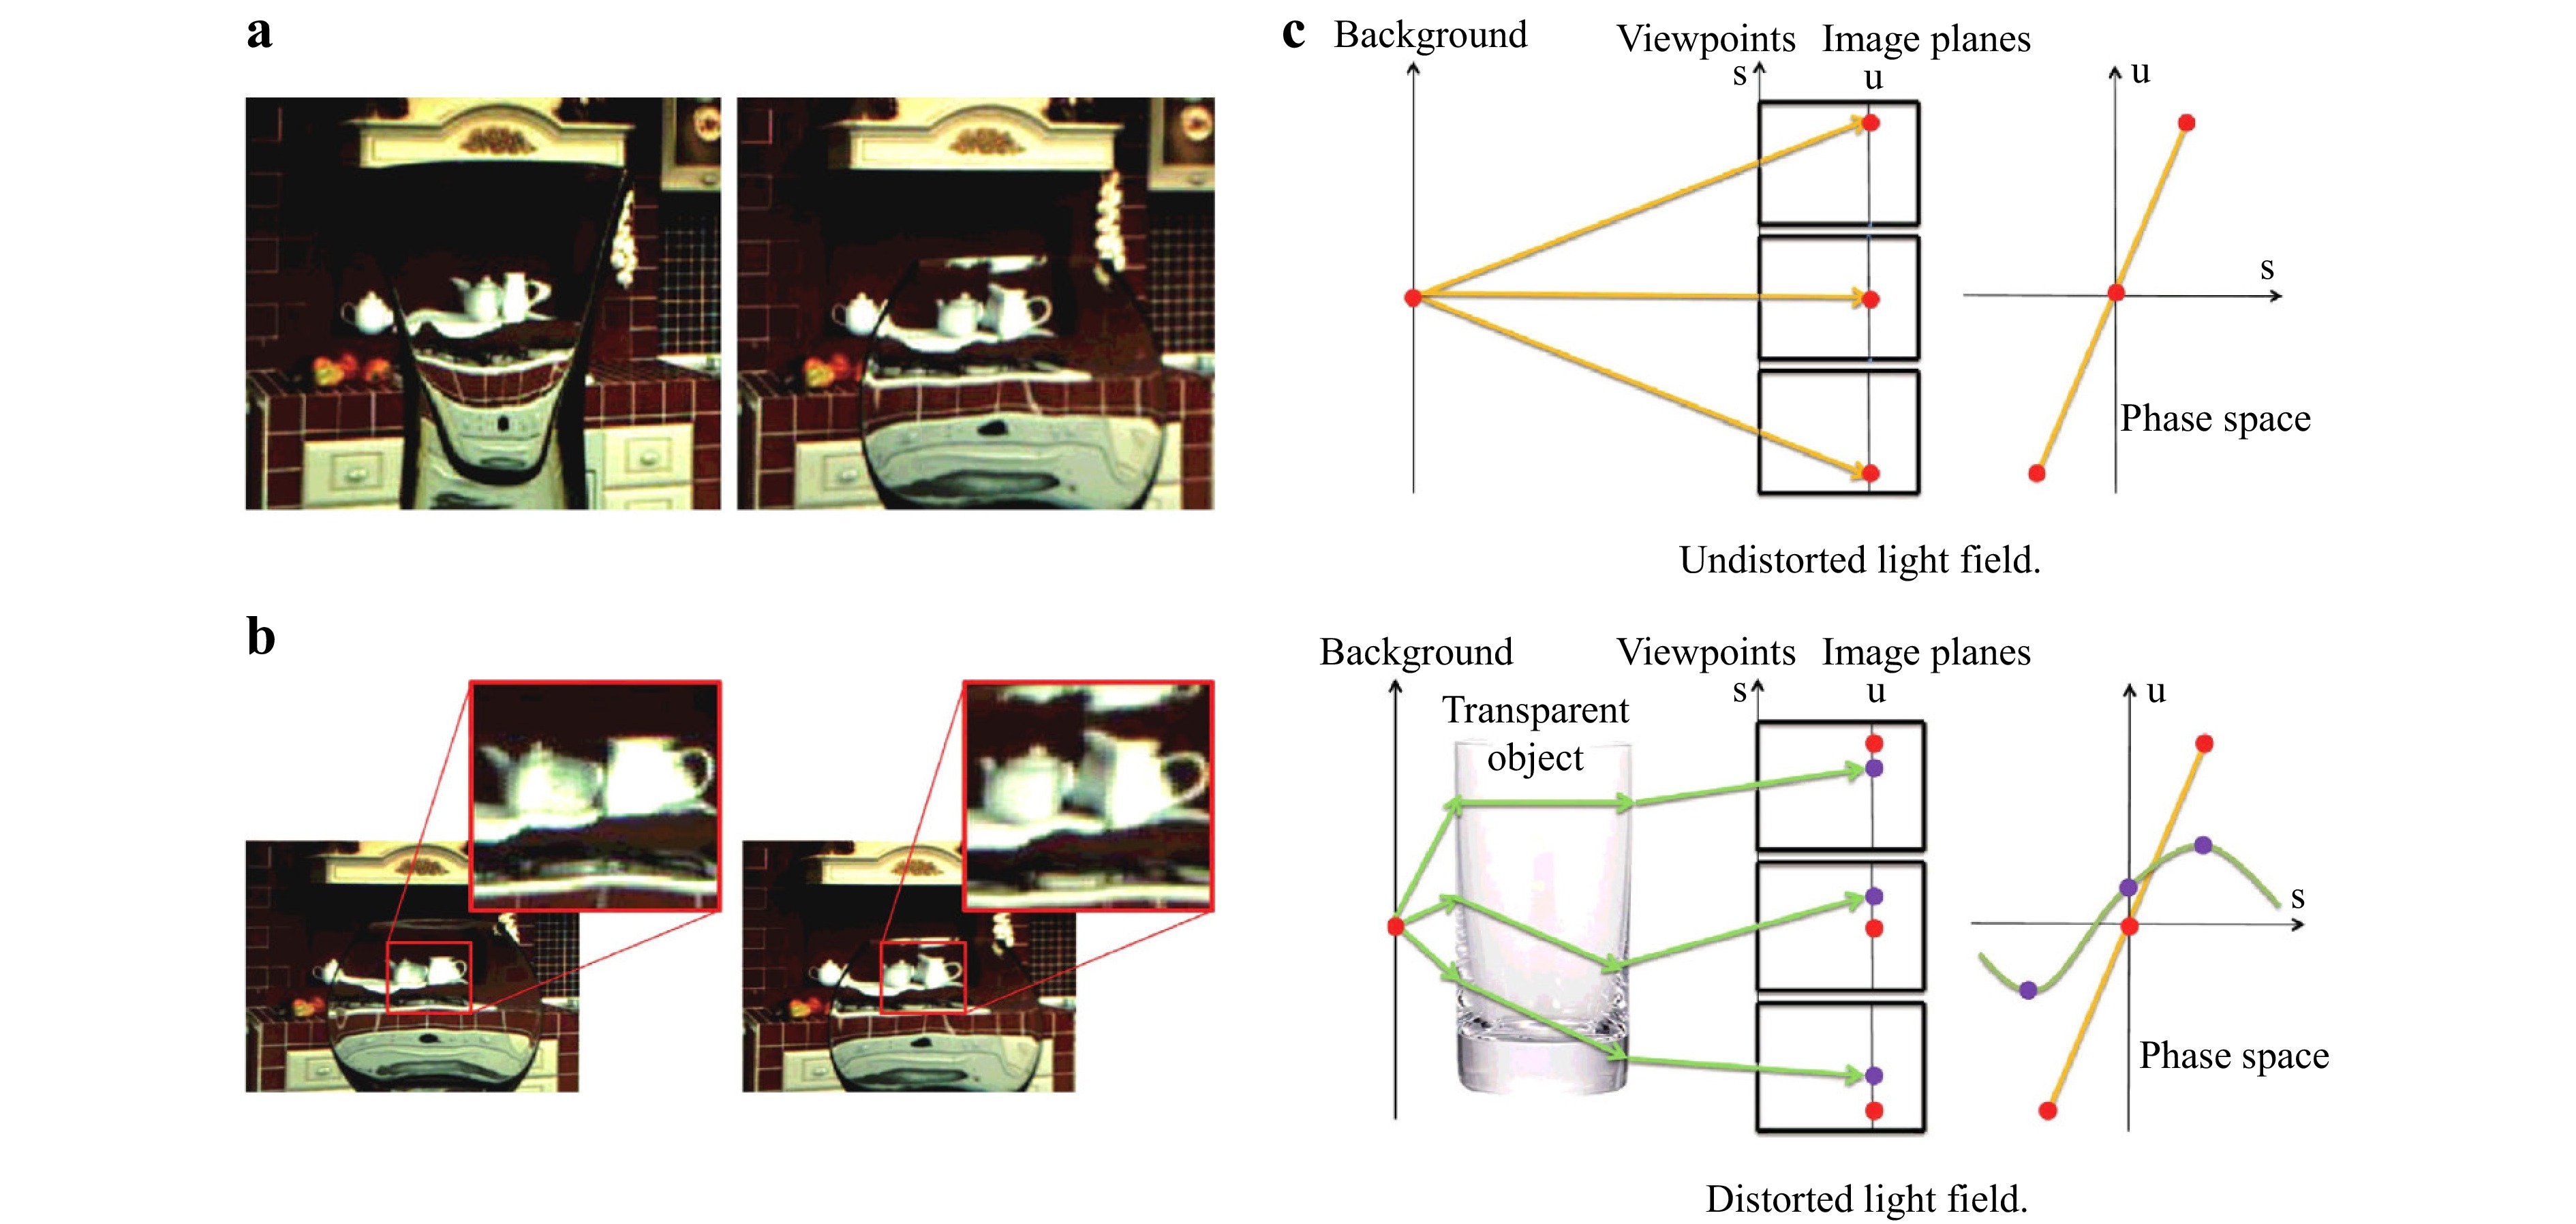
Fig. 3 Light field distortion feature for transparent object recognition and segmentation Reproduced with permission26. Copyright 2015, Elsevier Inc. a Background distortion from different objects and b background distortion from changing viewpoints, showing that the distortion of the light field is closely related to the object itself. c Light field propagation, showing that the involvement of the transparent object changes the distribution and phase of the light field.
Rapid advances in computer science have contributed to the development of valuable technologies such as deep learning and their application to transparent object measurement. Indeed, remarkable progress has been made recently in image-segmentation techniques using deep learning with widespread applications across various fields. Madessa et al. proposed the mask region convolutional neural network to detect a single transparent object32; Xu et al. used the dense connections between different atrous convolution blocks to restore more detailed information33; and Yu et al. designed the discriminability enhancement and focus-and-exploration-based fusion modules to implement coarse-to-fine glass segmentation34. Various neural networks have also been proposed to perform transparent object segmentation tasks35–37.
However, these approaches generally exhibit poor accuracy, making them suitable for approximate estimation only. Thus, the combination of machine vision-related algorithms with high-precision measurement approaches represents a promising direction for future research.
-
Reconstruction is a crucial task in measurement, and is typically based on triangulation principles. Kutulakos and Steger elaborated on light triangulation measurement theory to discuss single-view specular depth estimation and three-view double refractive–reflective reconstruction38. They noted that reconstructing objects more than three times by increasing the view-angle refraction was impossible.
Other methods approach transparent object measurements from alternative perspectives. Kim used an algorithm based on highly asymmetrical prior conditions to reconstruct the inner and outer surfaces of transparent objects39, and Koyama et al. employed ultraviolet (UV) light using a structure-from-shading (SfS) method to reconstruct transparent objects40, as shown in Fig. 4a, b. In addition, backpropagation has been applied to infer the scattering parameters of transparent objects: Gkioulekas et al. proposed using backpropagation to infer the distribution of the internal scattering parameters of a semi-transparent object41, as shown in Fig. 4c, and Che et al. suggested using backpropagation to measure the distribution of internal secondary scattering by combining the stochastic gradient descent and Monte Carlo simulation, offering a new approach for measuring transparent material parameters42.
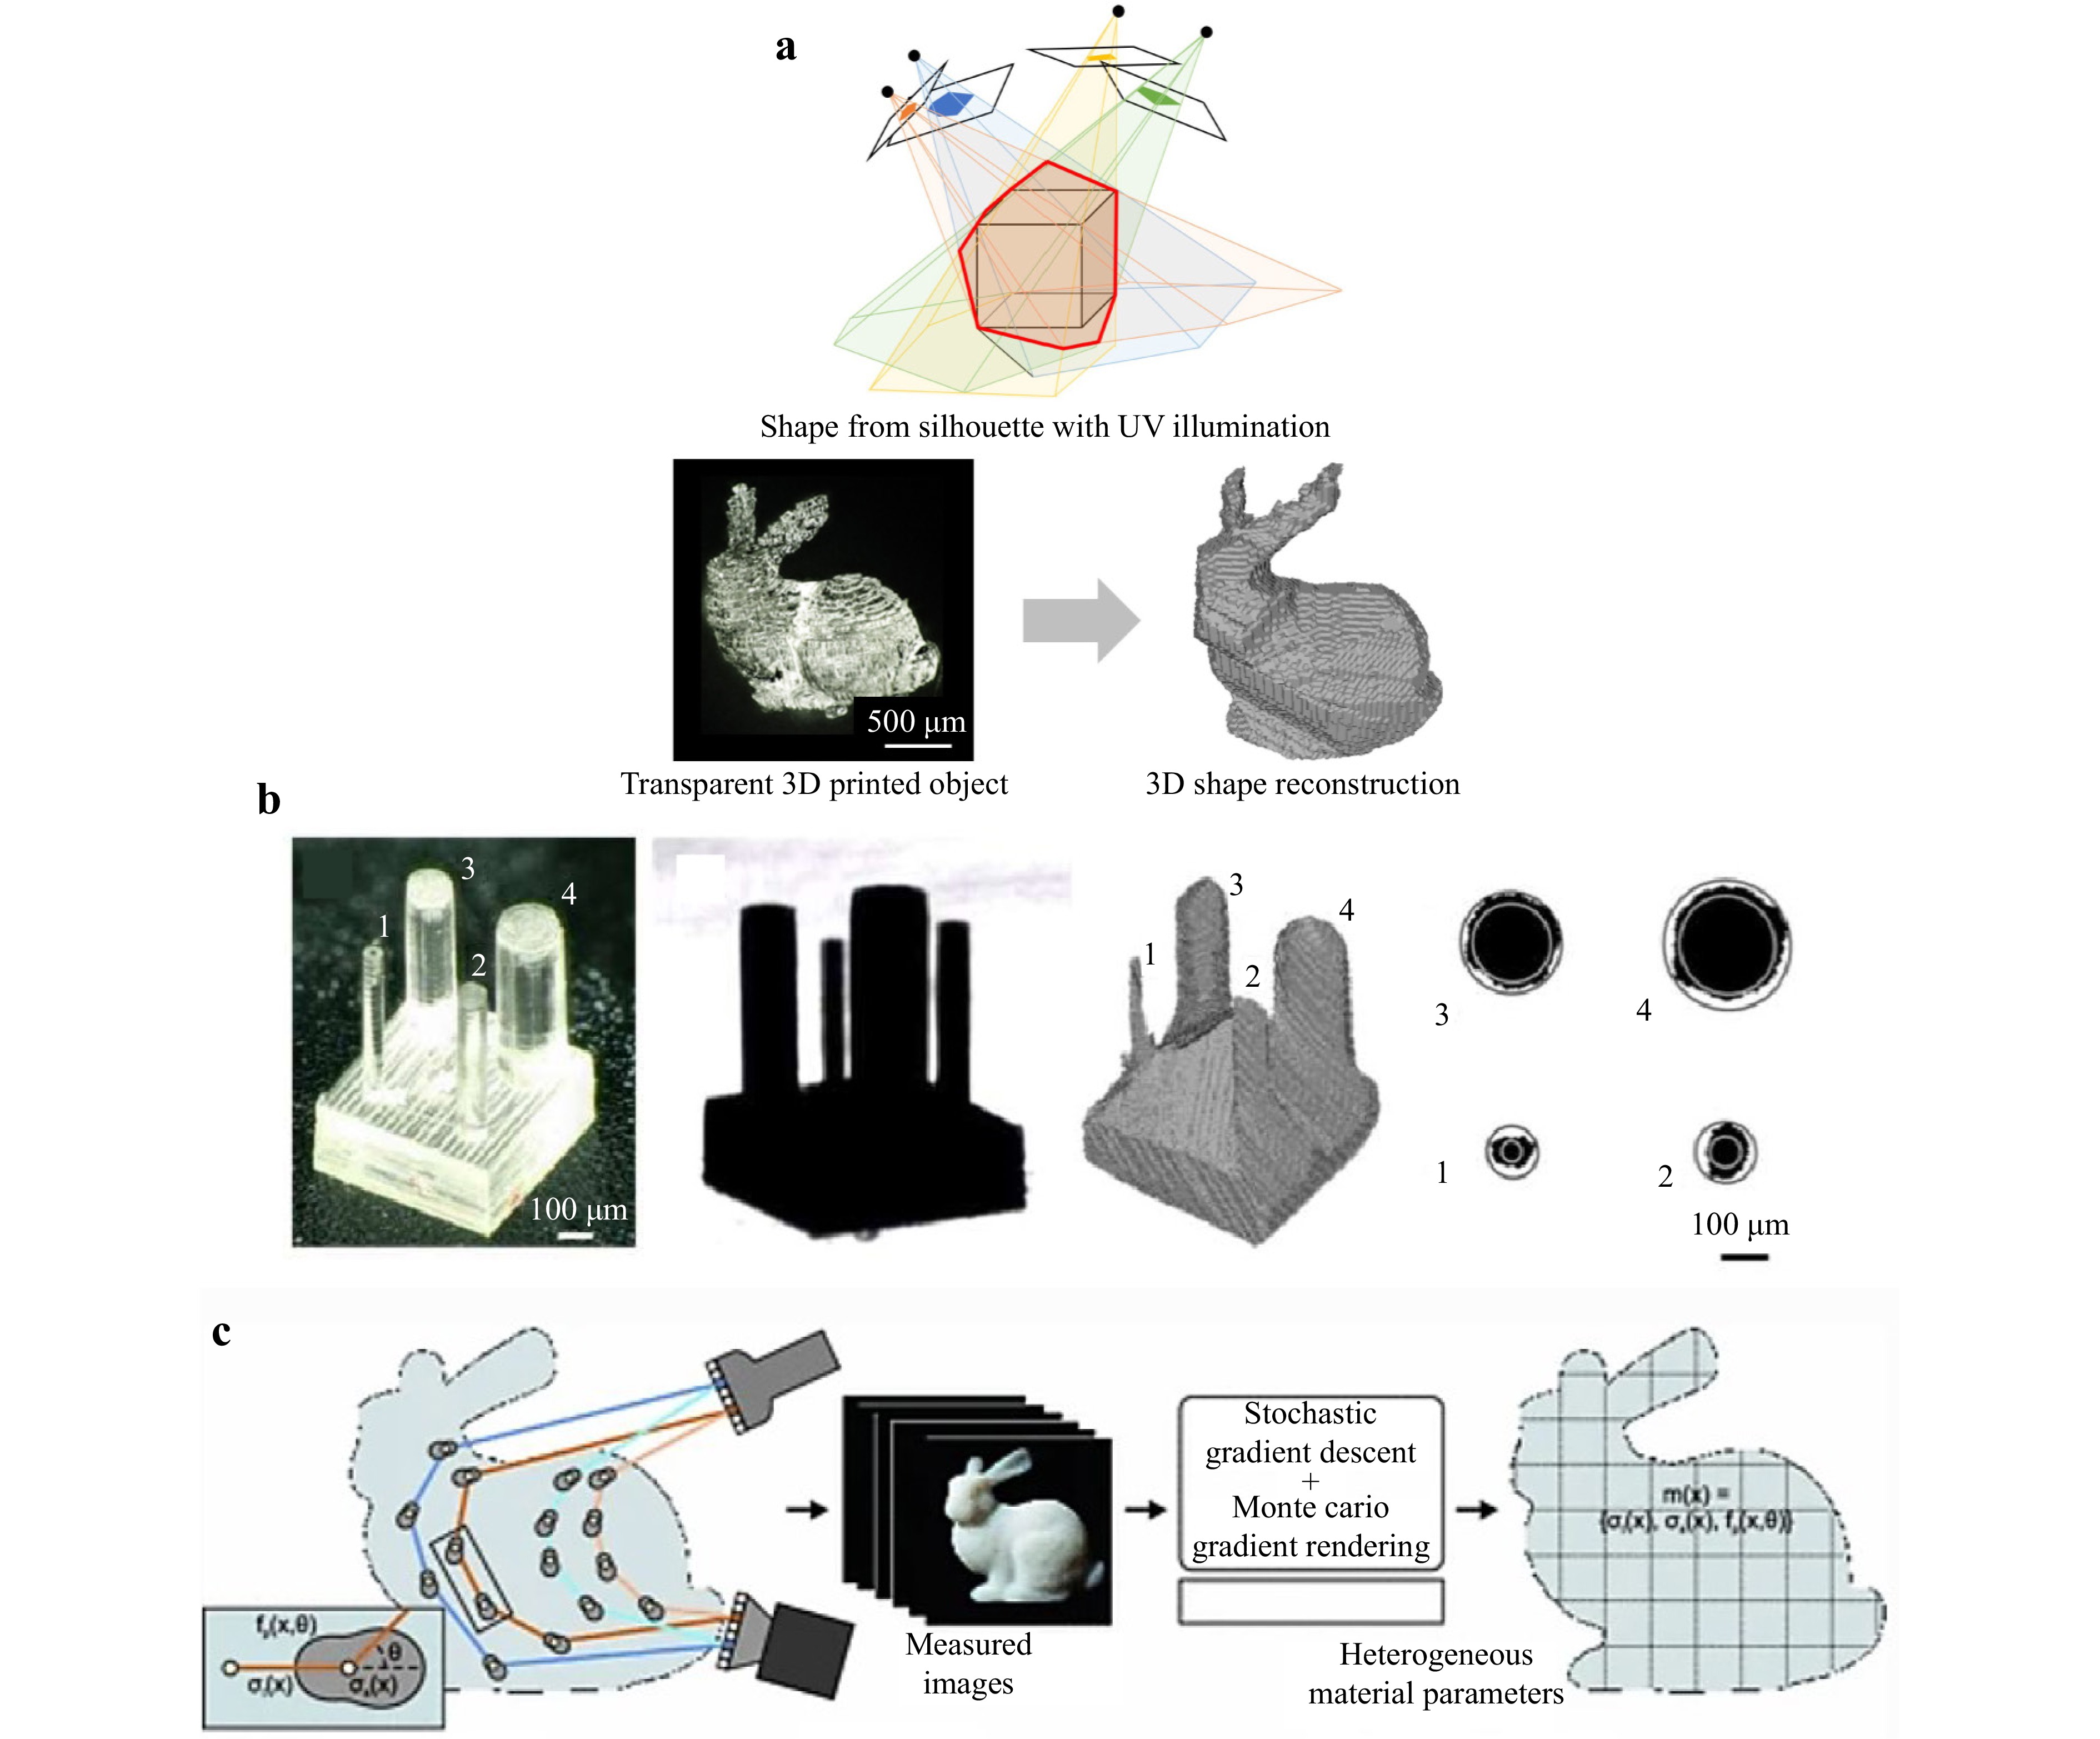
Fig. 4 a Overview and b results of the SfS method using UV, showing, from left to right, the optical microscope image, silhouette obtained using UV illumination, reconstruction of the pillar array model using the SfS method, and a cross section at half height of each reconstructed pillar. Reproduced with permission40. Copyright 2018, CC BY 4.0. c Inverse scattering model used to measure the scattering parameters inside a semi-transparent object by combining the stochastic gradient descent and Monte Carlo simulation methods. Reproduced with permission41. Copyright 2016, Springer International Publishing AG.
-
The defect inspection of transparent objects requires specialised forms of recognition that can significantly enhance efficiency. Various defect detection methods have been combined with different image processing algorithms to considerably improve inspection efficiency and reduce inspection costs in manufacturing applications43–45. For example, Gong et al. achieved a defect detection accuracy of 99.5% at an inspection speed of 60 bottles/min for over 60,000 bottles using custom-made blue dome illumination with deformable template matching and an adaptive threshold selection strategy46. Deng et al. demonstrated a method for measuring embedded microstructures in transparent objects that treats defects as microlenses to determine their depths by analysing the differences in the grayscale values of their transmitted light47,48.
The integration of machine learning has introduced new solutions for the defect inspection of transparent objects. Erozan et al. introduced a learning-based optical inspection method for transparent printed electronics that achieved a 95% defective transistor detection rate49. Yin et al. combined the machine vision and machine learning methods illustrated in Fig. 5 to inspect large-aperture optics with a minimum detectable flaw size of 20 microns and a flaw position accuracy of better than 50 microns50, demonstrating the potential of applying machine learning in the defect inspection of transparent objects. Furthermore, the efficiency and accuracy of film inspection have also been improved using machine learning51. Indeed, the active application of machine learning in defect detection methods represents a promising research direction.
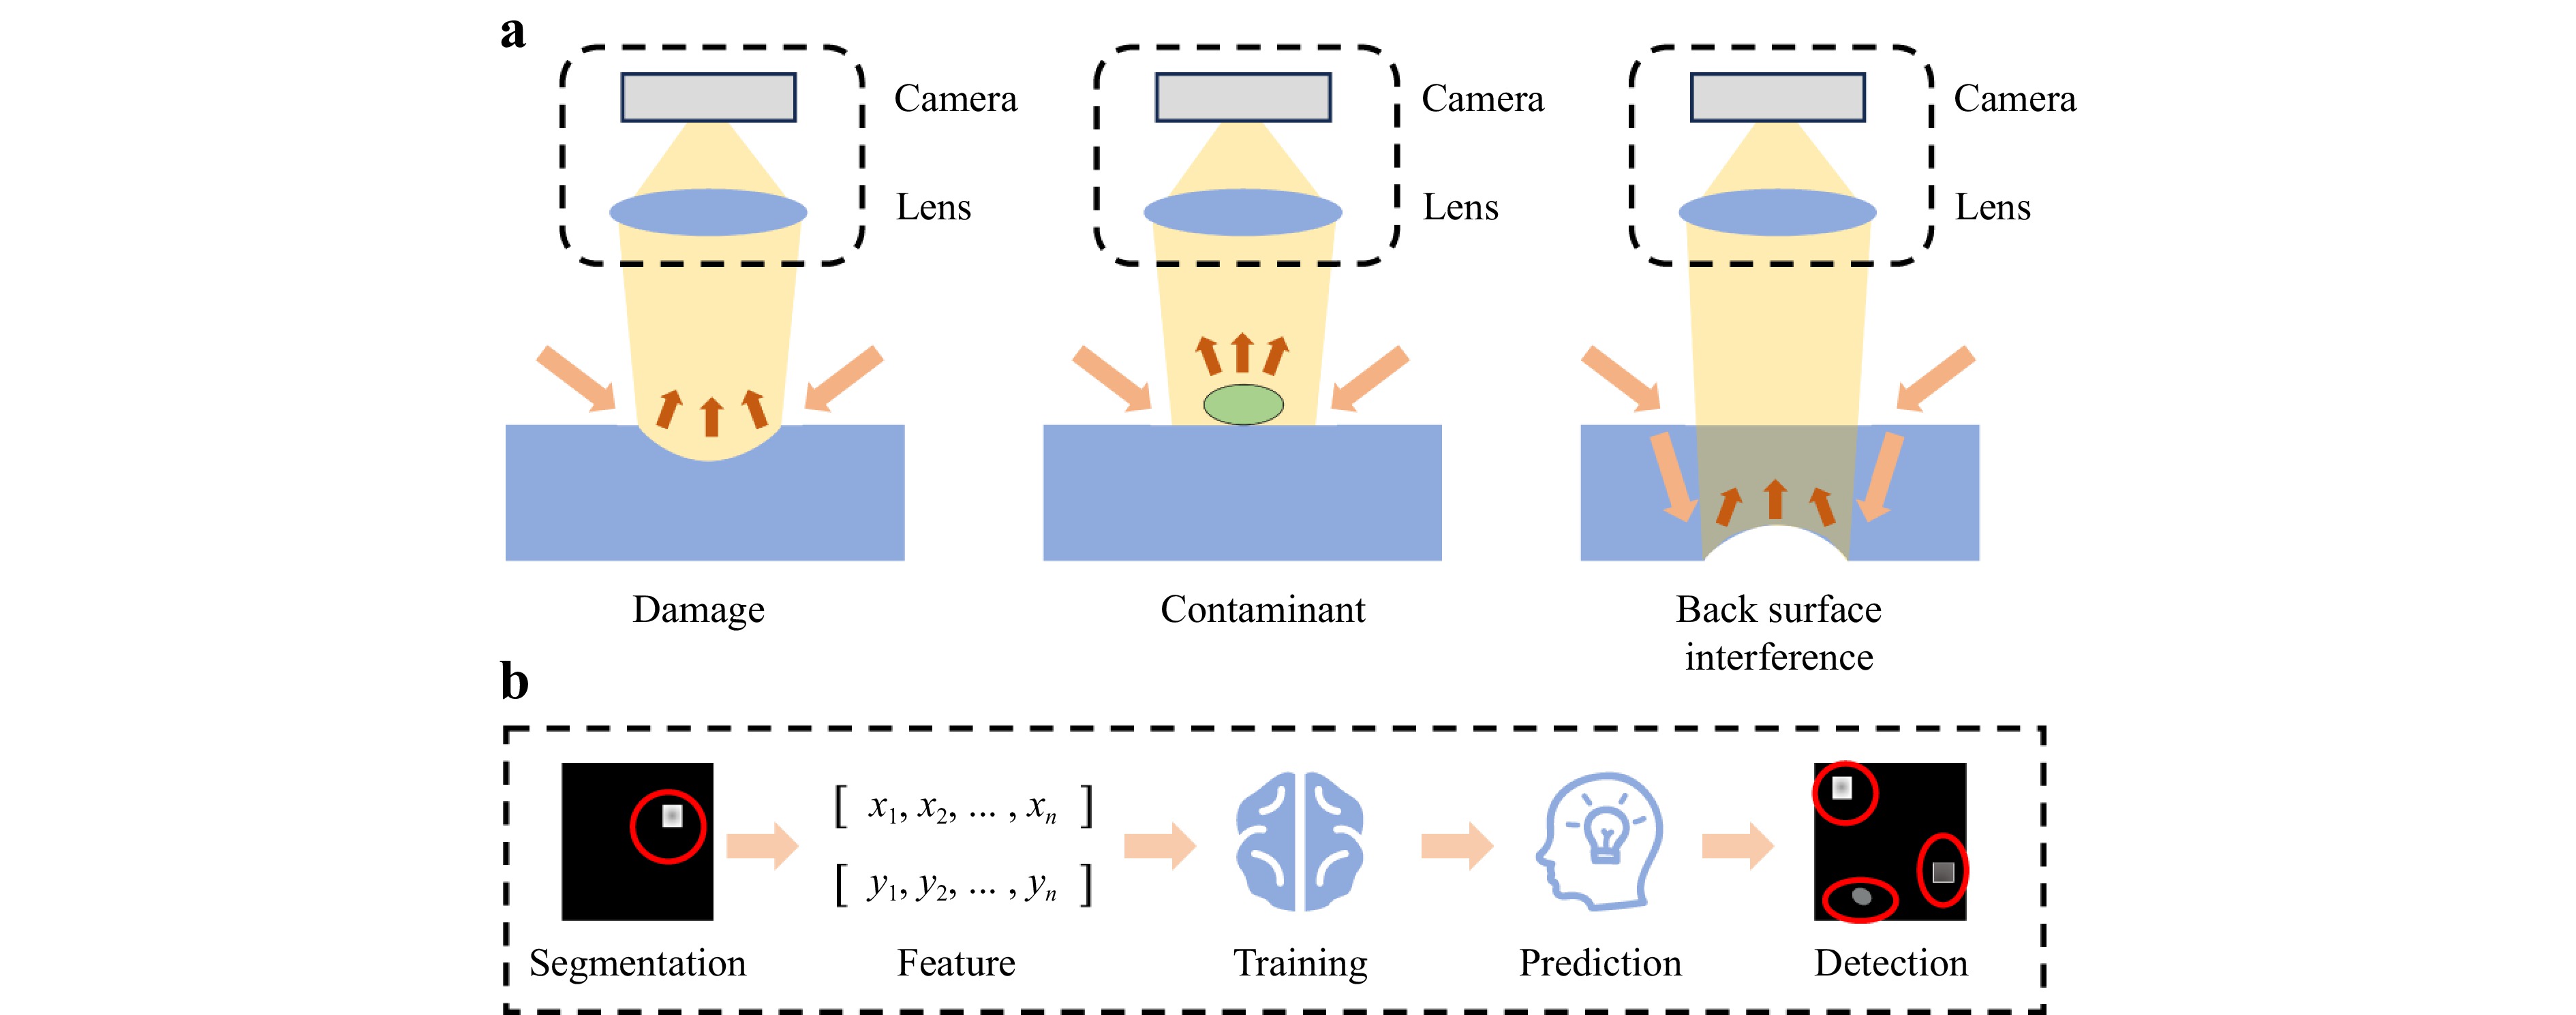
Fig. 5 Efficient and precise detection of surface flaws based on machine vision and machine learning. a Flaw detection using the dark-field method, showing, from left to right, damage, contaminant, and back surface interference. b Framework of the surface flaw inspection algorithm.
Edge enhancement is a commonly used technique for defect detection, and recent advancements in metasurface technology have enhanced this technique using metasurface-based differential interference contrast (DIC). Indeed, the development of metasurfaces capable of light-field calculations has expanded the human ability to manipulate light52–58. In contrast to the Wollaston prism, metasurfaces can perform differential operations to extract object edges, significantly improving upon DIC performance59–62. However, the manufacture of metasurfaces remains challenging, and further work is required to improve associated quantitative measurement techniques.
-
Structured light is a measurement technology derived from machine vision that was primarily developed to address pixel ambiguity in general applications. Current applications of structured light include fringe projection profilometry (FPP)63–66 for diffuse reflective objects and phase measurement deflectometry (PMD)67 for highly reflective objects, as illustrated in Fig. 6. These mature methods can efficiently reconstruct object shapes based on the distortion of stripes by the surface of the observed object.
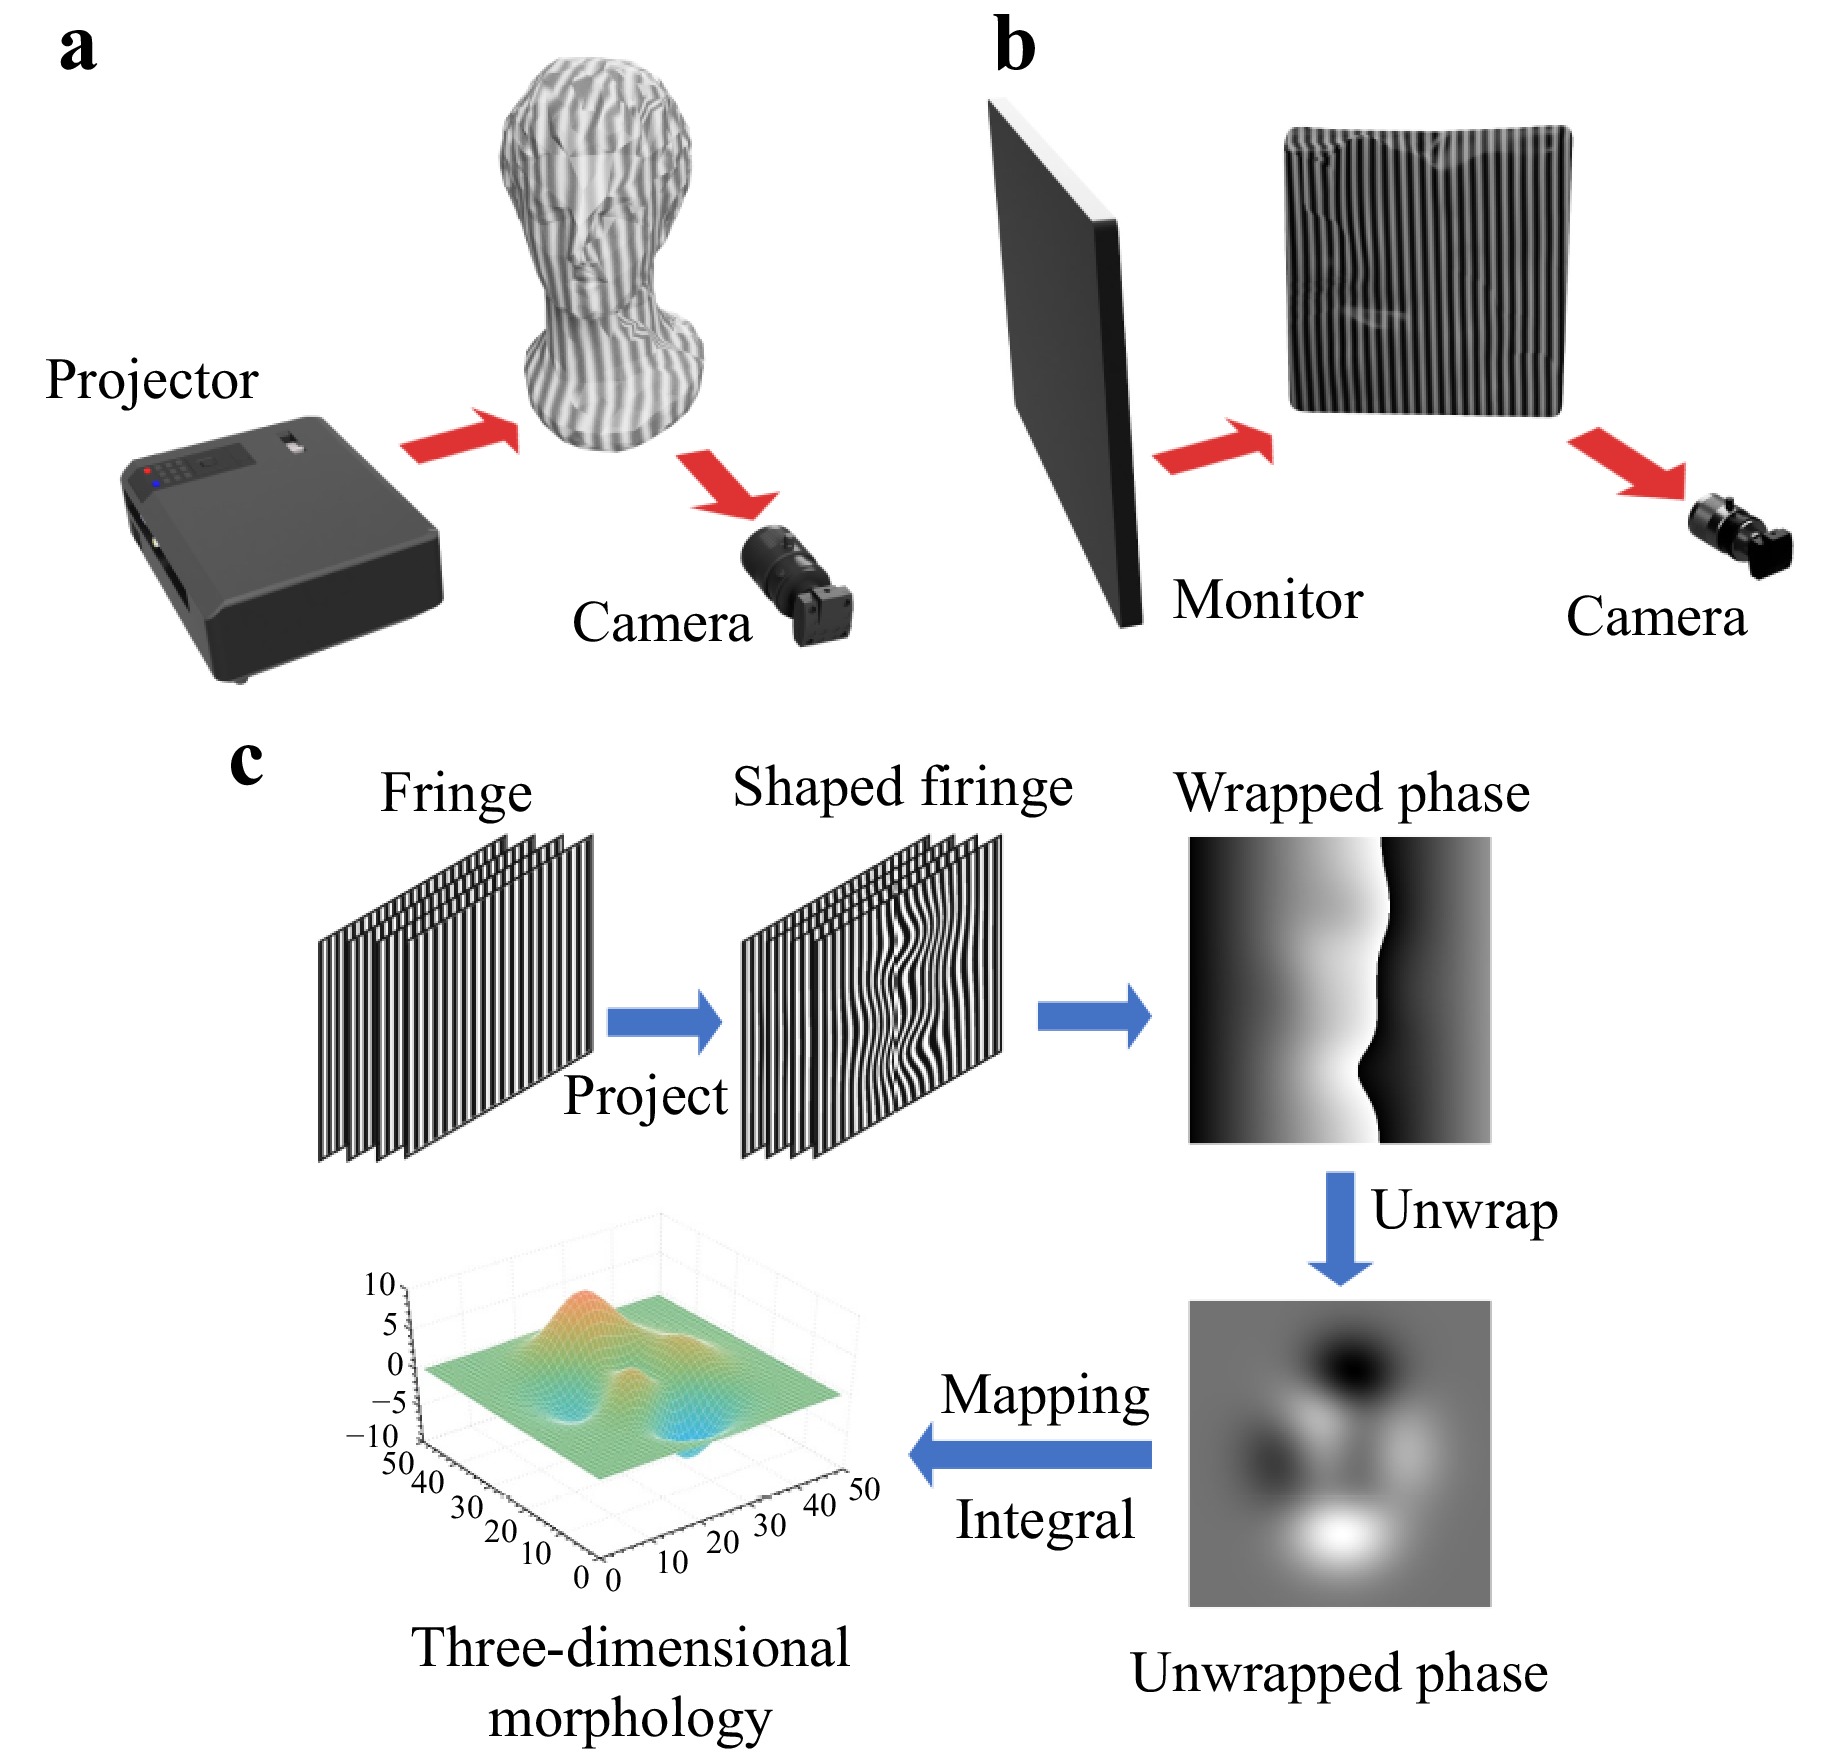
Fig. 6 Schematic diagram of FPP and PMD. a Structure of the FPP system, including projector and camera. The projector projects a fringe onto the observed object that is modulated by the object and captured by the camera. b Structure of the PMD system, including monitor and camera. The monitor displays the fringes reflected and modulated by the highly reflective object being measured. c Flowchart for reconstruction using structured light. First, phase-shifted sinusoidal fringes are generated and projected onto the measured object to capture deformed fringe patterns. The wrapped phase map is subsequently extracted from these deformed images, then phase unwrapping is conducted to produce the absolute phase map. Finally, this map is utilised to reconstruct the three-dimensional morphology of the object. Notably, after calibration, the absolute phase in FPP can be directly correlated with the actual height of the object, whereas in PMD, the absolute phase corresponds to the gradient and requires integration to recover the true object shape.
However, both FPP and PMD face challenges when inspecting transparent objects owing to the presence of weakly reflected light, which results in lower-quality fringes and poorer reconstruction results. Researchers attempting to overcome this problem have proposed improvements and optimisations from various perspectives, as discussed in the next section.
-
Attempts to optimise the structured light method for the measurement of diffuse and highly reflective objects have been widespread. One approach for doing so is to enhance traditional structured light systems using multi-sensor fusion. For example, Ji et al. combined red–green–blue (RGB) images with structured light data to fill in missing parts in the observation of the transparent object and reported improved measurement results68, as shown in Fig. 7a. However, this method may not fundamentally improve the reconstruction accuracy. Another approach involves changing the structured light coding method to separate the secondary reflected light. Lei et al. achieved this by projecting two different frequencies of fringe-structured light69, whereas Ye et al. decoupled the coupled fringes formed by the light reflected off of the upper and lower surfaces during PMD70, enabling in situ measurements of transparent objects. Furthermore, Yang et al. proposed the novel encoding method illustrated in Fig. 7b to better address object highlights and transparency71. In addition to employing the spatial modulation of structured light, Liu et al. resolved the ambiguity of multiple refracted and reflected points in transparent objects by dividing the fringes in the time domain72, and He et al. introduced the laser tracking frame-to-frame (LTFtF) method shown in Fig. 7c73, which distinguishes the front and back surface reflections by comparing the moving speeds between neighbouring frames. The use of structured light methods with low-transmittance wavelengths, such as UV, can also be effective. Rantoson et al. used a binocular vision UV structured light system to measure transparent objects74. Moreover, Gu et al. combined structured light with compressed sensing to successfully measure and reconstruct transparent objects such as smoke, fog, and glass-embedded structures75.
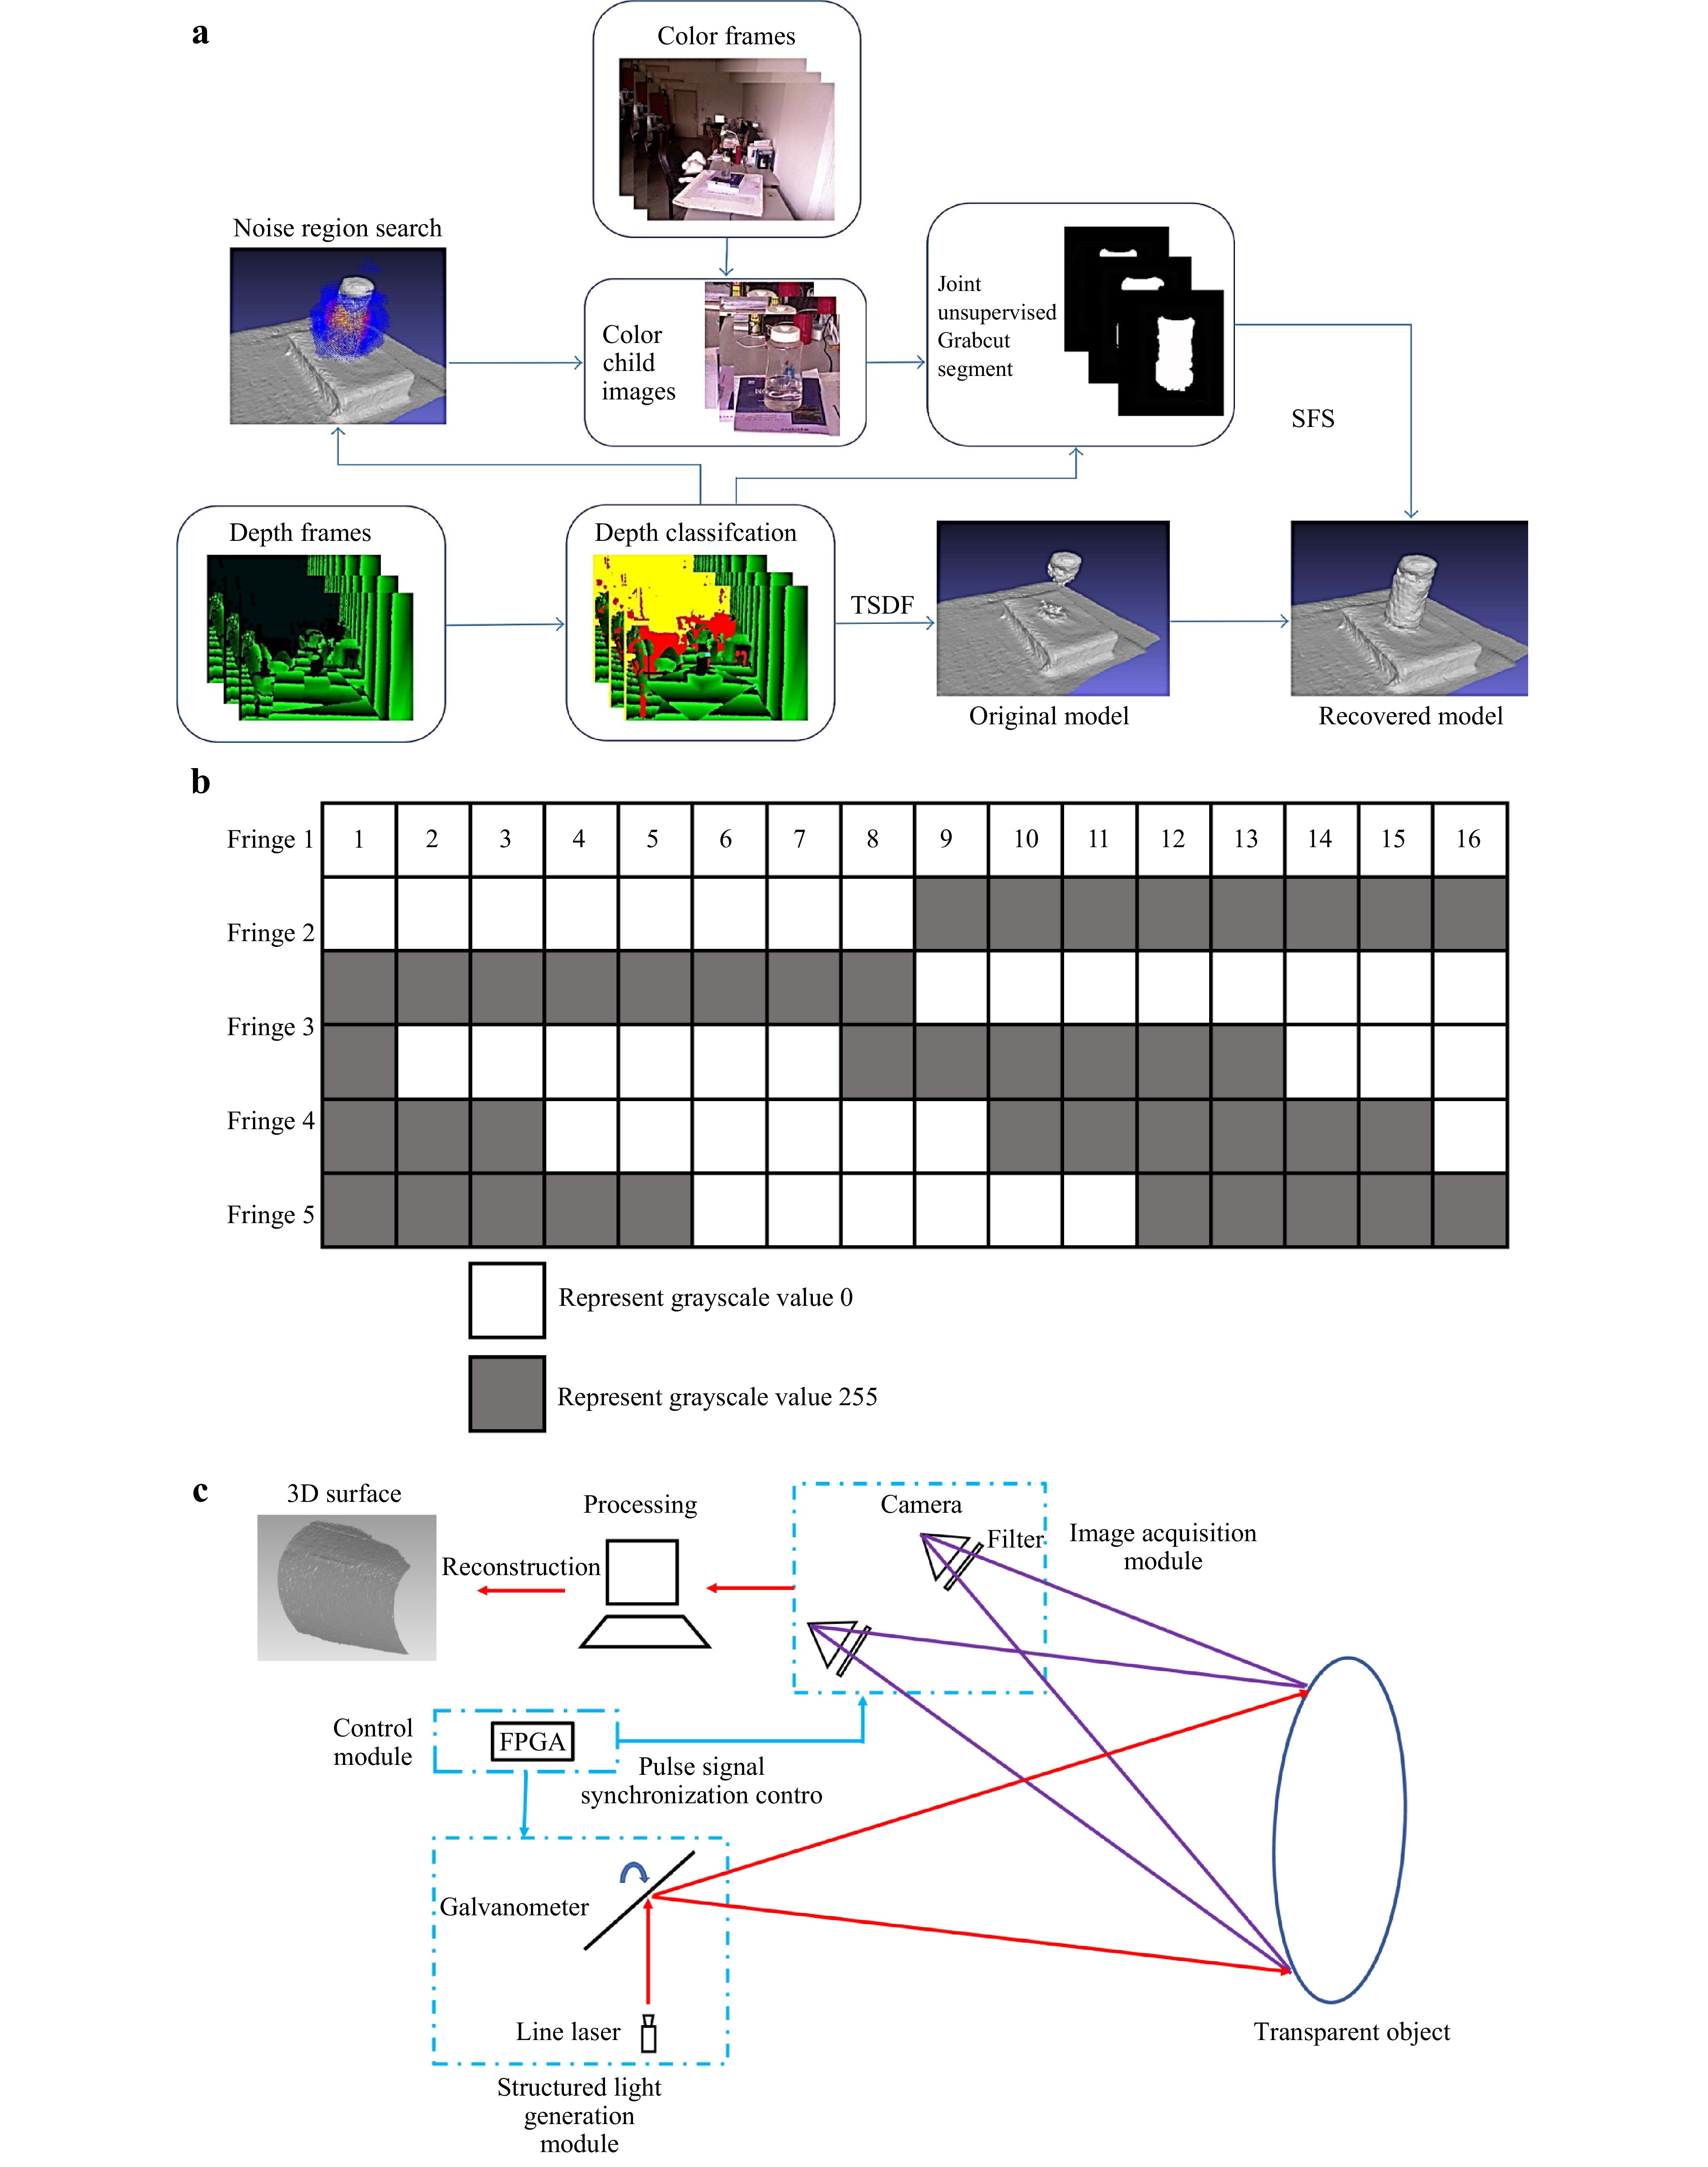
Fig. 7 a Overview of method fusing RGB images with the depth data measured by the structured light framework. Reproduced with permission68. Copyright 2017, Creative Commons Attribution 4.0 International License. b A novel encoding method for structured light that overcomes highlights and transparency, in which five fringes are required in a single measurement process. c System setup for the LTFtF method, which uses a line laser to scan and capture the reflected light with binocular vision. Reproduced with permission73. Copyright 2022, Elsevier Inc.
Another approach for improving structured light methods involves analysing the properties of the transmitted and scattered structured light using new theories. For example, Huang et al. analysed mathematical models of the transmitted and reflected structured measurements collected from transparent objects76, Guo et al. reconstructed the shape of a transparent object by leveraging the spatial frequency variation of the fringes77, and Trivedi et al. utilised the Eikonal equation to derive the relationship between the transparent object and distorted transmitted structured light78.
-
Moiré patterns79 and the Talbot effect provide effective avenues for measuring transmitted structured light. As shown in Fig. 8a, Xu and Liechti utilised moiré deflectometry to detect the focal length of transparent films80 by adding the self-image of the transparent object to the grating and thereby generating moiré patterns, facilitating the measurement of light refraction. Similarly, Ri and Muramatsu used moiré patterns to measure the flatness of a glass plate81 by utilising the misalignment of the grating image transmitted through the plate to measure its thickness. Thakur et al. measured transparent objects by inducing interference between the grating self-image modulated by the object and a reference grating, allowing the transparent object information to be inversely solved according to the interference fringes82. Meziane et al. utilised the grating image transmitted from a transparent object at an angle to a reference grating to form a moiré pattern, as shown in Fig. 8b83. A combination of the Talbot effect and Moiré pattern can also be used to measure the RI of a transparent medium, as demonstrated by Bhattacharya84. Indeed, moiré patterns and the Talbot effect can complement each other, and when combined with modern structured illumination microscopy85, they hold promise for the inspection of microstructures at scales ranging from millimeters to microns.
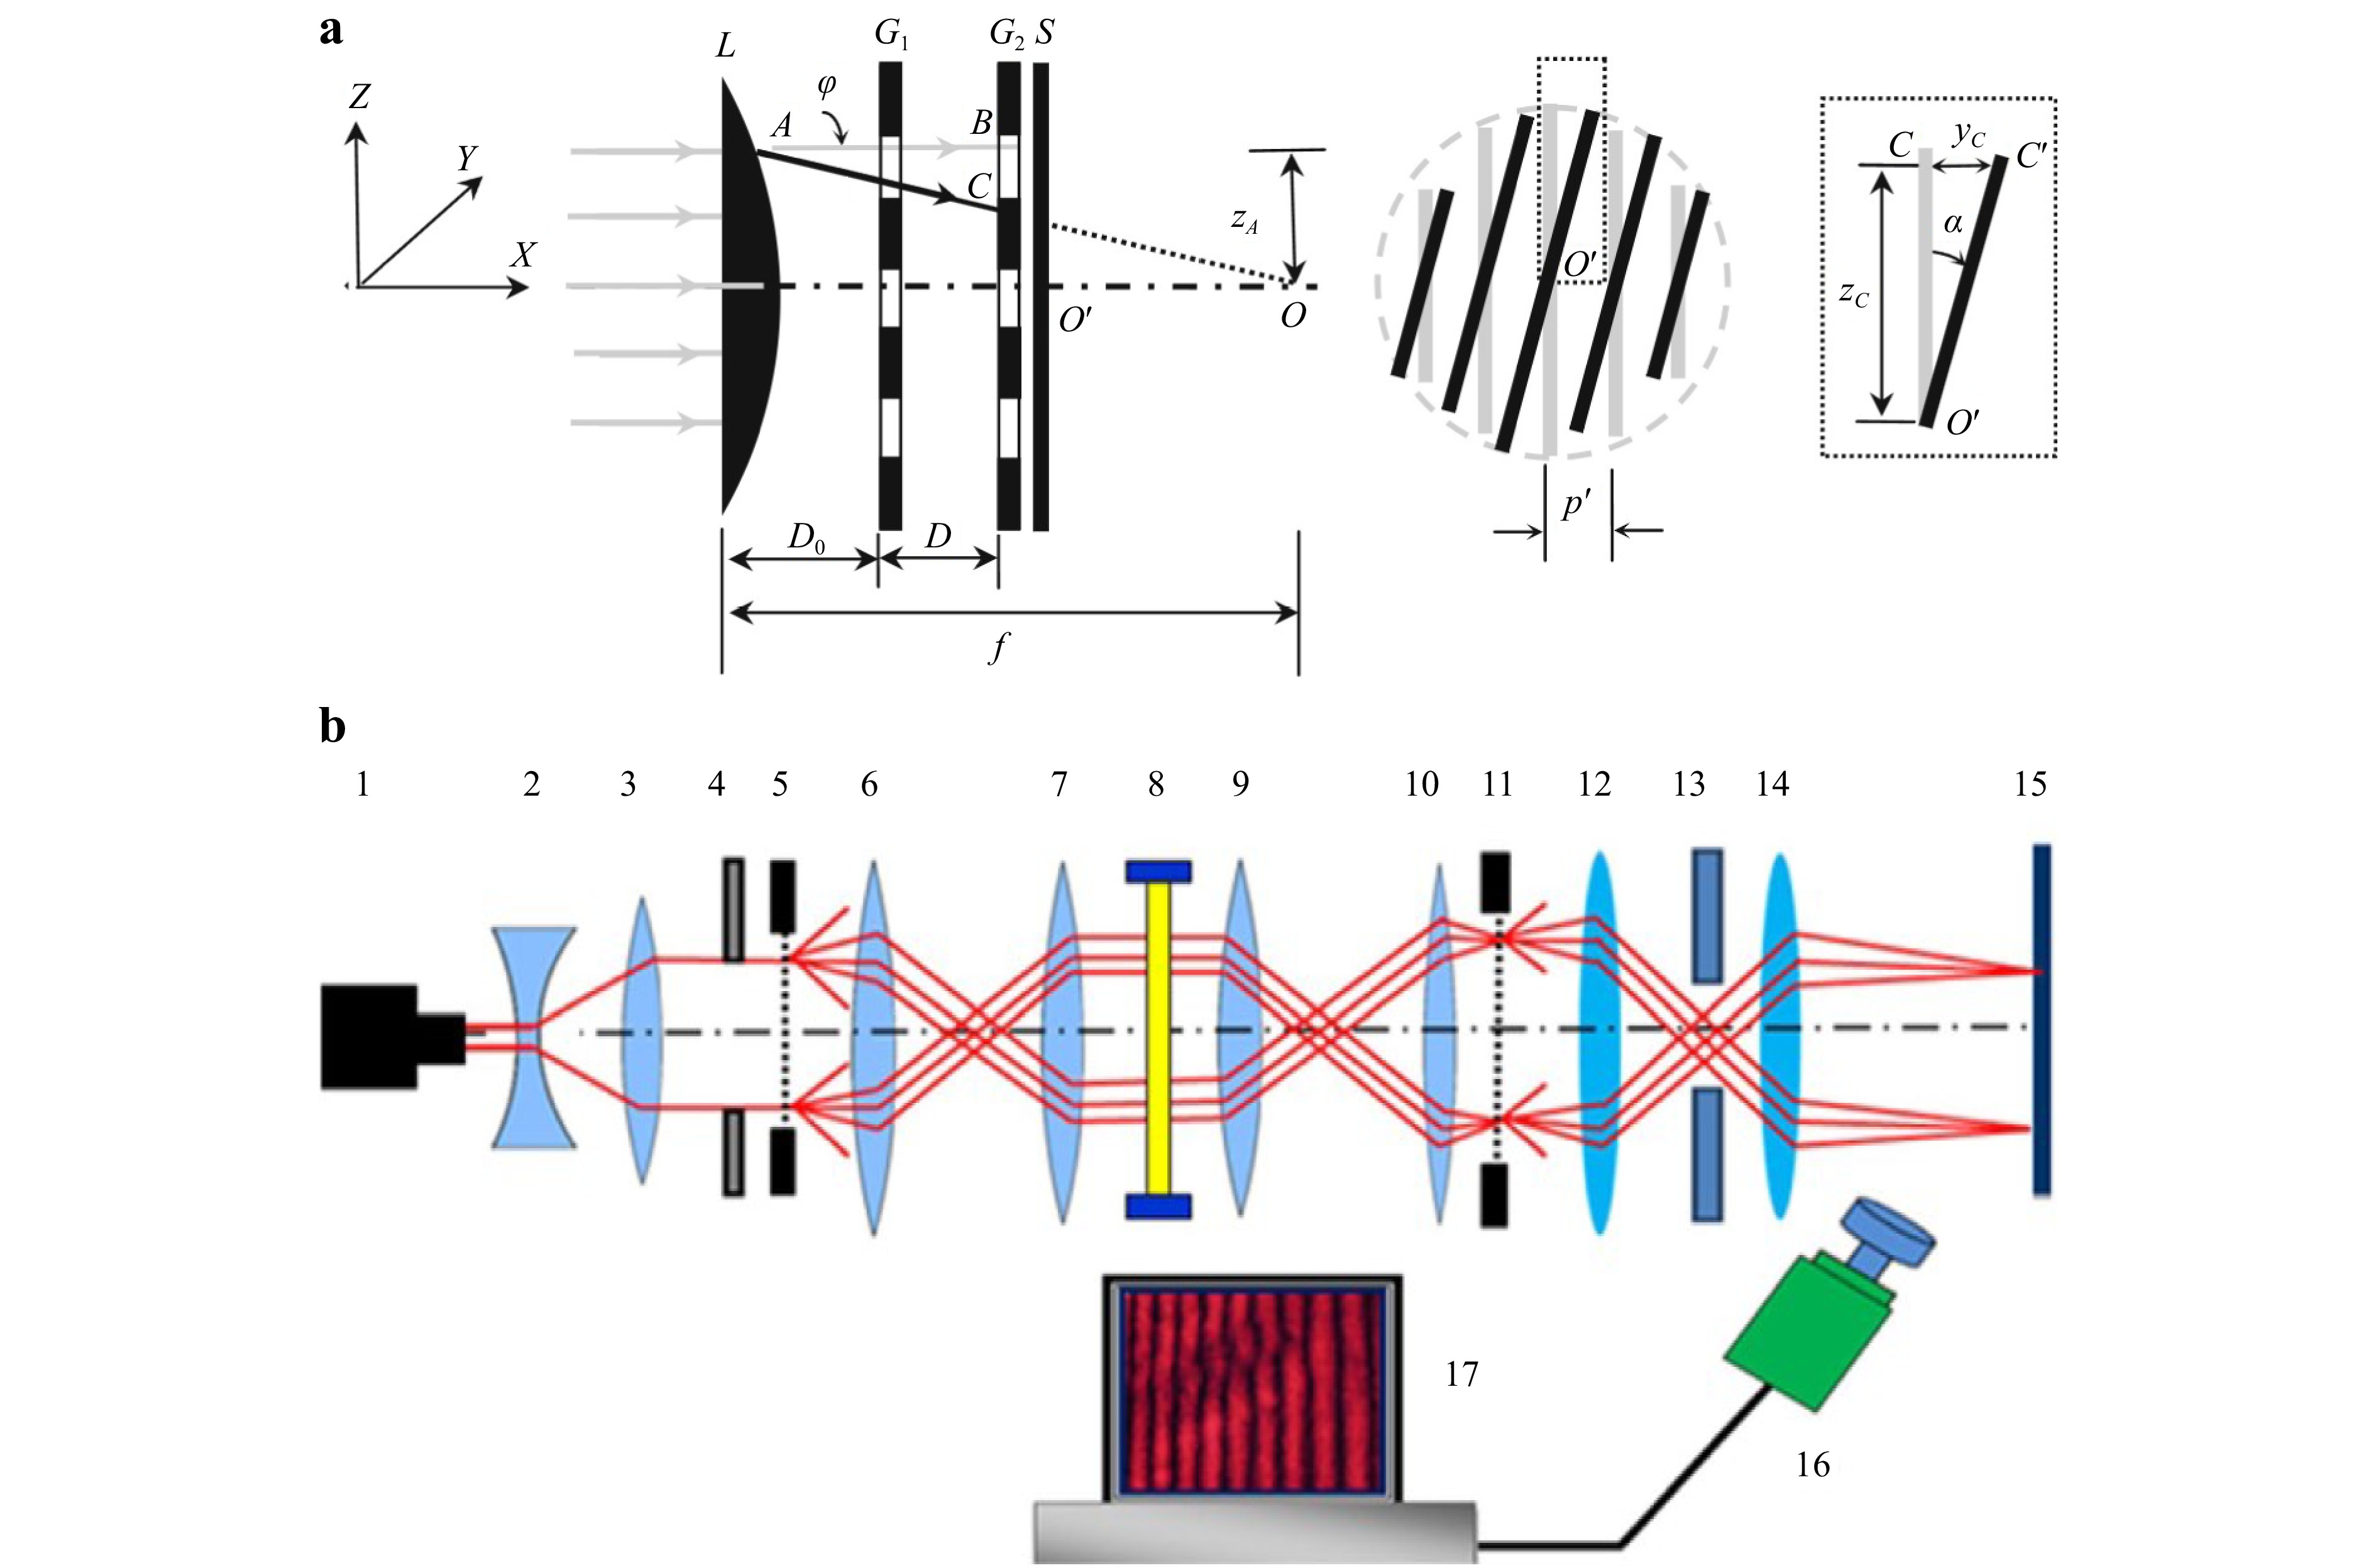
Fig. 8 a Measuring the focus of transparent films using Moiré deflectometry, which relies upon the generation of a Moiré pattern by refracted light interacting with the reference grating. Reproduced with permission80. Copyright 2009, Society for Experimental Mechanics. b System setup for the measurement of transparent objects using the Talbot effect, in which 5 and 11 are gratings and 8 is the object under inspection. Reproduced with permission83. Copyright 2023, Springer-Verlag London Ltd., part of Springer Nature.
-
Eren et al. proposed a novel method the optical measurement of transparent objects that comprises heating the object, then analysing its thermal distribution86; this represents an unconventional approach for optical measurement87. Meriaudeau et al. used laser scanning and an infrared camera to analyse the thermal distribution for object reconstruction88, and Gong and Bansmer utilised a mid-infrared laser to scan ice and reconstruct the melting process89. Anika et al. projected thermal fringes using a carbon dioxide laser and reconstructed a transparent object using binocular infrared vision90, and Landmann et al. used photothermal fringes to reconstruct the shapes of transparent objects91. In contrast to the method employed by Anika et al., Landmann et al. proposed the encoding of structured light to minimise errors owing to thermal diffusion; these approaches are compared in Fig. 9. These studies suggest that photothermal methods hold promise for measuring transparent objects and overcoming the measurement difficulties associated with their unique optical characteristics.
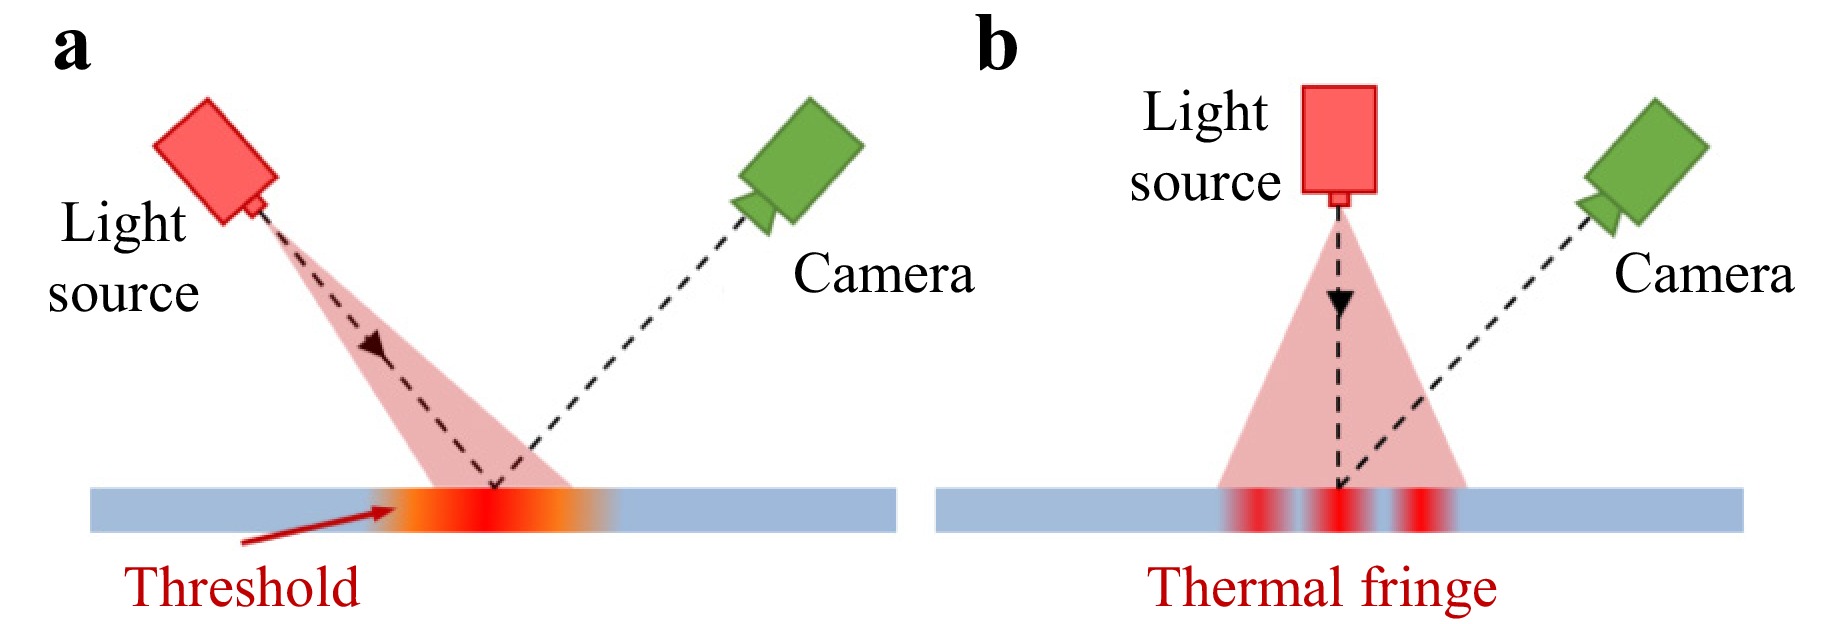
Fig. 9 Two typical photothermal measurement methods. a Analysing the thermal distribution induced by a light source. b Analysing thermal structured light.
However, photothermal methods have several limitations that can hinder their application: they cannot achieve completely non-destructive measurements because they may cause permanent damage to heat-sensitive materials, and they are more sensitive to environmental conditions because they rely on heat detection.
-
Micro-scale measurements, which are typically in the micron and even nanometre ranges, are crucial for assessing the microstructural quality of objects, especially in manufacturing applications, where issues such as substandard flatness or roughness can lead to overall component failure and hinder proper system functionality. Various methods have been developed for obtaining micro-scale measurements based on interference, non-interference, spectroscopy, and dispersion. Each approach offers unique capabilities for achieving accurate and reliable measurements at the micro-scale level.
-
Interference represents a traditional approach for extracting the phase of light. The small scale of the wavelengths in the visible light range allows microscopic structures to be magnified into macroscopic phenomena such as interference fringes through the interference of light. Moreover, the advent of digital holography has brought new vitality and potential to interference-based methods by offering unique capabilities and opportunities for advanced applications.
-
Since its inception, interferometry has been instrumental in the high-precision measurement of microstructures. The underlying principle relies on the modulation of phase by the thickness of an object to represent phase differences using fringes through the interference between the object and reference lights. The introduction of the four-step phase-shift method revolutionised interferometry, enabling quantitative measurements. Subsequently, several modified schemes have been developed to address the limitations of traditional interferometry methods. This section focuses on methods used to generate interference fringes and obtain phase information through operations such as phase unwrapping.
Issues such as the secondary interference fringes produced by high-coherence light have been addressed through the introduction of the white-light interferometer utilising a low-coherence light source, as shown in Fig. 10. This approach has been applied to successfully measure transparent film layers: Petr summarised two methods for measuring transparent films using the white-light interferometer in 200492, and Sun et al. measured the thickness of transparent oil films on water surfaces using this technique in 200593. Furthermore, Li et al. used white-light interferometry to measure the thicknesses, RIs, and dispersion constants of transparent films in 201294 and Audrey et al. combined white-light interferometry with tomography to detect defects in transparent polymers in 201595. Subsequently proposed methods have used white-light interferometry to effectively measure transparent films96–100. However, the limitations of interferometry when measuring thick transparent structures has restricted its widespread use.
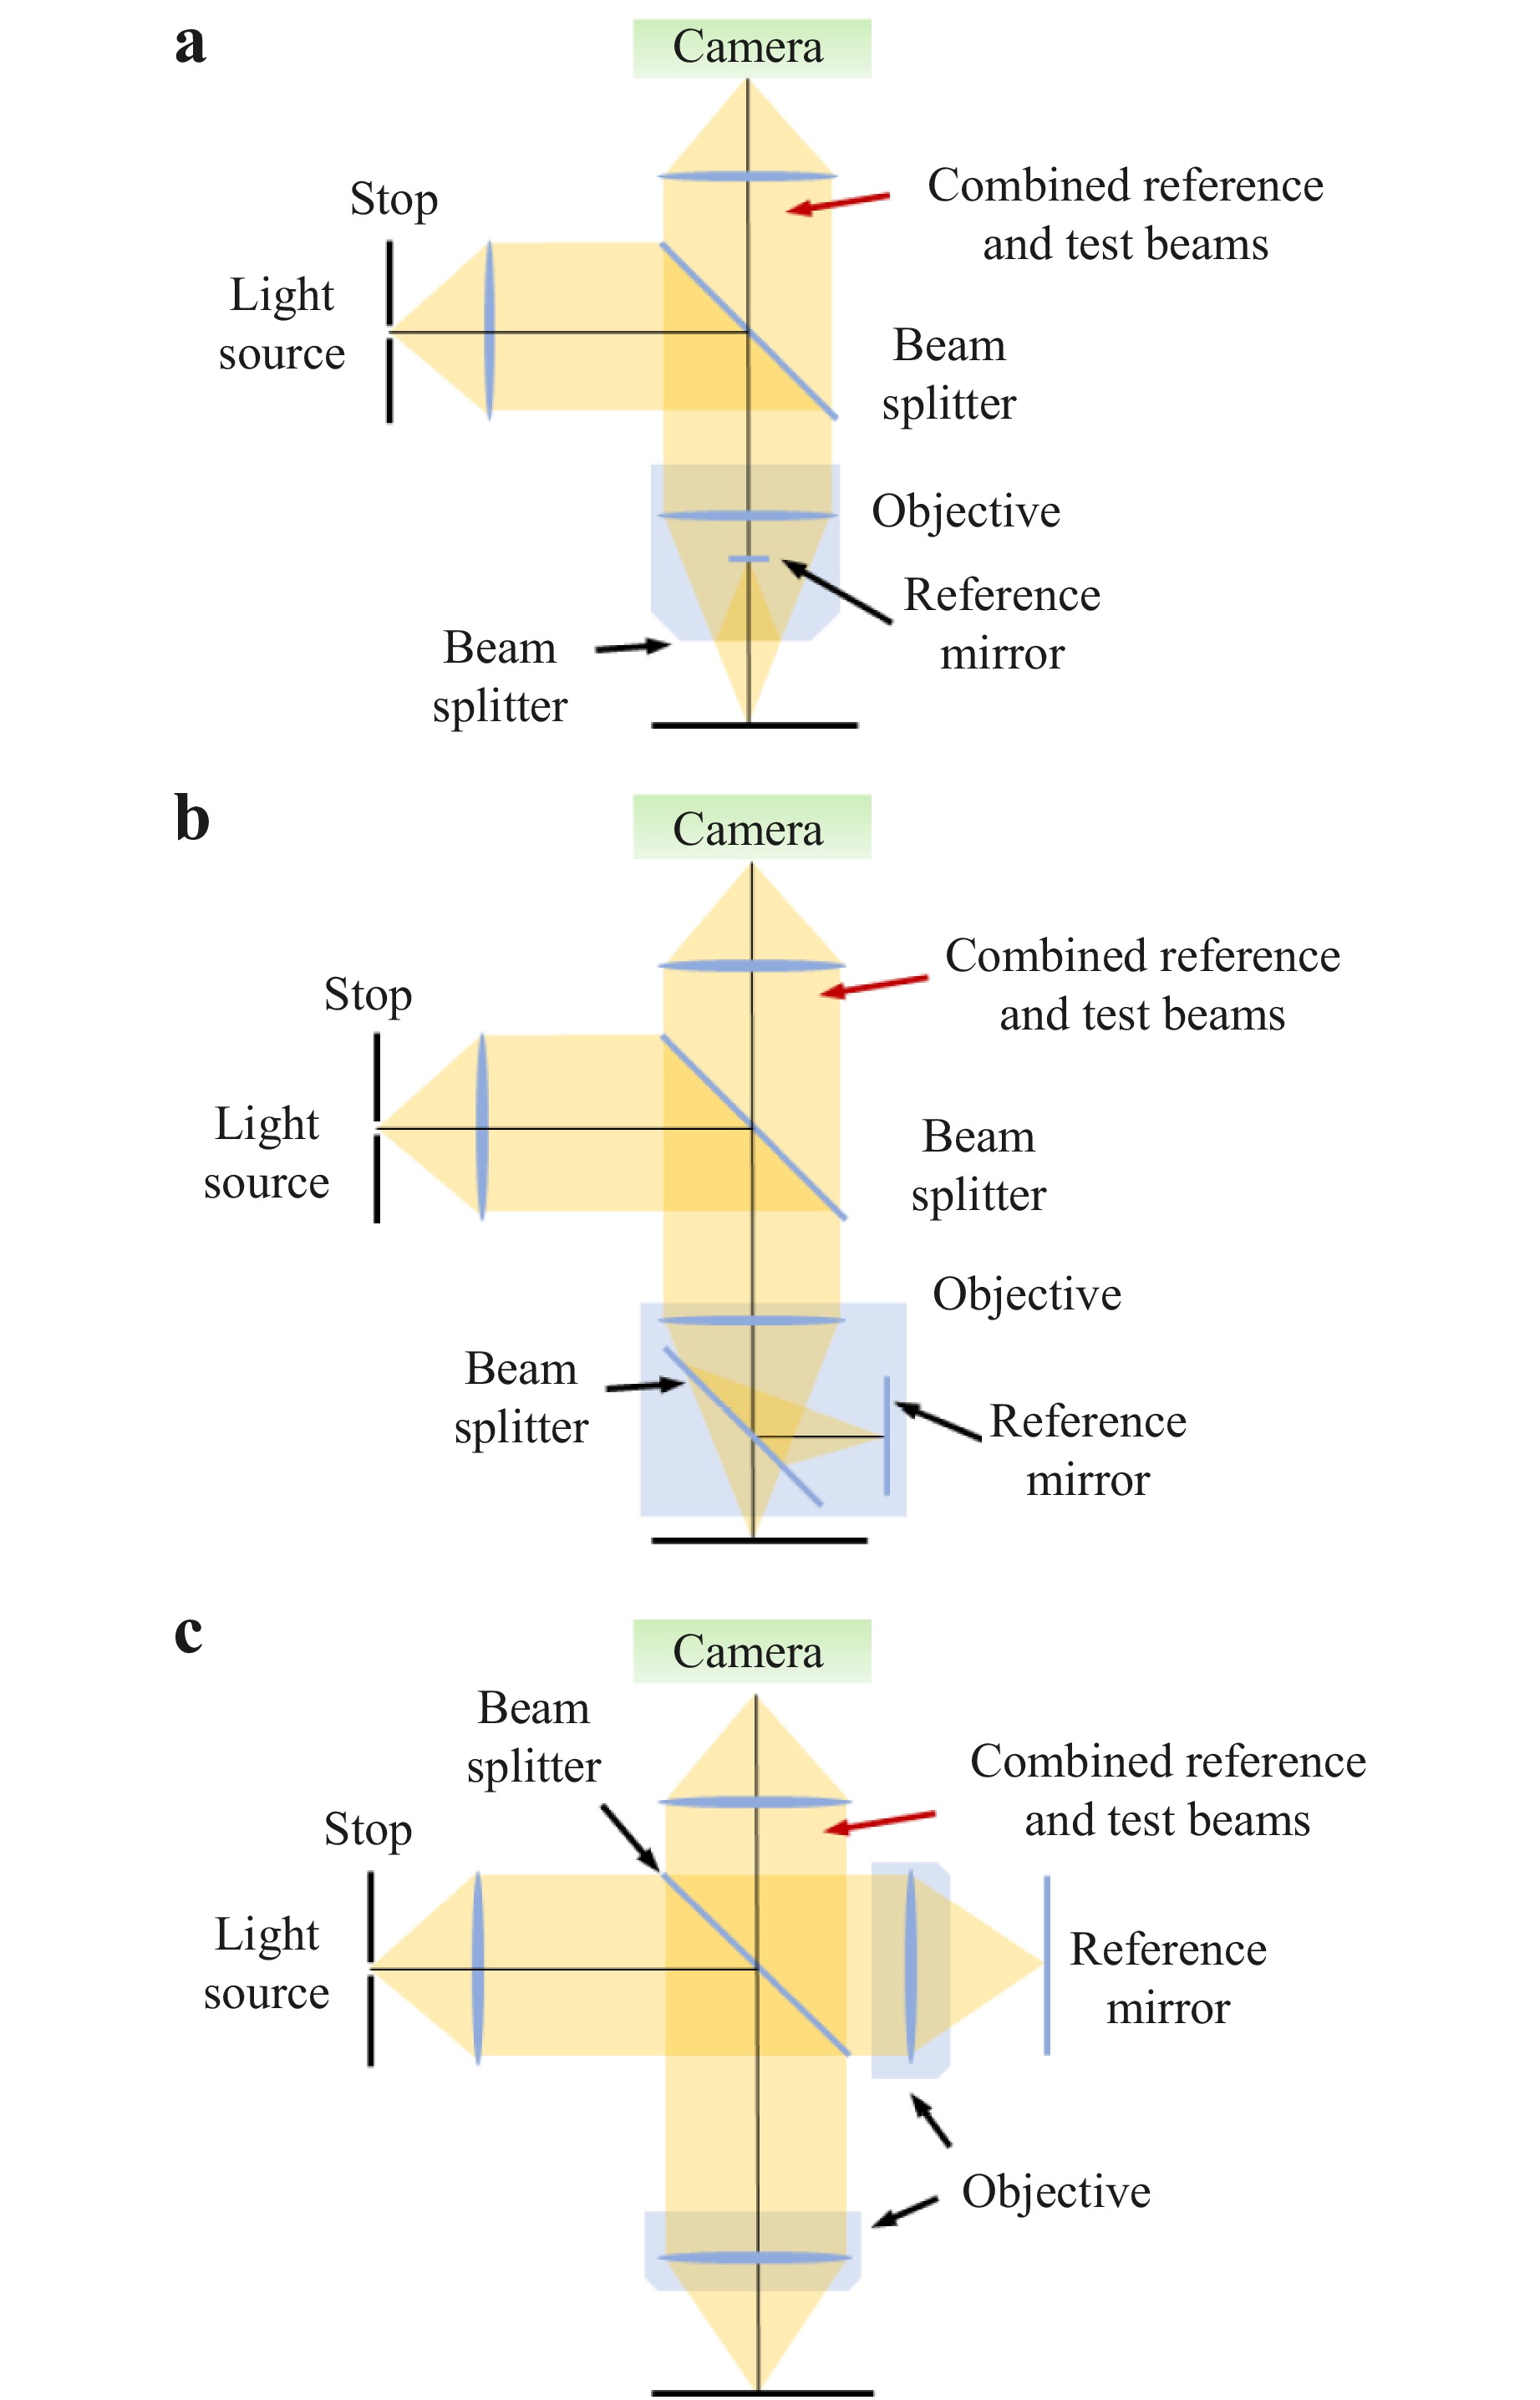
Fig. 10 Three typical white-light interferometer setups. a The Mirau type, which is the most compact and provides excellent resistance to partial vibrations. b The Michelson type, which is suitable for low magnification, large field of view, long-working-distance objective lens designs. c The Linnik type, which is complex, but has an adjustable reference arm.
-
Holography represents a special method of measuring objects using interference fringes, and the development of digital holography101–106 has particularly expanded the range of potential holography applications. Digital holography can be generally divided into on-axis or off-axis methods according to the structure of the optical path. A comparison of on- and off-axis methods is provided in Fig. 11. Each of these methods has different advantages in application.
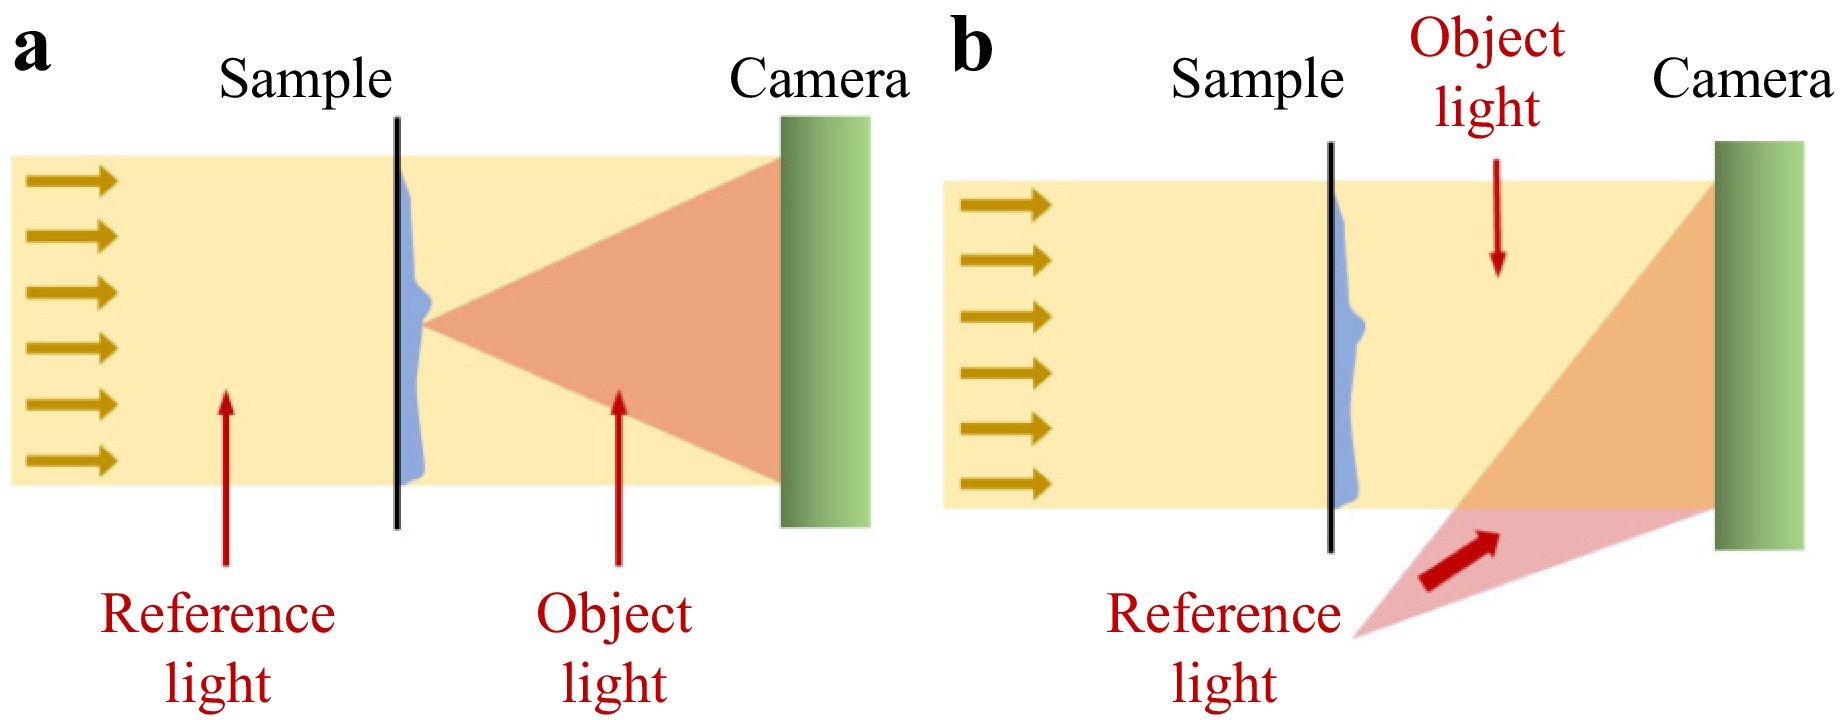
Fig. 11 Two typical digital holography methods. a On-axis holography, in which the object light is scattered by the sample to transmit the reference light. b Off-axis holography, in which the reference light is directly transported to the camera to generate an interferometric fringe on the sensor.
Volker et al. elaborated on the principle of off-axis digital holography in 2001 and used it to measure microlens arrays103. Cuche et al.107 and Kemper and von Bally108 combined digital off-axis holography with phase-contrast techniques to obtain quantitative measurements of organisms. Techniques such as low-coherence light sources109, multiple wavelengths110–116, and multi-beam setups117 have been employed to enhance the precision of and reduce the noise in digital holography measurements. Additionally, novel on-axis beam-splitting methods using prisms118–120, diffraction gratings121, plane mirrors122,123, and optical wedges124 have been proposed to reduce the influence of environmental disturbances.
Indeed, interference fringes are highly sensitive to environmental disturbances, and even slight vibrations can lead to measurement failure. This issue is pronounced in the object–reference light interference methods above. As a result, object–object light interference125 methods have been developed to significantly reduce the challenge of obtaining reliable reference light. For example, in shear interferometry, the light phase information represents the thickness disparities between adjacent positions in the transparent object. Chhaniwal et al.123 used parallel flat crystals to conduct transverse shear interferometry of tiny biological samples, leading to various derivative techniques126–131. Pinholes can also be used to obtain reference light, as demonstrated by Anand et al.132 and Li et al.133, who employed pinhole diffusers as shown in Fig. 12. Furthermore, Mahajan et al. employed a Sagnac interferometric structure with a special filter to generate reference light134, whereas Jafarfard et al. combined this approach with dual wavelengths to realise improved accuracy135.
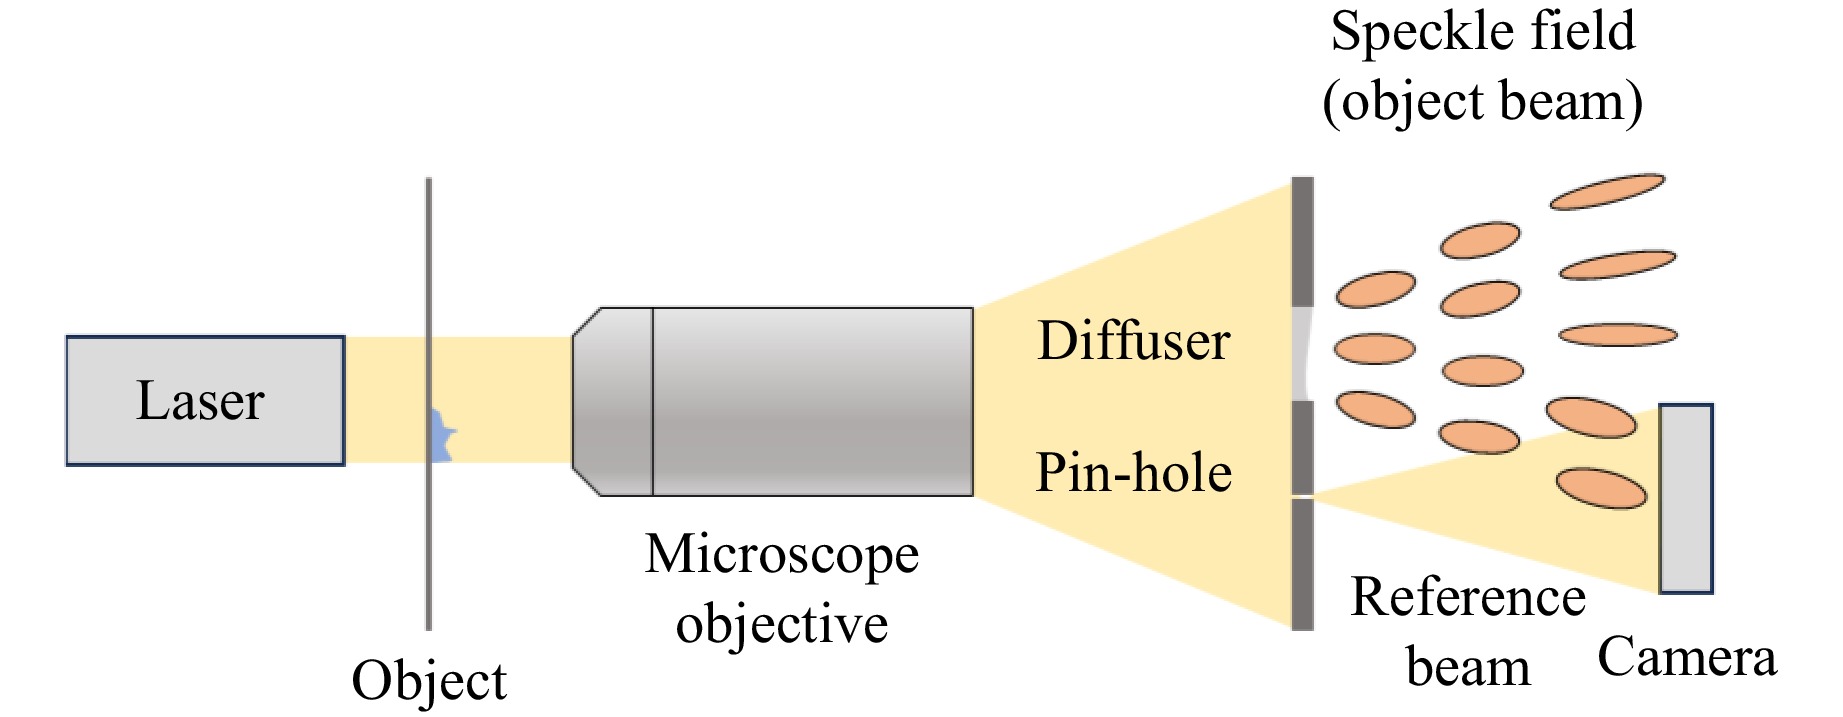
Fig. 12 Quantitative phase microscopy based on single-beam Fourier transform digital holography. Experimental setup of single-beam lensless Fourier transform digital holographic microscopy. Reference beam, generated by pin-hole, interacts with object beam generated by diffuser to record phase information.
The post-processing of digital holography data has become a critical focus of research, resulting in the development of algorithms addressing the measurement speed136, accuracy137, and integration of sparse matrix solving and machine learning138. These advances have significantly enhanced the measurement capabilities of digital holography. Indeed, digital holography shows considerable promise for the measurement of transparent objects given their phase modulation properties, and continued advancements in algorithms and experimental setups are likely to achieve higher accuracy and speed in the future.
-
Critically, interference methods suffer from serious drawbacks, such as high-coherence noise and stringent environmental requirements, that limit their widespread application. Consequently, novel methods and theories have been developed to overcome the constraints associated with conventional approaches for recording phase information using interference fringes. The observation of the light and dark stripes appearing at the bottom of a swimming pool in sunlight suggests that directly analysing the relationship between light phase and intensity represents a viable approach for doing so. Among the methods that circumvent the reliance on interference fringes using this approach, techniques based on the transport of intensity equation (TIE)139 and Fourier ptychography140, illustrated in Fig. 13, stand out as particularly promising.
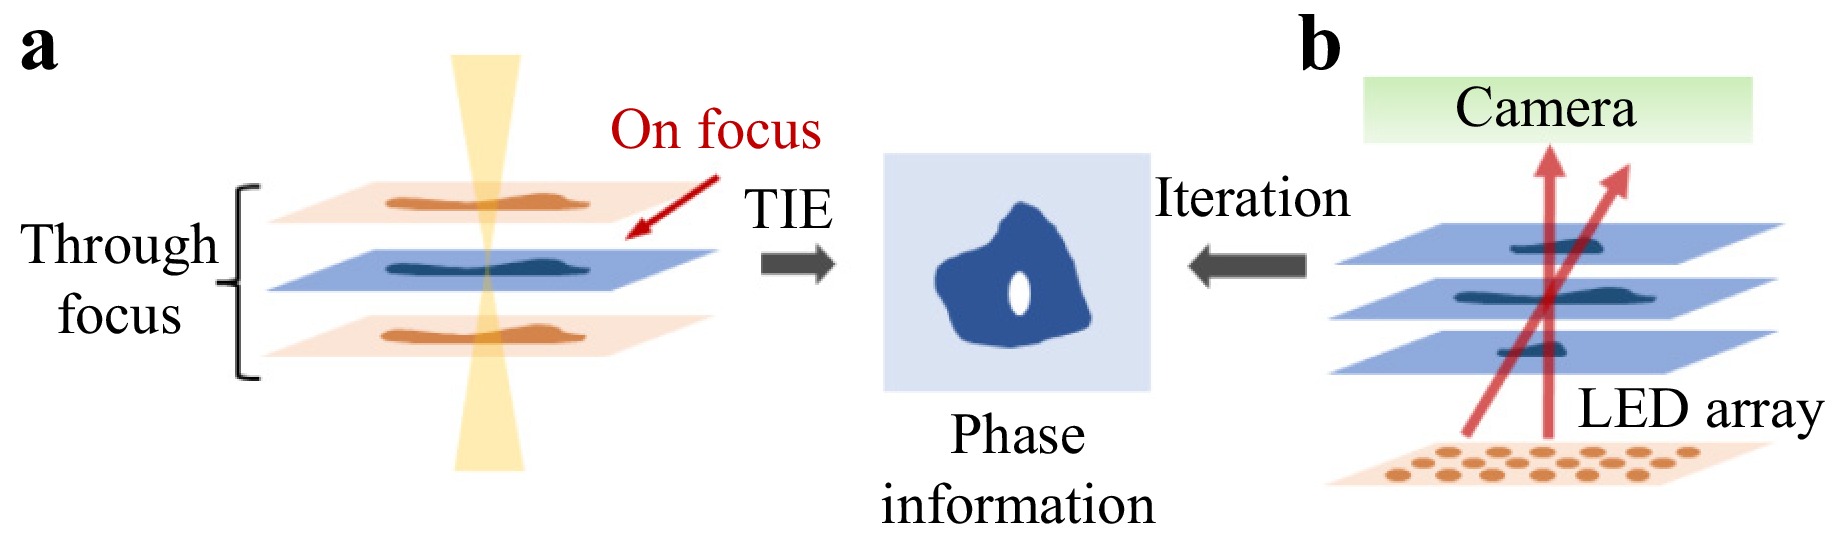
Fig. 13 Schematic diagram of the principles underlying the TIE and Fourier ptychography methods. a The TIE method uses a through-focus image to calculate phase information. b The Fourier ptychography method uses different illumination angles to reconstruct phase information.
-
The retrieval of phase information from intensity data began with the Gerchberg–Saxton (GS) phase iteration algorithm141,142, which was the first to enable quantitative phase measurements. This algorithm was improved upon by the Hybrid Input–Output algorithm proposed by Fienup143. Teague proposed the TIE in 1983144; this represents the first approach to obtain phase information numerically rather than iteratively. Zuo et al. later derived a generalised TIE based on the Wegner function that obeys the Liouville transport equation and is suitable for partially coherent illumination145. Barty et al. achieved phase tomography by rotating the sample146, and Roberts et al.147 and Ampem-Lassen et al.148 used the TIE method to measure optical fibres. Kou et al. combined the TIE with DIC microscopy149 to improve the phase measurement results, Waller et al. utilised the information from multiple off-focus planes of intensity to enhance the accuracy of phase recovery and reduce noise150, and Zuo et al. realised quantitative phase imaging of transparent living cells in real time using the TIE method151,152. The TIE method has also been applied to the measurement of optical objects such as microlenses153. In 2015, Nguyen et al. obtained phase projections at various angles by rotating a transparent object and using the inverse Radon transform to reconstruct a three-dimensional model of it154. Since then, various schemes using the TIE to realise the three-dimensional reconstruction of objects have emerged, as shown in Fig. 14155,156.
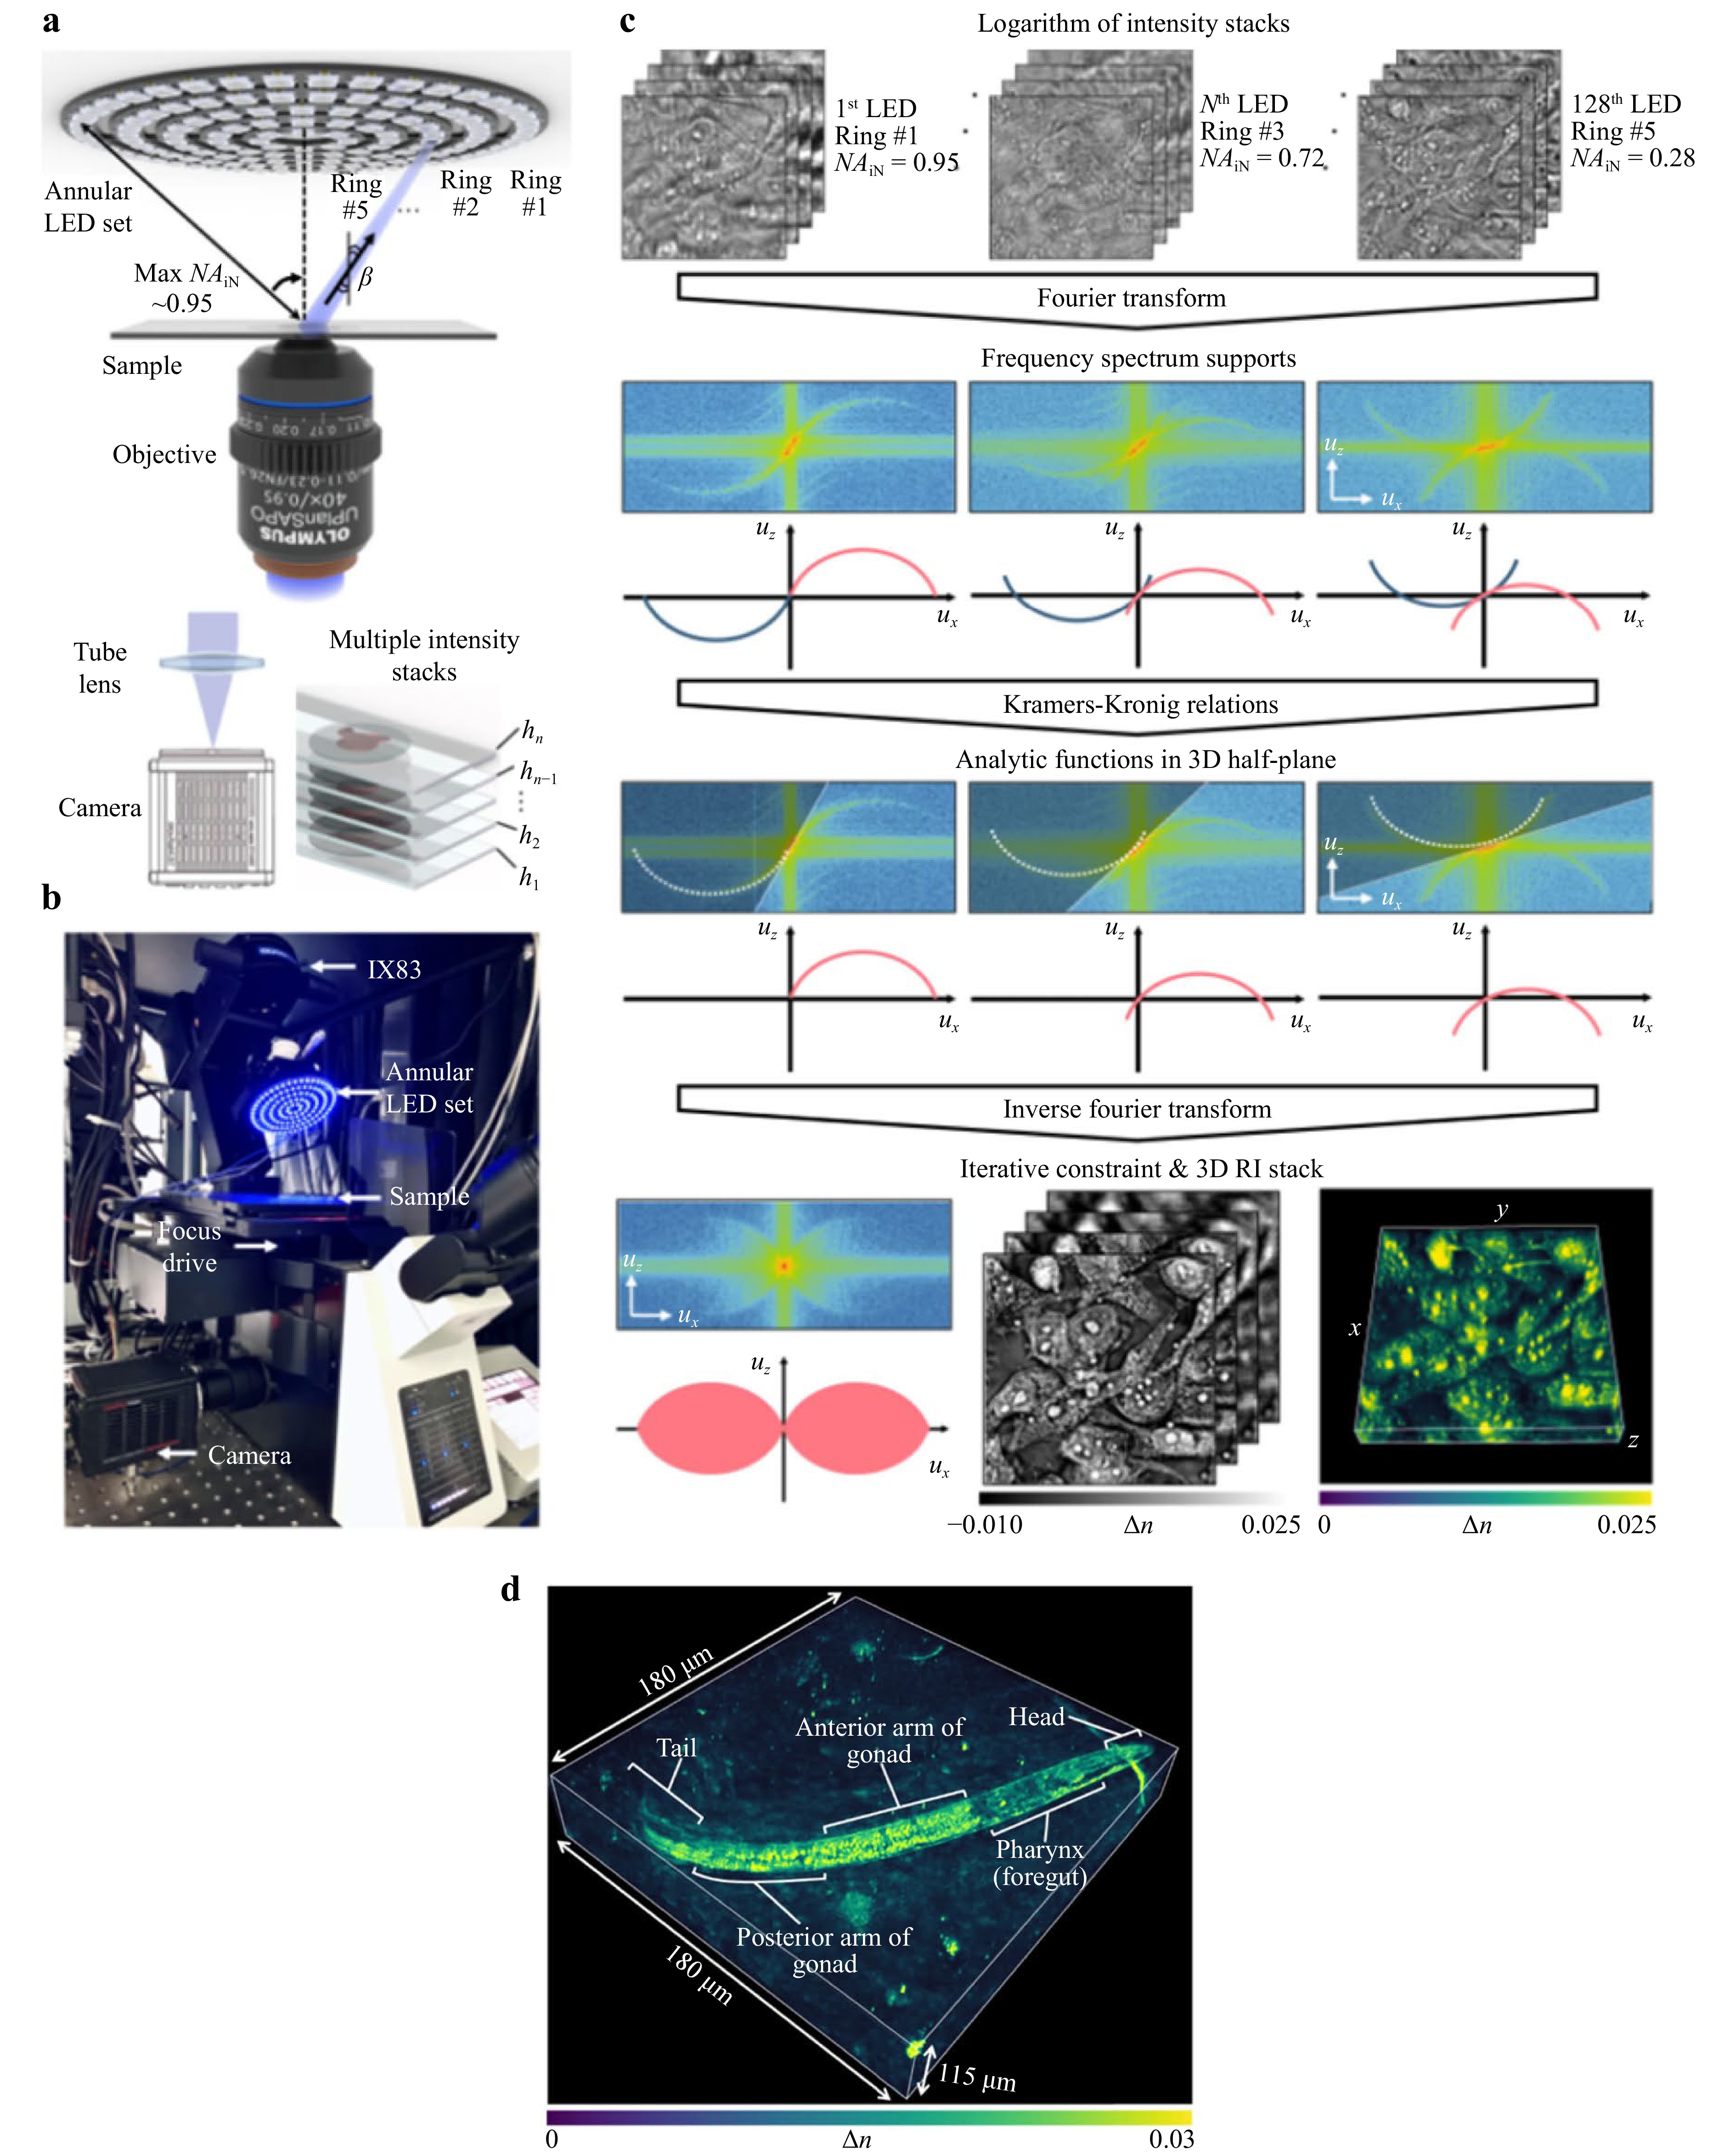
Fig. 14 Three-dimensional reconstruction using transport of intensity diffraction tomography (TIDT). Reproduced with permission156. Copyright 2022, Creative Commons Attribution 4.0 International License. a Setup of TIDT system with a non-interferometric synthetic aperture (TIDT-NSA) based on a commercial microscope equipped with a multi-annular light-emitting diode (LED) array. b A photo of the system. c Flowchart of data processing in TIDT-NSA for three-dimensional RI reconstruction. d Three-dimensional RI rendering of C. elegans worm over a volume of 180 × 180 × 15 μm.
-
In contrast to the TIE, Fourier ptychography140 was initially proposed to address the need for high-resolution, large field-of-view imaging. Fourier ptychography essentially enables the tomography of transparent objects. In 2015, Li et al. utilised Fourier ptychography to achieve three-dimensional multilayer imaging157. Subsequently, the two mainstream methods described in Fig. 15 were developed: one that performs three-dimensional tomography through iteration in the Fourier spectral domain158–159 and another that constructs a multi-slice model160.
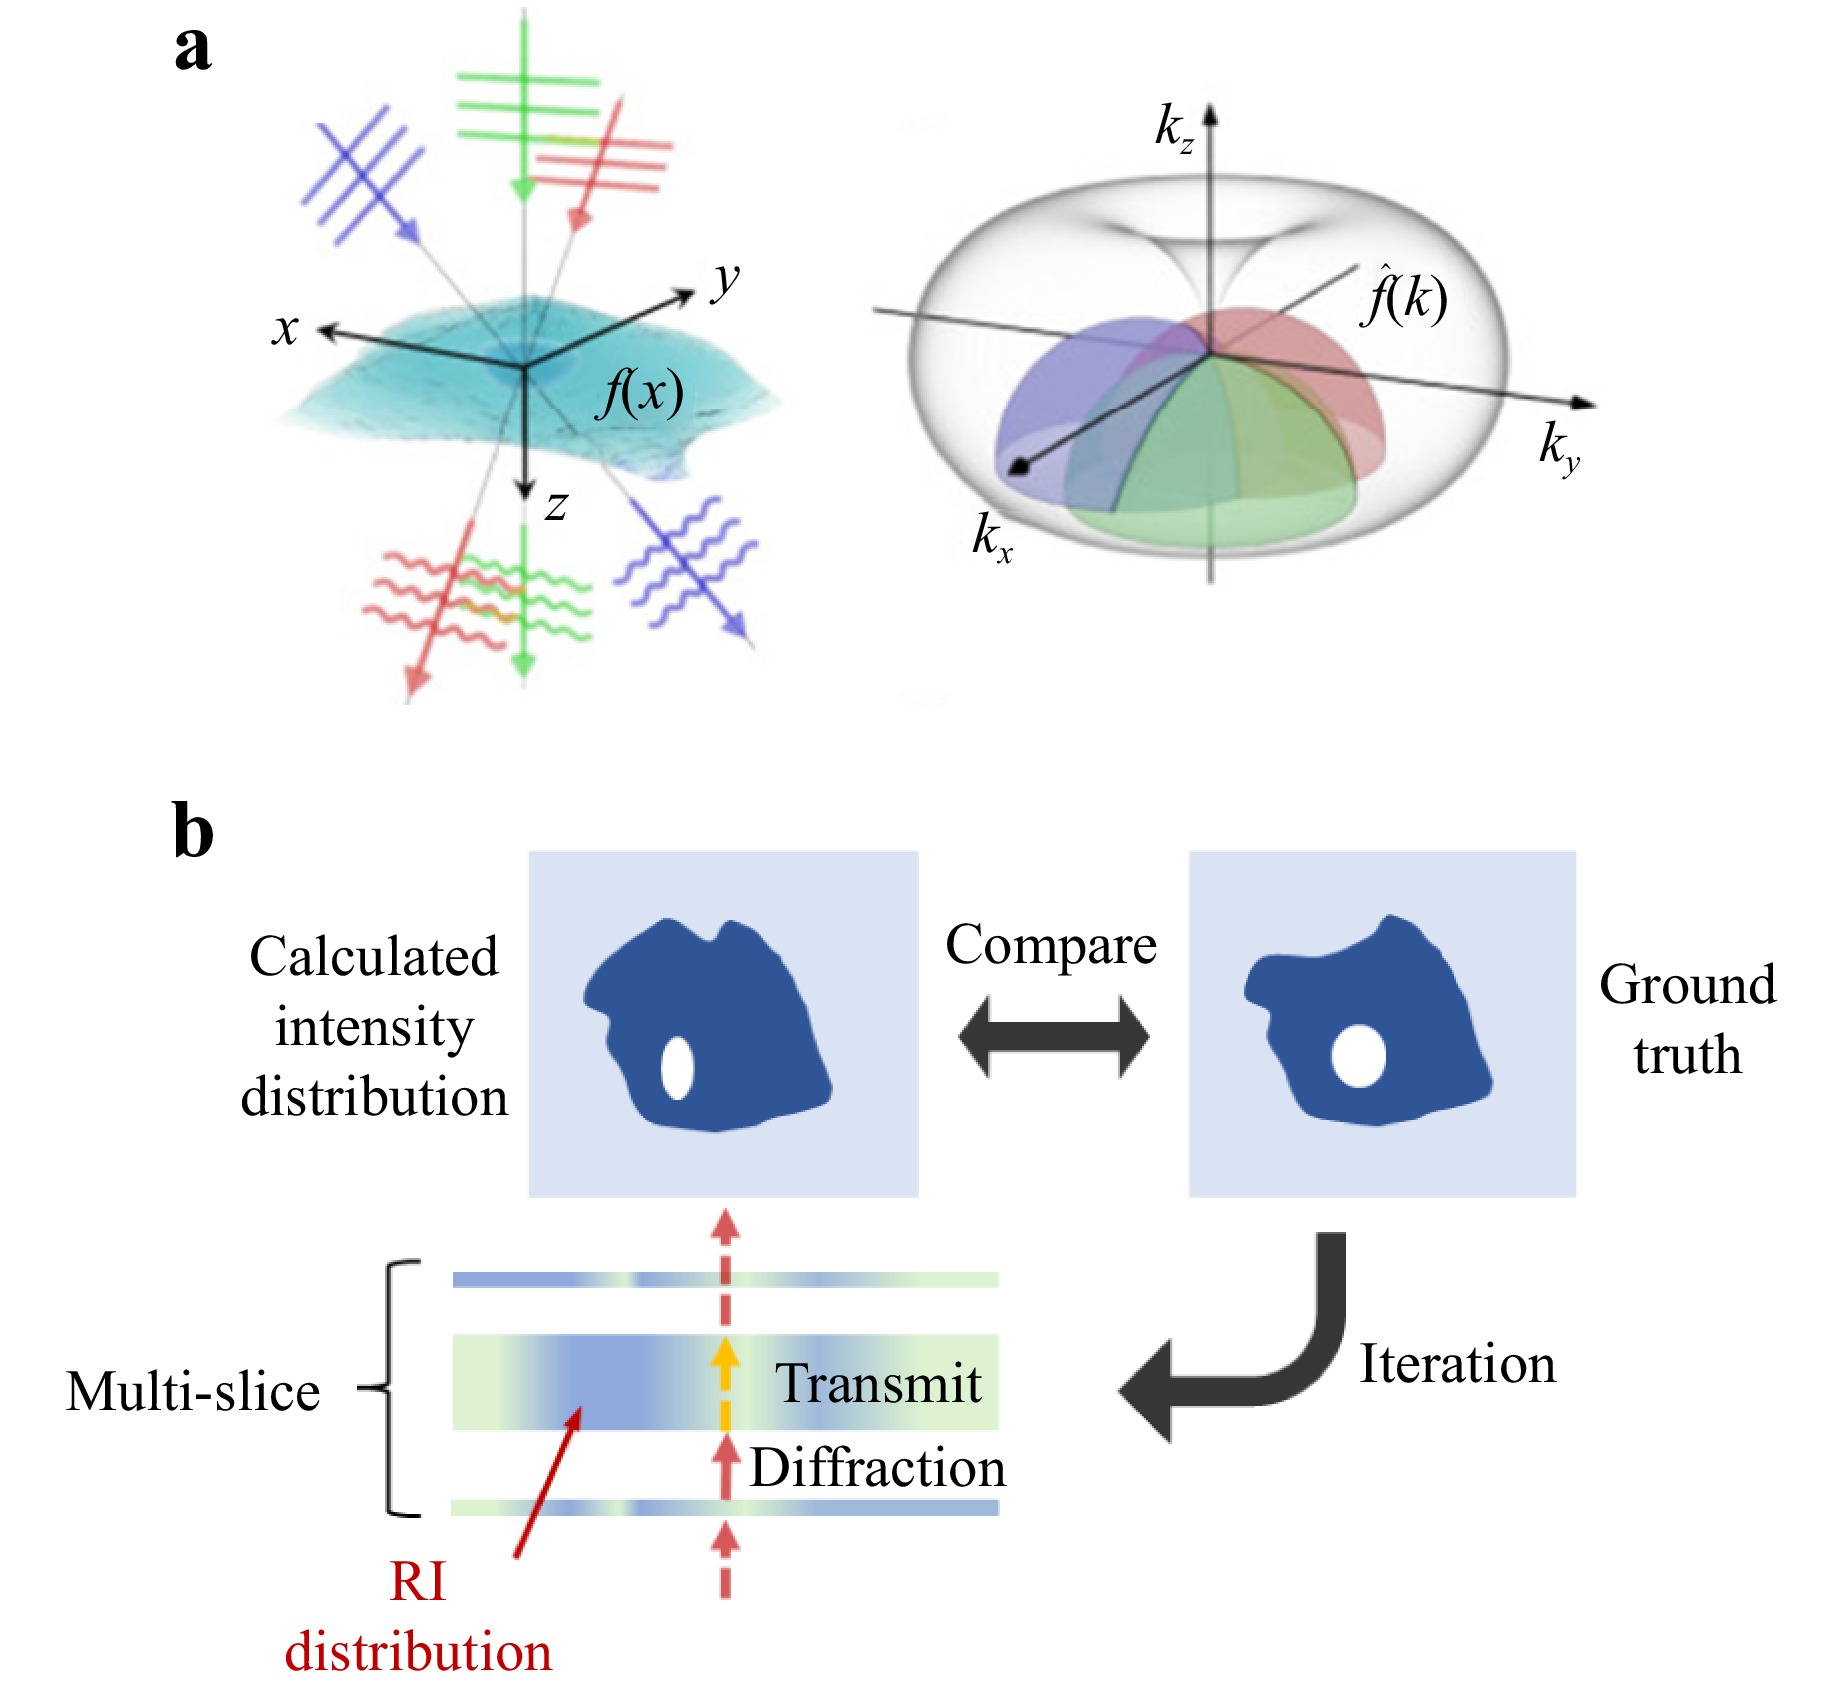
Fig. 15 Typical Fourier ptychography methods for object reconstruction. a A three-dimensional sample is illuminated by plane waves from different directions, each generating a particular semi-spherical surface in the three-dimensional Fourier space. Reproduced with permission158. Copyright 2020, Creative Commons Attribution 4.0 International License. b Schematic of the multi-slice method, which sets the initial RI distribution randomly, then simulates the propagation of light to obtain the intensity distribution. The calculated intensity distribution is compared with the ground truth (captured by camera) to update the RI distribution; this process is iterated until the error between the two intensity distributions falls below the required limit.
Both the TIE and Fourier ptychography methods have shown significant potential for the measurement of transparent objects. However, the accuracy of quantitative phase measurements remains challenging. As a result, efforts to address issues such as the accurate calibration and control of measurement errors remain essential for applying these quantitative phase measurement methods in industrial applications.
-
Spectroscopic measurement methods that utilise the different RIs of different wavelengths of light in the same medium, including the spectral reflectometry and spectral confocal methods, are commonly employed in thin-film inspection systems.
Spectral reflectometry is based on the principle that different wavelengths of light will experience enhancement or attenuation when passing through a film of a certain thickness with a specific RI owing to interference with the light reflected from its upper and lower surfaces. A combination of spectral reflectometry and ellipsometry has become the primary tool used for modern thin-film measurement161–165, as illustrated in Fig. 16.
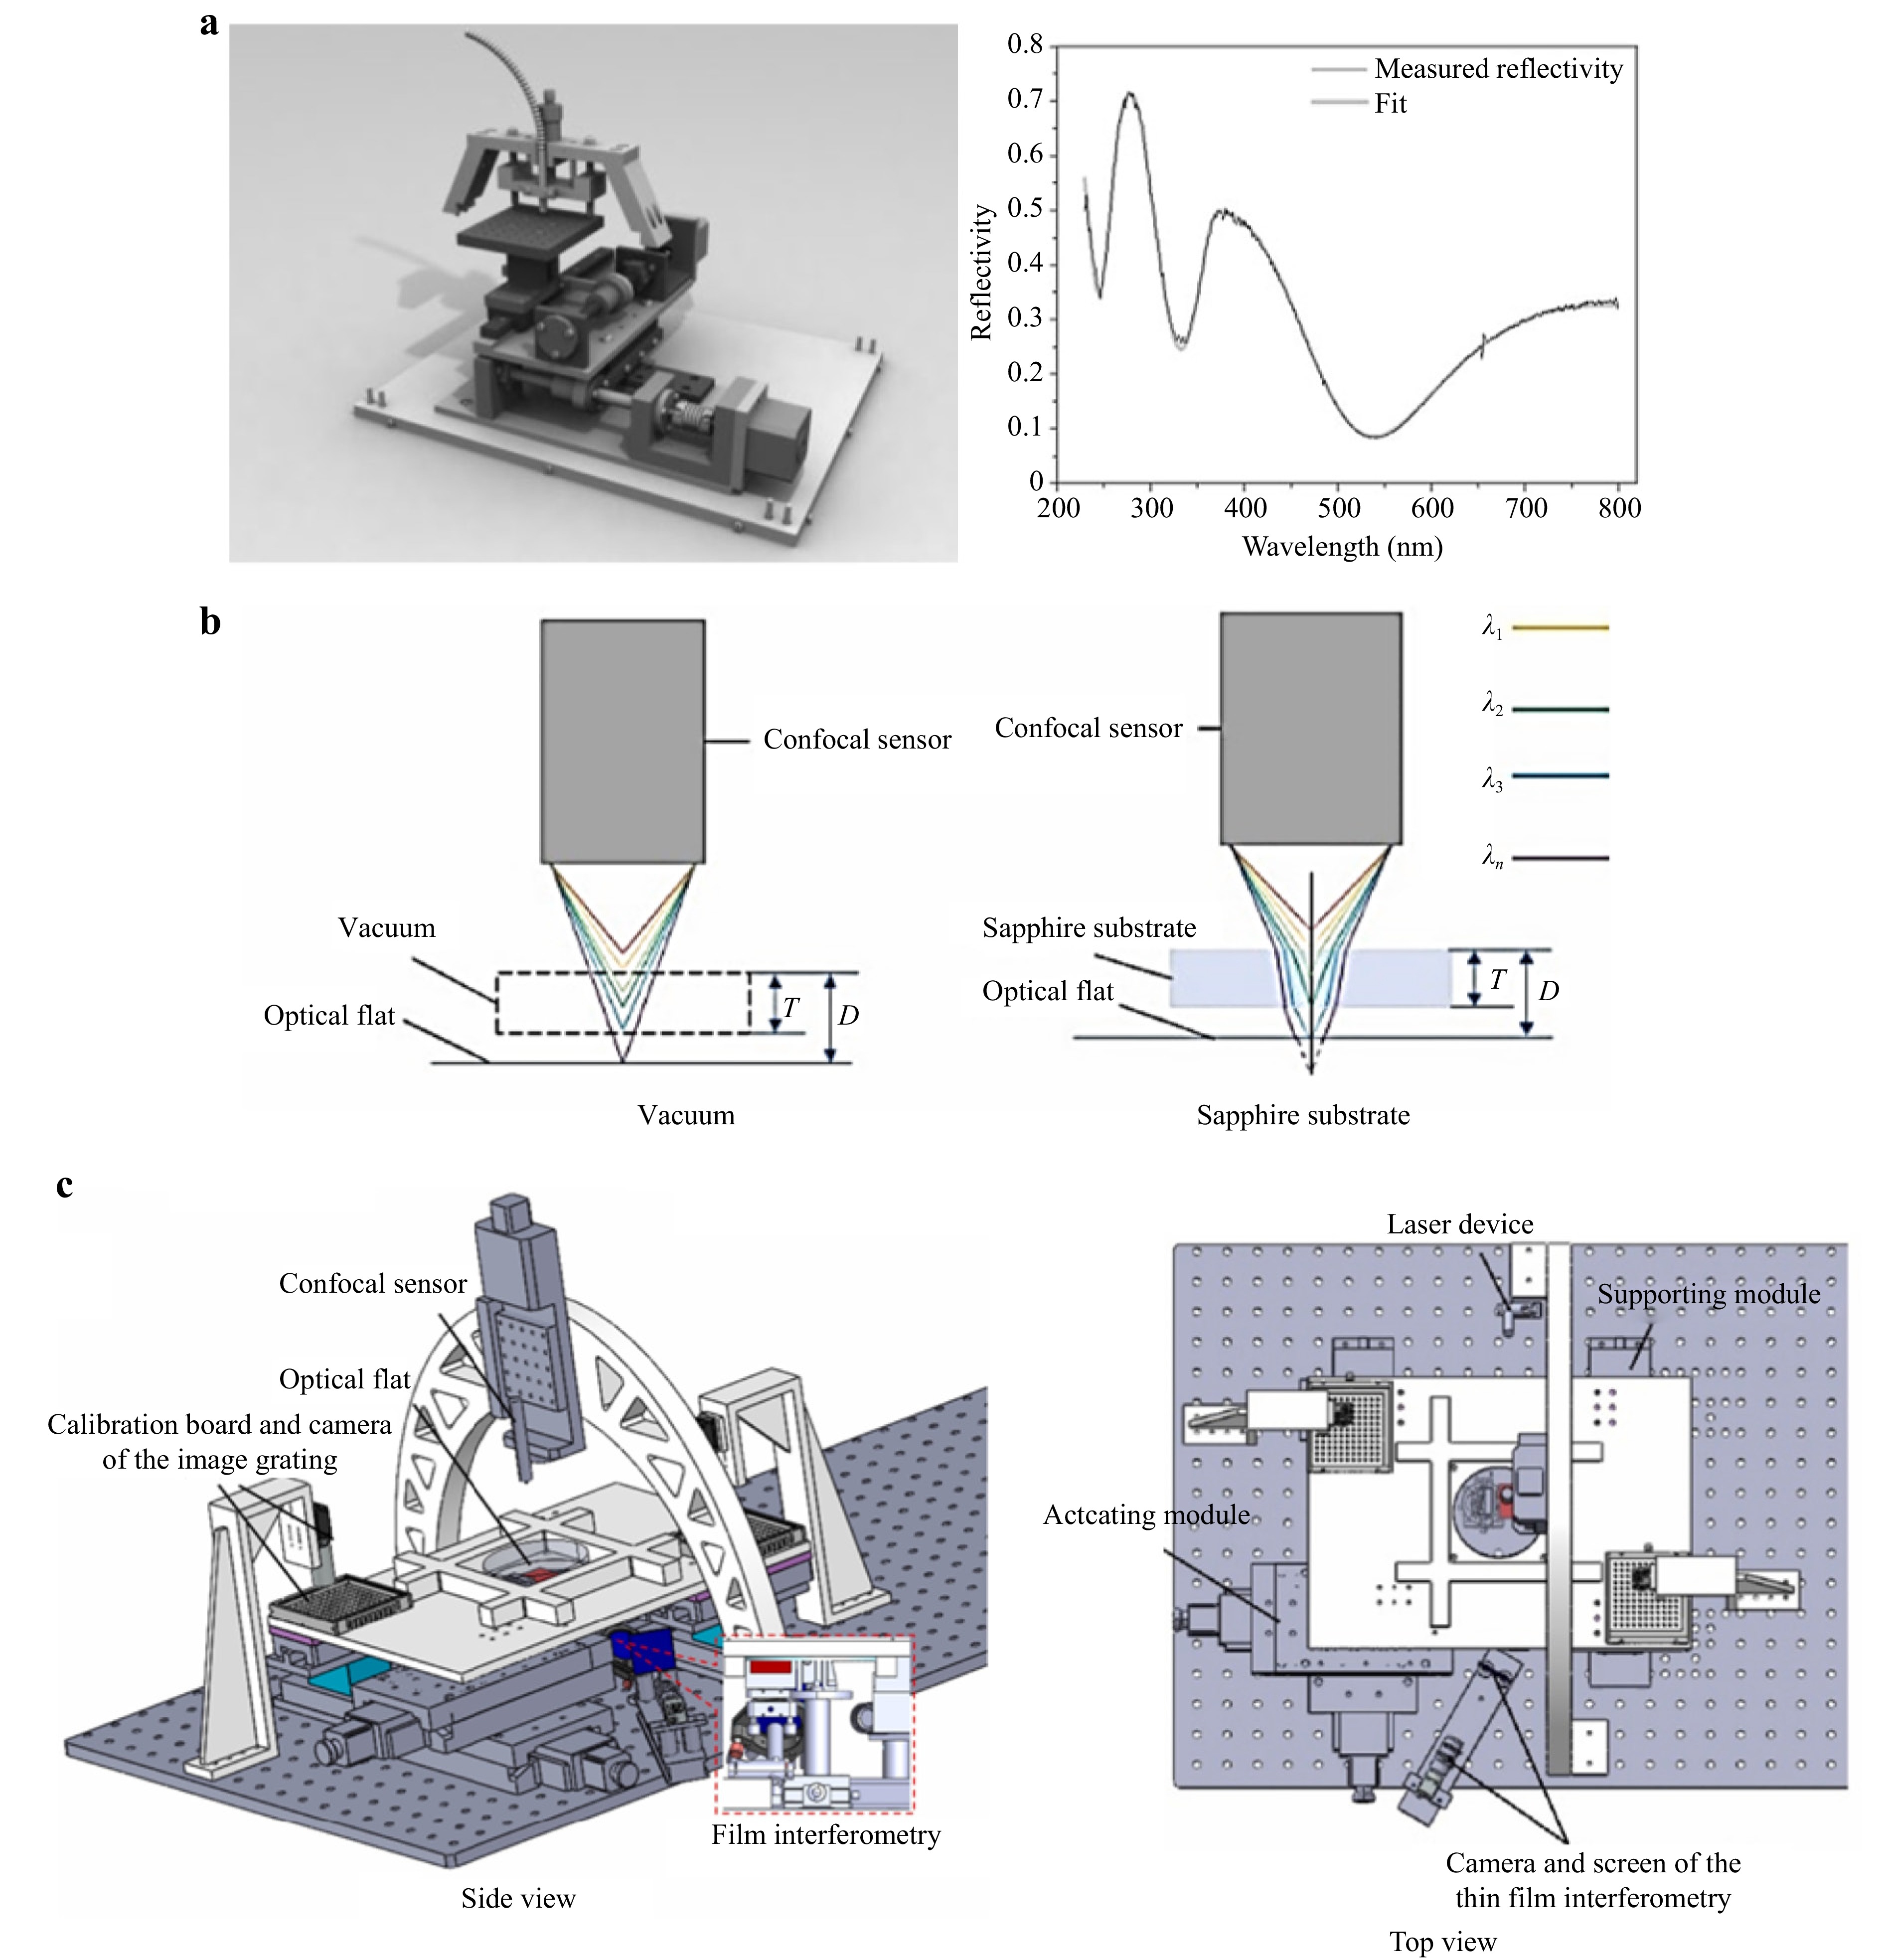
Fig. 16 Spectroscopic and dispersion measurement methods. a Spectral reflectometry used for transparent film inspection, in which the left image depicts the system setup and the right image depicts the relationship between reflectivity and wavelength. The peaks and valleys of the curve can be interpreted to determine the thickness of the film at this position. Reproduced with permission161. Copyright 2004, John Wiley & Sons, Ltd. b and c Using a dispersion confocal sensor to inspect a transparent film, in which b depicts the principle of the dispersion confocal sensor and c depicts the system setup. Reproduced with permission170. Copyright 2023, Elsevier Inc.
The spectral confocal method utilises a lens with significant dispersion to focus different wavelengths of light at different points, with only the light focused on the surface able to pass through the small holes in a conjugate position to be detected using a spectroscope. Thus, the thickness of a transparent film can be determined from the relationship between the wavelength and focal length. This method has been highly successful in engineering measurements in recent years166–170. However, while these spectroscopic measurement methods are well-suited to thin transparent objects, they are unsuitable for thicker objects.
-
General-scale measurement methods typically integrate various macro-scale and micro-scale measurement techniques to enhance measurement capabilities and address existing challenges in these respective measurement methodologies.
-
A wavelength with a low transmittance can be effectively employed to convert measurements of transparent objects into measurements of ordinary diffuse-reflecting objects. This is advantageous because non-destructive optical measurement methods for diffuse-reflecting objects are well-established and mature. As show in Fig.17, different materials exhibit varying spectral transmittance rates171–173, the selection of suitable wavelengths can significantly enhance measurement efficiency. In this vein, Good et al. reported the transmittance rates of different transparent solar concentrators174, and David et al. examined the transmittance rates of photovoltaic encapsulation materials175. These studies not only investigated the photoelectric properties of their subject materials but also detailed conditions for obtaining non-destructive measurements using low-transmittance wavelengths.
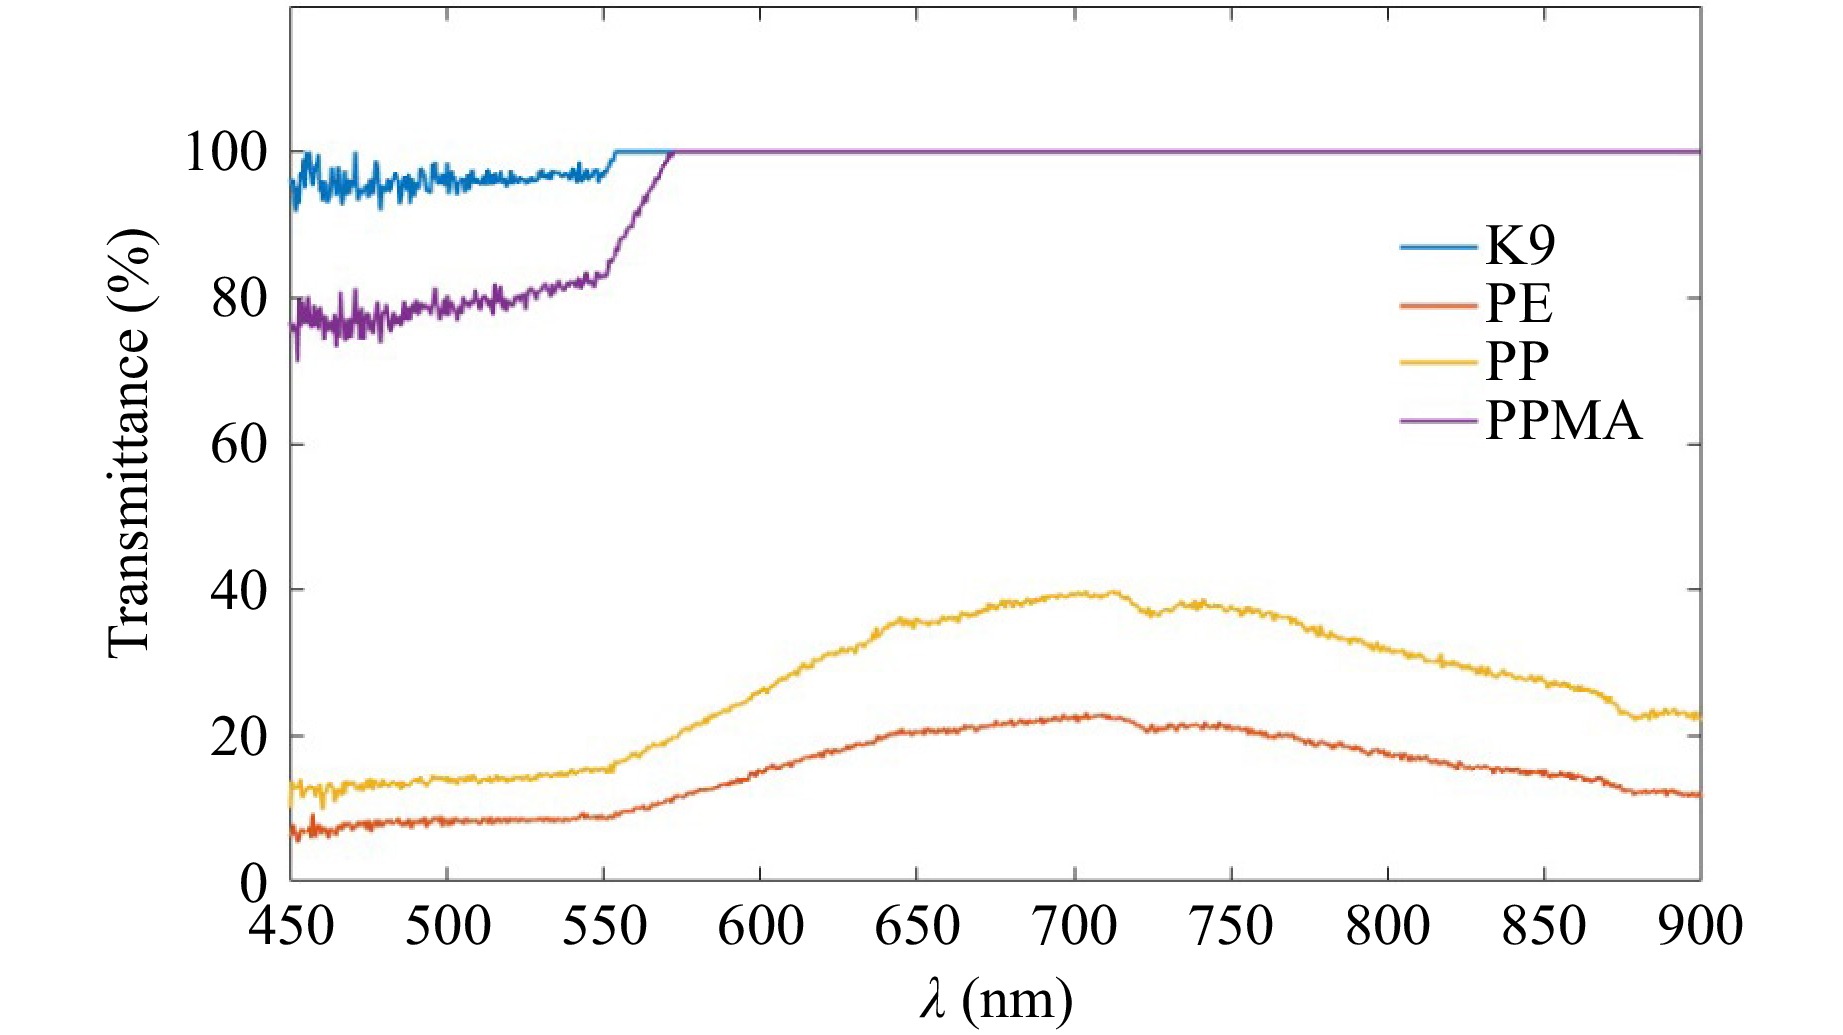
Fig. 17 Transmittance spectrum of typical transparent materials measured by an FX2000 fibre spectrometer (ideaoptics, China) at room temperature. In the legend, K9 denotes an optical material (SiO2 = 69.13%, B2O3 = 10.75%, BaO = 3.07%, Na2O = 10.40%, K2O = 6.29%, As2O3 = 0.36%) with a thickness of 1 mm, PE denotes polyethylene with a thickness of 3 mm, PP denotes polypropylene with a thickness of 1 mm, and PPMA denotes polymethyl methacrylate with a thickness of 2 mm.
Several methods discussed above involve the use of low-transmittance wavelengths40, 74, 89, 176, 177 to transform the complex problem of measuring transparent objects into a simpler problem of measuring diffused reflected objects; this facilitates the utilisation of various mature measurement techniques. Therefore, the use of low-transmittance wavelengths is advisable when addressing specific measurement problems because leveraging mature measurement methods can save time and resources.
-
Polarisation represents another dimension of light that plays a critical role in various fields. The integration of polarisation information into other measurement methods can enhance the overall performance of the approach. Polarisation characteristics are commonly used to obtain the normal vectors of the surface microelements of an object or to determine the properties of the object directly; both approaches are described in the discussion of polarisation theory below. In addition, there have been many promising advances in the acquisition and processing of polarisation data; these advances are also described in this section.
-
Transparent object measurement methods using polarisation can be generally divided into two categories: those that use polarisation to obtain normal surface vectors for reconstructing an object’s three-dimensional structure and those that directly analyse the relationship between the polarisation and surface properties of a material to extract the relevant information.
The normal vector can be obtained by describing the interaction of light with the surface of a transparent object using Fresnel’s law, which establishes a close relationship between the direction of the normal surface vector and the polarisation characteristics of the outgoing light178–180. The existence of a unique relationship between the three-dimensional contour of a transparent surface and its normal vector allows the former to be reconstructed using the latter obtained from the polarisation information181–184.
Wolff and Boult presented a theory on the polarisation properties of reflected light that respectively expresses the polarisation of specular reflected light and diffusely reflected light as follows182:
$$ {\rho }_{s}=\frac{2{\mathrm{sin}}^{2}{\theta }_{i}\cos{\theta }_{i}\sqrt{{n}^{2}-{\mathrm{sin}}^{2}{\theta }_{i}}}{{n}^{2}-{\mathrm{sin}}^{2}{\theta }_{l}-{n}^{2}{\mathrm{sin}}^{2}{\theta }_{l}+2{\mathrm{sin}}^{4}{\theta }_{l}} $$ (2) $$ {\rho }_{d}=\frac{{\left(n-\dfrac{1}{n}\right)}^{2}{\mathrm{sin}}^{2}{\theta }_{i}}{2+2{n}^{2}-{\left(n+\dfrac{1}{n}\right)}^{2}{\mathrm{sin}}^{2}{\theta }_{i}+4\mathrm{cos}{\theta }_{i}\sqrt{{n}^{2}-{\mathrm{sin}}^{2}{\theta }_{i}}} $$ (3) where $ n $ is the RI of the medium and $ {\theta }_{i} $ is the incident angle of the light. Eqs. 2, 3 indicate that the polarisation of diffusely reflected light is monotonic with the incident angle, whereas the polarisation of specular reflected light is not as shown in Fig. 18. Thus, reconstructing an object using the polarisation of specular reflected light requires resolution of this ambiguity.
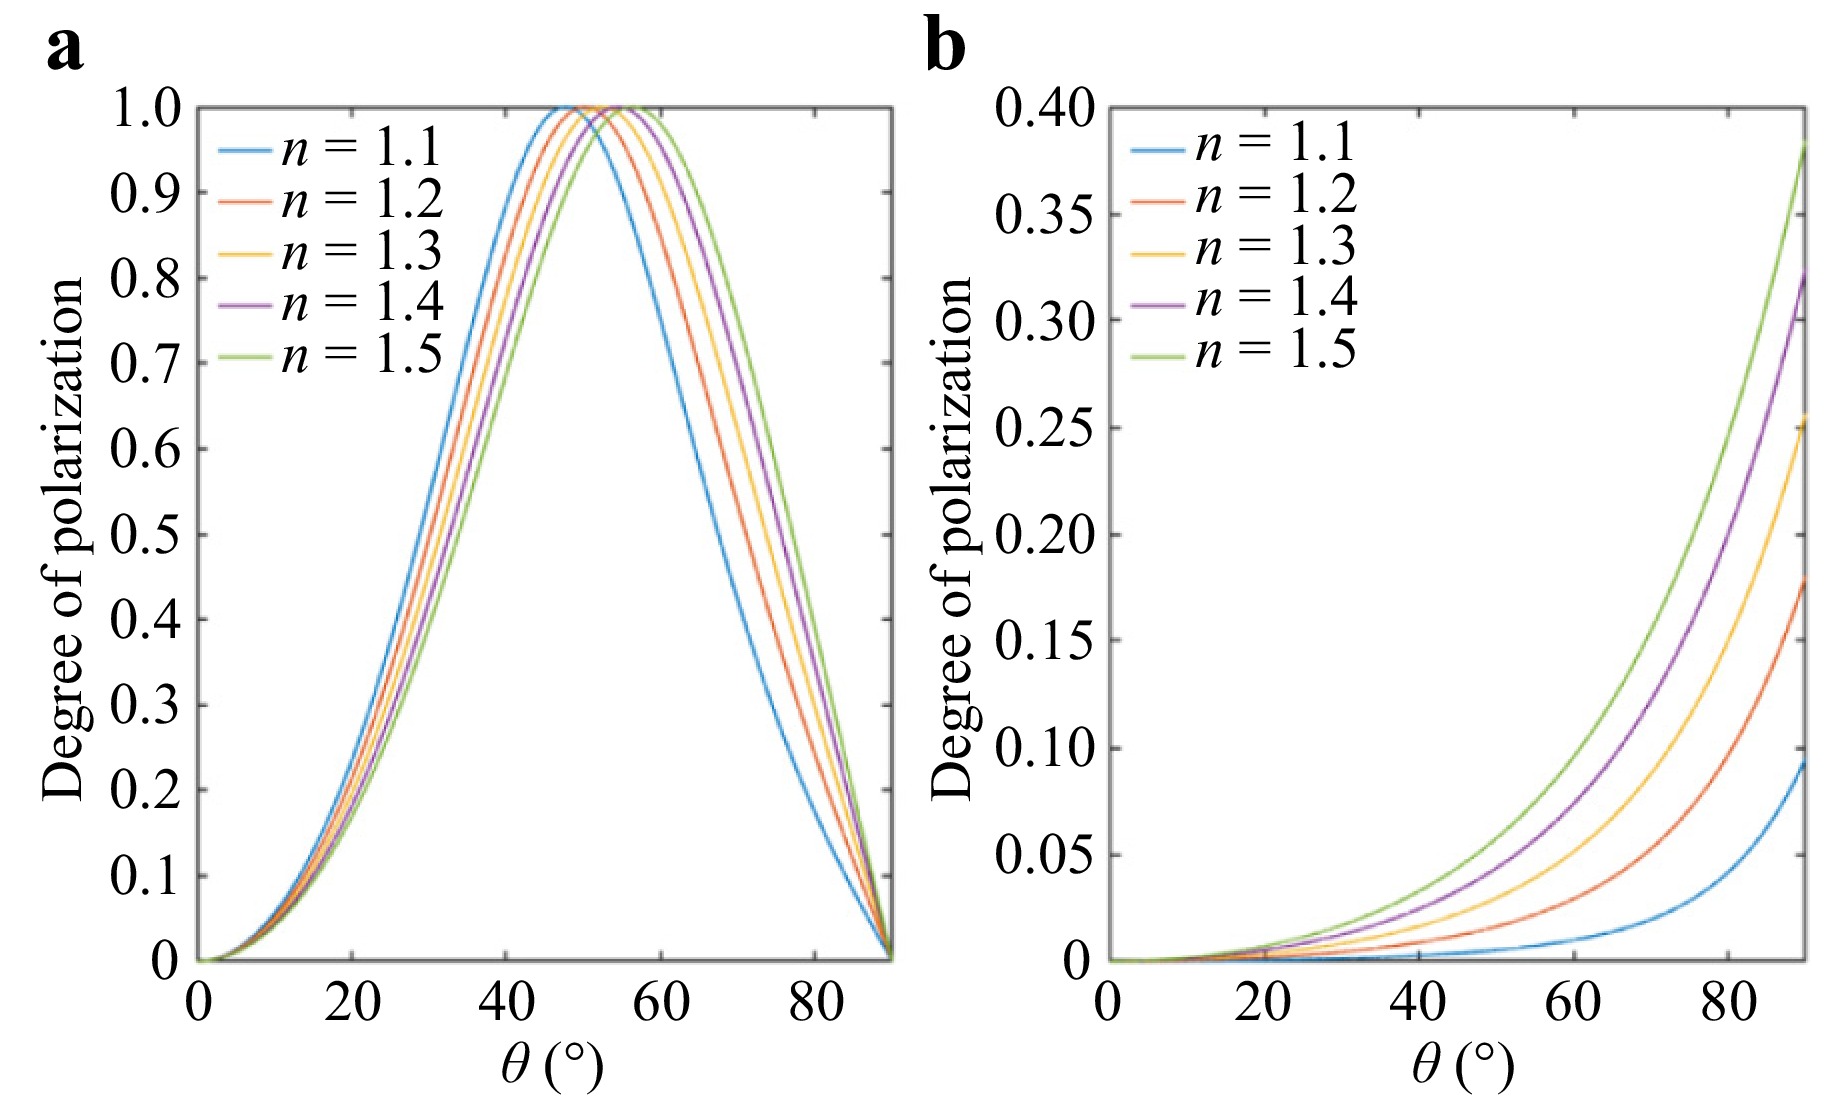
Fig. 18 Relationship between incident angle and degree of polarisation according to RI for: a specular light and b diffused light.
Researchers have proposed various solutions for addressing the angular ambiguity of normal vectors. Miyazaki et al. introduced a rotating target method185,186 that eliminates the need for a specific angle of rotation and avoids errors in system calibration; however, it requires multiple target measurements from different angles, which results in a complicated and time-consuming measurement process. In 2007, Miyazaki and Ikeuchi utilised the Mueller matrix to describe polarised light, thereby removing ambiguities while iteratively solving for the surface morphology187. Subsequently, multiple viewing angles have been employed to resolve ambiguity178,188, and the use of light-field cameras for rapid image acquisition with multiple viewing angles has been proposed189–192.
The absence of angular ambiguity between diffuse light polarisation and the normal vector has led researchers to concentrate on separating out the diffused reflected light for three-dimensional reconstruction179,184,190,193−195. However, the diffuse light reflected off a transparent object is weak, posing challenges for measuring its polarisation properties. Instead, the ambiguity of the normal vector can be addressed by leveraging the different RIs of various wavelengths of light. Keikhosravi et al. achieved real-time detection of collagen fibres using multi-wavelength polarisation microscopy196, which can also be combined with other acquisition methods to improve the measurement results197,198.
The use of Stokes vectors and Mueller matrices183,199 to describe polarisation represents an effective approach for the direct measurement of transparent objects based on their polarisation properties. Indeed, analysing the properties of the Stokes vectors and Mueller matrices to determine object polarisation properties is feasible. In 2019, Wu et al. used Mueller matrices to distinguish between optical surface digs and dust by combining polarisation data with dark-field imaging200, showcasing the potential of such dark-field polarisation systems for defect detection. Wei et al. used transmitted polarised structured light to classify and remove dust from optical devices, thereby mitigating its effects201. Moreover, haze, which comprises a multitude of dust, smoke and other dry particulates, is akin to the structures embedded in transparent objects and exhibits complex refraction and reflection phenomena. Liang et al. dehazed images using polarised light, realising a model that is potentially applicable to the inspection of transparent objects, particularly those with multiple microstructures, such as microbubbles202,203. Ellipsometry is an effective tool for thin-film measurements and has been used to analyse the polarisation intensity in two orthogonal directions. Dual-wavelength204 and multiple-wavelength205–211 measurements have expanded the utility of ellipsometry. As the application of Stokes vectors and Mueller matrices to describe polarised light effectively utilises the information conveyed by light polarisation, further research on the use of Mueller matrices to capture multiple light refractions and reflections represents a promising direction for future research.
The polarisation properties of reflected and refracted light can also be analysed to characterise the properties of an object. In 2017, Kim and Ghosh used polarisation to measure the optical properties of transparent liquids212, and Zhang et al. later employed circularly polarised light to measure the RI of metals213—a method that can be effectively adapted for use in transparent materials. In 2022, Fuentes-Domínguez et al. introduced a method for measuring nanostructures in transparent liquids by analysing the different acoustic responses of various nanostructures to differently polarised light; as shown in Fig. 19, this method can measure parameters such as shape, size, and position214, and is anticipated to be applicable to the measurement of micro-scale or nano-scale defects in other transparent objects.
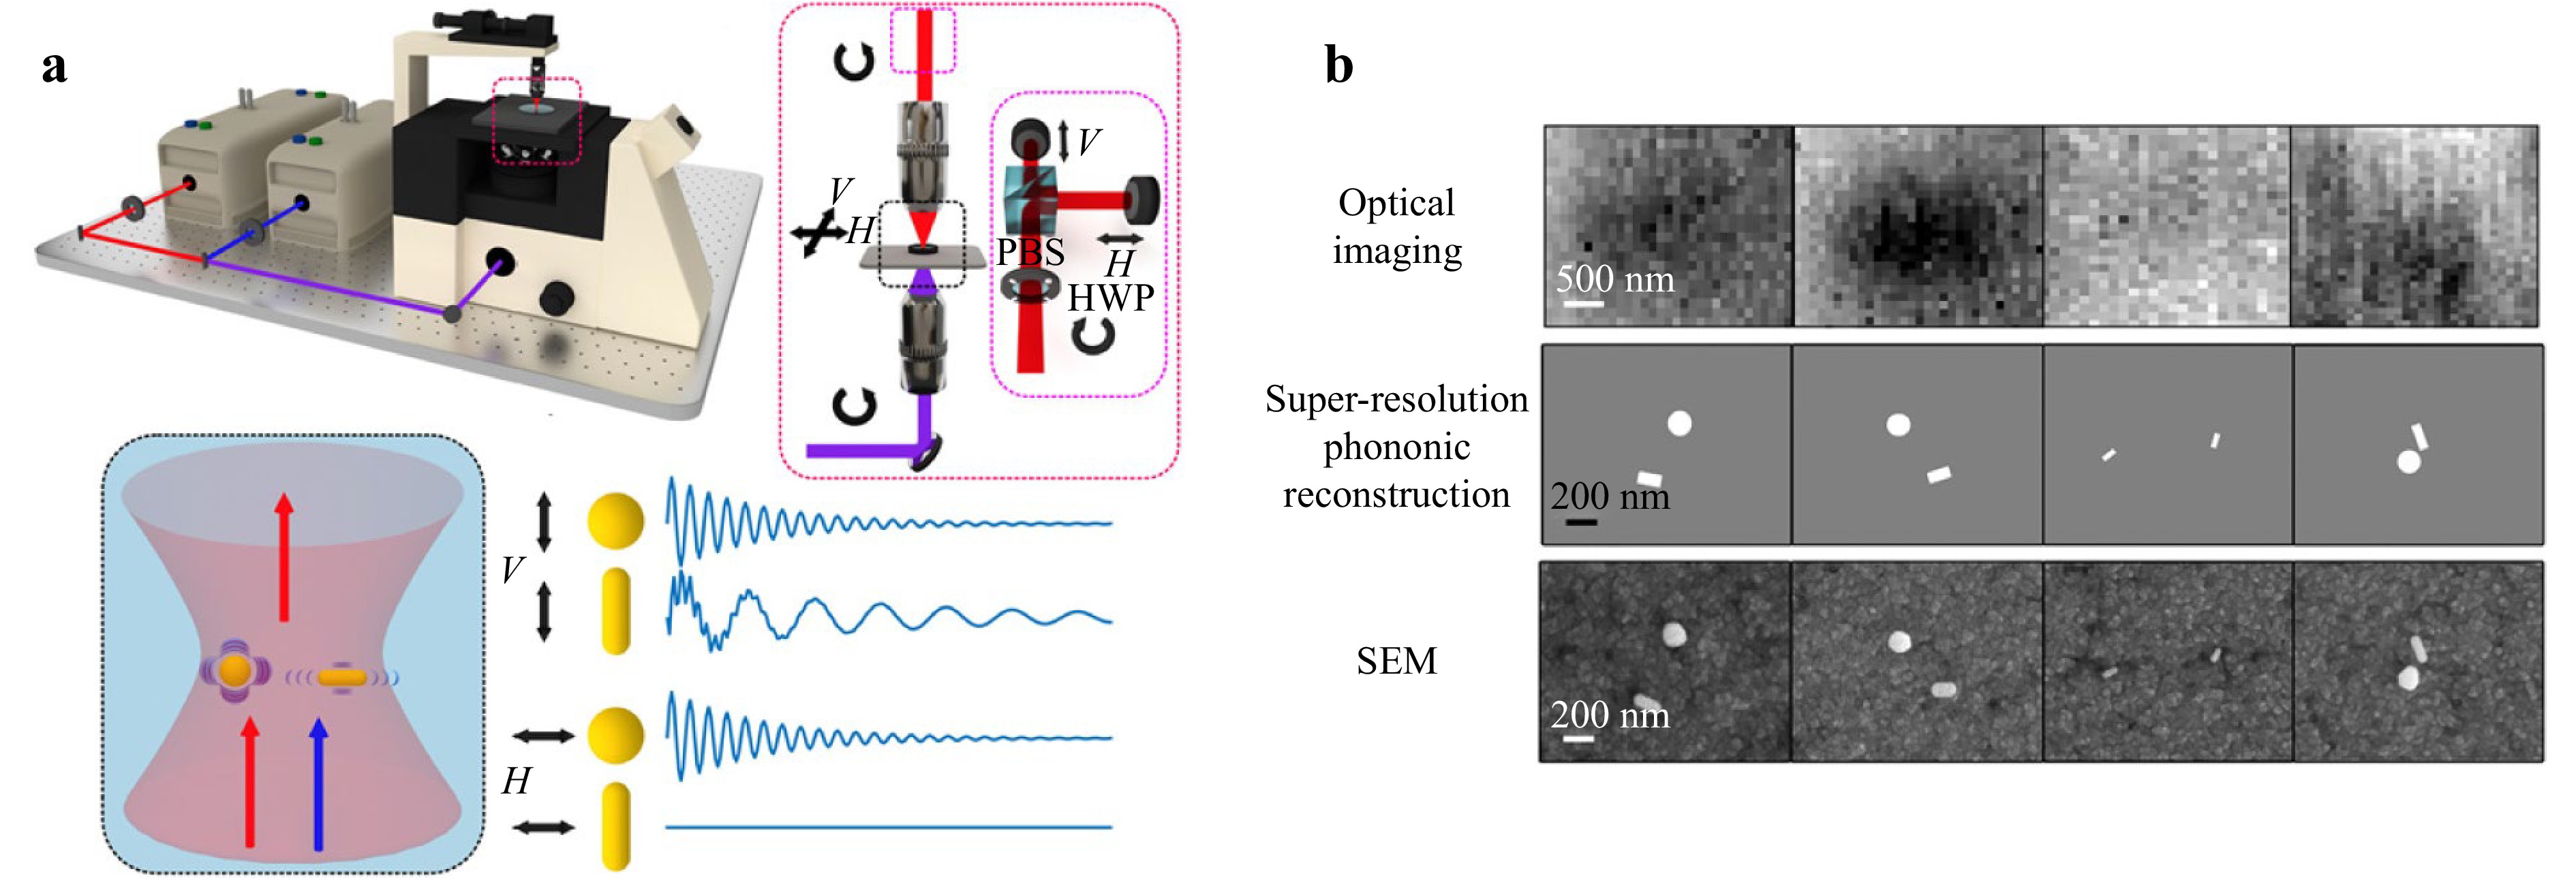
Fig. 19 Reconstruction of nanostructures using polarised light. Reproduced with permission214. Copyright 2022, Creative Commons Attribution 4.0 International License. a System setup and acoustic responses of different nanostructures to differently polarised light. b Reconstruction results of different areas via super-resolution phononic reconstruction and scanning electron microscopy.
Furthermore, polarisation can be applied to enhance lower transmittance wavelengths, such as infrared or UV, and thereby improve inspection efficiency. This represents a special type of direct extrapolation that relies on polarisation properties. Kadambi et al. enhanced infrared time-of-flight measurement results using normal polarisation vectors215,216, and Liang et al. enhanced short-wave infrared images using visible light polarisation images176. The latter method considered the continuity of the image pixels to solve problems associated with the low resolution of infrared images; this approach may be significant for the improvement of measurements at other wavelengths with low sensing resolutions.
-
Researchers have explored various methods for accelerating polarisation information acquisition speed and processing accuracy. One key challenge is dealing with the ambiguity of the specular reflected light, which requires obtaining four-angle maps. Traditional methods for doing so involve rotating the polariser; however, new approaches have emerged. Xin et al. accelerated the acquisition of multi-view and multi-angle polarisation images by fabricating adjustable polarisers and microlens arrays, known as twisted nematic liquid-crystal microlens arrays (TN-LCMLAs), using liquid crystals191 (see Fig. 20 for details). Methods have also been developed for the acquisition of four-angle linear polarisation images in a single shot by incorporating etched four-quadrant micro-polarisers in front of camera pixel units196,217. Furthermore, Rubin et al. designed a metasurface with a distributed birefringent medium to measure the full Stokes vector of light218.

Fig. 20 Special polarisation acquisition methods. a Structure of the TN-LCMLA, in which the upper structure is without external bias voltage and the polarisation state of the liquid crystal below changes when a bias voltage is provided. Reproduced with permission191. Copyright 2018, Optica Publishing Group. b Structure of the “super-pixel”: four-quadrant micro-polariser in front of camera pixel units. Reproduced with permission217. Copyright 2015, Optica Publishing Group.
Recent advances in data processing capabilities have led to the integration of novel data processing and machine vision methods, such as deep learning and event cameras, with polarimetric measurement methods. Shao et al. applied deep learning to monocular image measurements of transparent objects by incorporating physics-based prior input images and prior confidence inputs based on Fresnel’s law, thereby increasing the neural network credibility and reconstruction speed219. This approach demonstrates the potential of applying deep learning to reconstruct normal surface vectors using polarisation information. Furthermore, Muglikar et al. used a rotating line polariser and event camera to address the trade-off between the lack of polarisation angle and time-consumption220. This idea can be applied to most methods that employ four-angle linear polarisation reconstruction to improve their accuracy without sacrificing inspection speed.
-
This section clarifies the relationship between the measurement target and resolution requirements to assist readers in selecting an appropriate measurement method. Additionally, an analysis of the advantages and disadvantages associated with various methods is provided to facilitate effective evaluation of their strengths in different applications.
-
Various transparent object measurement methods were discussed in the previous sections. This section elucidates the relationship between the measurement target characteristics and resolution requirements to assist readers in selecting the appropriate measurement method. In addition, the advantages and disadvantages of the various methods are presented to facilitate their optimal application.
Resolution is a crucial consideration in any measurement task because different measurement targets require different levels of accuracy. Here, resolution refers to the ability to obtain the smallest true value, which is distinct from precision (a lower chance of error) and accuracy (a lower systematic error). Achieving a suitable resolution is vital because an insufficient resolution can make the measurement task challenging, whereas an excessive resolution can waste resources and reduce efficiency, especially in manufacturing applications. Several typical measurement types, their target transparent objects, and associated measurement requirements are described in this section.
Pose and position measurement: This type of measurement is widely required in robotics vision tasks, such as automated driving and industrial robotics, which often necessitate resolutions on the centimetre and millimetre scales. These applications typically prioritise speed and efficiency over resolution owing to the need for a rapid response.
Defect measurement: This type of measurement includes the observation of surface and embedded defects and focuses on detection rather than dimensional measurement. Thus, the required resolution is determined according to the general scale of the defects.
Shape and surface geometry measurement: This is a common type of measurement that provides geometric parameters, such as surface profile and flatness. The required resolution depends on the application scenario; for example, measuring a general lens may require micron-level resolution, whereas measuring a reference mirror in an interferometer may require resolutions in the range of tens to hundreds of nanometres.
Three-dimensional structure measurement: This type of measurement captures the thickness of films, embedded structures, biological targets, etc. Film thickness measurement typically requires achieving the appropriate wavelength class (approximately one quarter or one half the wavelength of visible light), whereas biological measurements require only micron-scale resolution. Speed must also be considered in biological measurements because of phototoxicity and its effects on cellular activity.
-
Each non-destructive measurement method described in this review has its own scope of application, and the selection of an appropriate method considering its relevant advantages and disadvantages will ensure efficient and accurate measurements.
Macroscale measurement methods are suitable for centimetre- and millimetre-scale measurements, offering rapid but low-resolution results that are ideal for real-time applications. Machine vision is cost-effective but requires extensive computing resources. Structured light improves upon machine vision but has disadvantages such as the increased time cost and complexity associated with active light sources. Photothermal methods bypass light refraction and reflection but may cause microstructural damage owing to excessive local temperature.
Micro-scale measurement methods target micron- and nanometre-scale measurements, often using interference methods to amplify differences. Traditional interference methods face challenges such as high coherent noise, environmental requirements, and cost. Digital holography offers high accuracy and wide application potential but has problems similar to those associated with traditional interferometry. Non-interference methods have low resolution and some uncertainty in their results but are widely applicable for small-scale measurements. Spectroscopy and dispersion methods are widely used for film inspection; however, they cannot yet measure thicker objects.
General-scale measurement methods can be combined with other methods to realise transferability but may not maximise the target’s characteristics, leading to suboptimal results. Polarisation measurement methods offer the broadest possibilities when combined with other methods.
Thus, each method has its strengths and limitations, and the selection of the correct method depends on the specific measurement requirements and characteristics of the object being measured.
Method Measurement scale Speed Environmental limitations Cost Measurement target flexibility Machine vision Macro +++ +/++ + +++ Structured light Macro ++ + + +++ Photothermal Macro + +++ +++ + Interference methods Micro ++ +++ +++ +/++ Non-interference methods Micro + ++ +/++ +/++ Spectroscopy and dispersion Micro + ++ +++ + Low transmitted wavelength General Depends on situation + +++ +++ Polarisation General Depends on situation + + +++ Note: +, ++, and +++ represent the performance or demand in this field from lowest to highest. Table 1. Advantages and disadvantages of each method considered in this review.
-
Methods for the non-destructive optical measurement of transparent objects are highly desirable. This review categorised these measurement methods according to their function on the macro-, micro-, and general scales. Several promising directions for the future development of such methods are outlined below based on the reviewed information.
Multi-method fusion: Combining multiple measurement methods represents a tremendously promising approach as individual measurement techniques often have specific limitations associated with trade-offs between measurement resolution and speed. However, industries such as semiconductor manufacturing require both high resolution and speed. The thoughtful fusion of measurement methods can compensate for the shortcomings of each individual method, thereby opening new possibilities for measurement.
Quantitative phase measurement techniques: Whether interferometric or non-interferometric, quantitative phase measurement techniques are well-suited to the measurement of transparent objects. Future progress in this field is expected with the ongoing development of new technologies.
Multiple data post-processing techniques: The rapid development of machine and deep learning methods has provided opportunities for improving data post-processing capabilities. These methods can be used to improve both the measurement rate and resolution. Future research should focus on better utilising available computational data in such techniques.
Measurement and manufacturing are complementary processes, with advances in one driving progress in the other. Thus, the development of non-destructive technologies for measuring transparent objects will continue to expand in practical and industrial applications, promote the use of transparent components, and accelerate developments in optics and related fields.
-
This work was partially supported by the Shanghai Science and Technology Committee Innovation Grant (23ZR1404200) and National Natural Science Foundation of China (52075100, 52375414).
Non-destructive optical measurement of transparent objects: a review
- Light: Advanced Manufacturing , Article number: (2025)
- Received: 02 April 2024
- Revised: 14 February 2025
- Accepted: 18 February 2025 Published online: 11 April 2025
doi: https://doi.org/10.37188/lam.2025.022
Abstract: Transparent objects are widely used in various fields, leading to increasing demand for methods of measuring them. However, the measurement of such objects has always been challenging owing to the intricate refraction and reflection phenomena they exhibit. Given that traditional contact measurement methods can damage transparent objects, the use of non-destructive measurement techniques, particularly those based on optical principles, is considered preferable. As a result, various non-destructive measurement methods have been developed for transparent objects by leveraging the unique characteristics of light, and a comprehensive review is imperative for exploring these innovative methods and their potential applications. This review accordingly begins by elucidating the necessity of measuring transparent objects and exploring the concept of transparency. Next, an overview of various non-destructive optical measurement techniques spanning macro-, micro-, and general-scale applications is presented, followed by a discussion of their respective advantages and limitations. Finally, the paper concludes by outlining future directions for potential advancements in the field. This review is expected to serve as a valuable resource for newcomers in the field of transparent object measurement and assist researchers seeking to integrate these techniques into interdisciplinary studies.
Research Summary
Non-destructive Optical Measurement of Transparent Objects: A Review
Transparent objects are widely used in various fields, leading to increasing demand for the corresponding measurement technologies. However, the measurement of such objects has always been challenging owing to the intricate refraction and reflection phenomena they exhibit. Given that traditional contact measurement methods will damage the surface of the samples, the use of non-destructive optical measurement techniques is considered preferable. As a result, various non-destructive measurement methods have been developed for transparent objects, leveraging the unique characteristics of light and opening new possibilities for diverse applications. A comprehensive review of non-destructive measurement methods for transparent objects has been provided by Prof. Lingbao Kong’s team from Shanghai Engineering Research Center of Ultra-precision Optical Manufacturing of Fudan University. The review presents applications spanning macro-, micro-, and general-scale, discussing their respective advantages and limitations, and concludes by outlining future directions for potential advancements in the field.
Rights and permissions
Open Access This article is licensed under a Creative Commons Attribution 4.0 International License, which permits use, sharing, adaptation, distribution and reproduction in any medium or format, as long as you give appropriate credit to the original author(s) and the source, provide a link to the Creative Commons license, and indicate if changes were made. The images or other third party material in this article are included in the article′s Creative Commons license, unless indicated otherwise in a credit line to the material. If material is not included in the article′s Creative Commons license and your intended use is not permitted by statutory regulation or exceeds the permitted use, you will need to obtain permission directly from the copyright holder. To view a copy of this license, visit http://creativecommons.org/licenses/by/4.0/.

 DownLoad: