


-
Large-aperture aspheric mirrors are the core ultraprecision components of telescope systems, such as the well-known Hubble Space Telescope, James Webb Space Telescope, and China Space Station Telescope, all of which have primary mirror apertures that exceed 2 m1–3. The surface shapes of their mirrors require nanoscale accuracy to ensure ideal imaging performance of these telescope systems4. However, manufacturing large apertures with such high surface shape accuracy is a significant challenge for surface shape testing technology5–7. Currently, computer-generated hologram (CGH) interferometry is a unique high-accuracy surface shape testing method suitable for large-aperture aspheric mirrors, with a measurement accuracy of at least λ/100@λ = 632.8 nm. Since the CGH technique was first applied to aspheric surface shape testing in 1971, the estimation and verification of its measurement accuracy have become major concerns8.
Fabrication error analysis is a method widely used for estimating CGH measurement accuracy. A parametric model based on the scalar diffraction theory was first developed by Chang and Burge to analyze the wavefront sensitivity of binary CGHs to fabrication errors9,10. Zhou investigated methods for measuring CGH fabrication errors to quantify the wavefront errors generated by fabrication errors11. In addition, Cai developed a diffractive optics calibrator that scanned the entire CGH to generate a wavefront phase-error map, which captured variations in the duty cycle and etching depth12,13. Based on the above studies, Zhao conducted a systematic analysis of all the significant sources of error for CGH metrology, including the design, fabrication, intrinsic substrate error, and use of the CGH14. Poleshchuk developed a method that involved prewriting a ruler with special fiducial marks and confirmed the CGH accuracy through position measurements15. In summary, fabrication error analysis relies on a parametric model to indirectly estimate wavefront accuracy; however, its actual measurement accuracy cannot be verified directly.
The accuracy of CGH measurements can be evaluated using spherical wavefront measurement methods. A dual computer-generated hologram can simultaneously generate two different wavefronts, one of which can be designed as a spherical auxiliary wave for calibration via absolute measurements using standard interferometric methods16,17. Burge proposed a fabrication technique for a sphere-calibrated CGH using the same instruments and technology to evaluate the accuracy of a working aspherical CGH18. However, the measurement accuracy of the working CGH cannot be verified directly.
A comparison test is a direct verification method that uses two or more methods to test the same element, and the differences in the measurement results directly reflect the reliability of the measurement accuracy19. A round-robin comparison of freeform measurements was conducted during a European metrology research project to determine the status of the typical freeform measurement capabilities of the optical surfaces of six measuring instruments. The root-mean-square (RMS) values of these differences in the measurement results ranged from 15 to 110 nm (neglecting spherical contributions)20,21. However, a comparison test cannot be used to verify the measurement accuracy of the CGHs used for testing large-aperture (meter-scale) mirrors because of the lack of suitable high-accuracy measurement methods. Null correctors are difficult or impossible to fabricate for certain complex aspheric and freeform mirrors22. In such cases, profilometry is a potentially useful measurement method. However, its application is significantly limited by its measurement range, which disqualifies it as a potential measurement tool for large-aperture (meter-scale) mirrors23,24.
In this study, we developed an efficient methodology for verifying the accuracy of CGHs used for testing large-aperture mirrors. An equivalent element was used instead of a large-aperture mirror to overcome aperture limitations in the comparison test. Specifically, a 281 mm diamond-turned mirror (DTM) was fabricated as the equivalent element of a 3.5 m aspheric mirror and measured using CGH and LUPHOScan profilometers. Surface error composition and RMS density (RMSD) analyses were performed to evaluate the consistency between the two measurement results. The accuracy of the CGH verification methodology was 4 nm (RMS) in the low- to mid-frequency bands, with a measured surface accuracy of approximately 10 nm (RMS). The proposed methodology provides a feasible solution for CGH accuracy verification, ensuring high-accuracy and reliable testing of large-aperture aspheric mirrors.
-
Fig. 1 shows a flowchart of the CGH accuracy verification methodology. The methodology comprised three steps: 1) equivalent element fabrication, 2) a comparison test, and 3) accuracy verification. The testing process began with the design and manufacturing of an equivalent element. The surface shape and geometric parameters of the equivalent element were designed based on the parameters of the tested large-aperture mirror, CGH, and optical testing path. For CGH accuracy verification, the equivalent element should be functionally equivalent to a large-aperture mirror, whereas its aperture should be shrunk into the measurement range of the comparison test instruments.
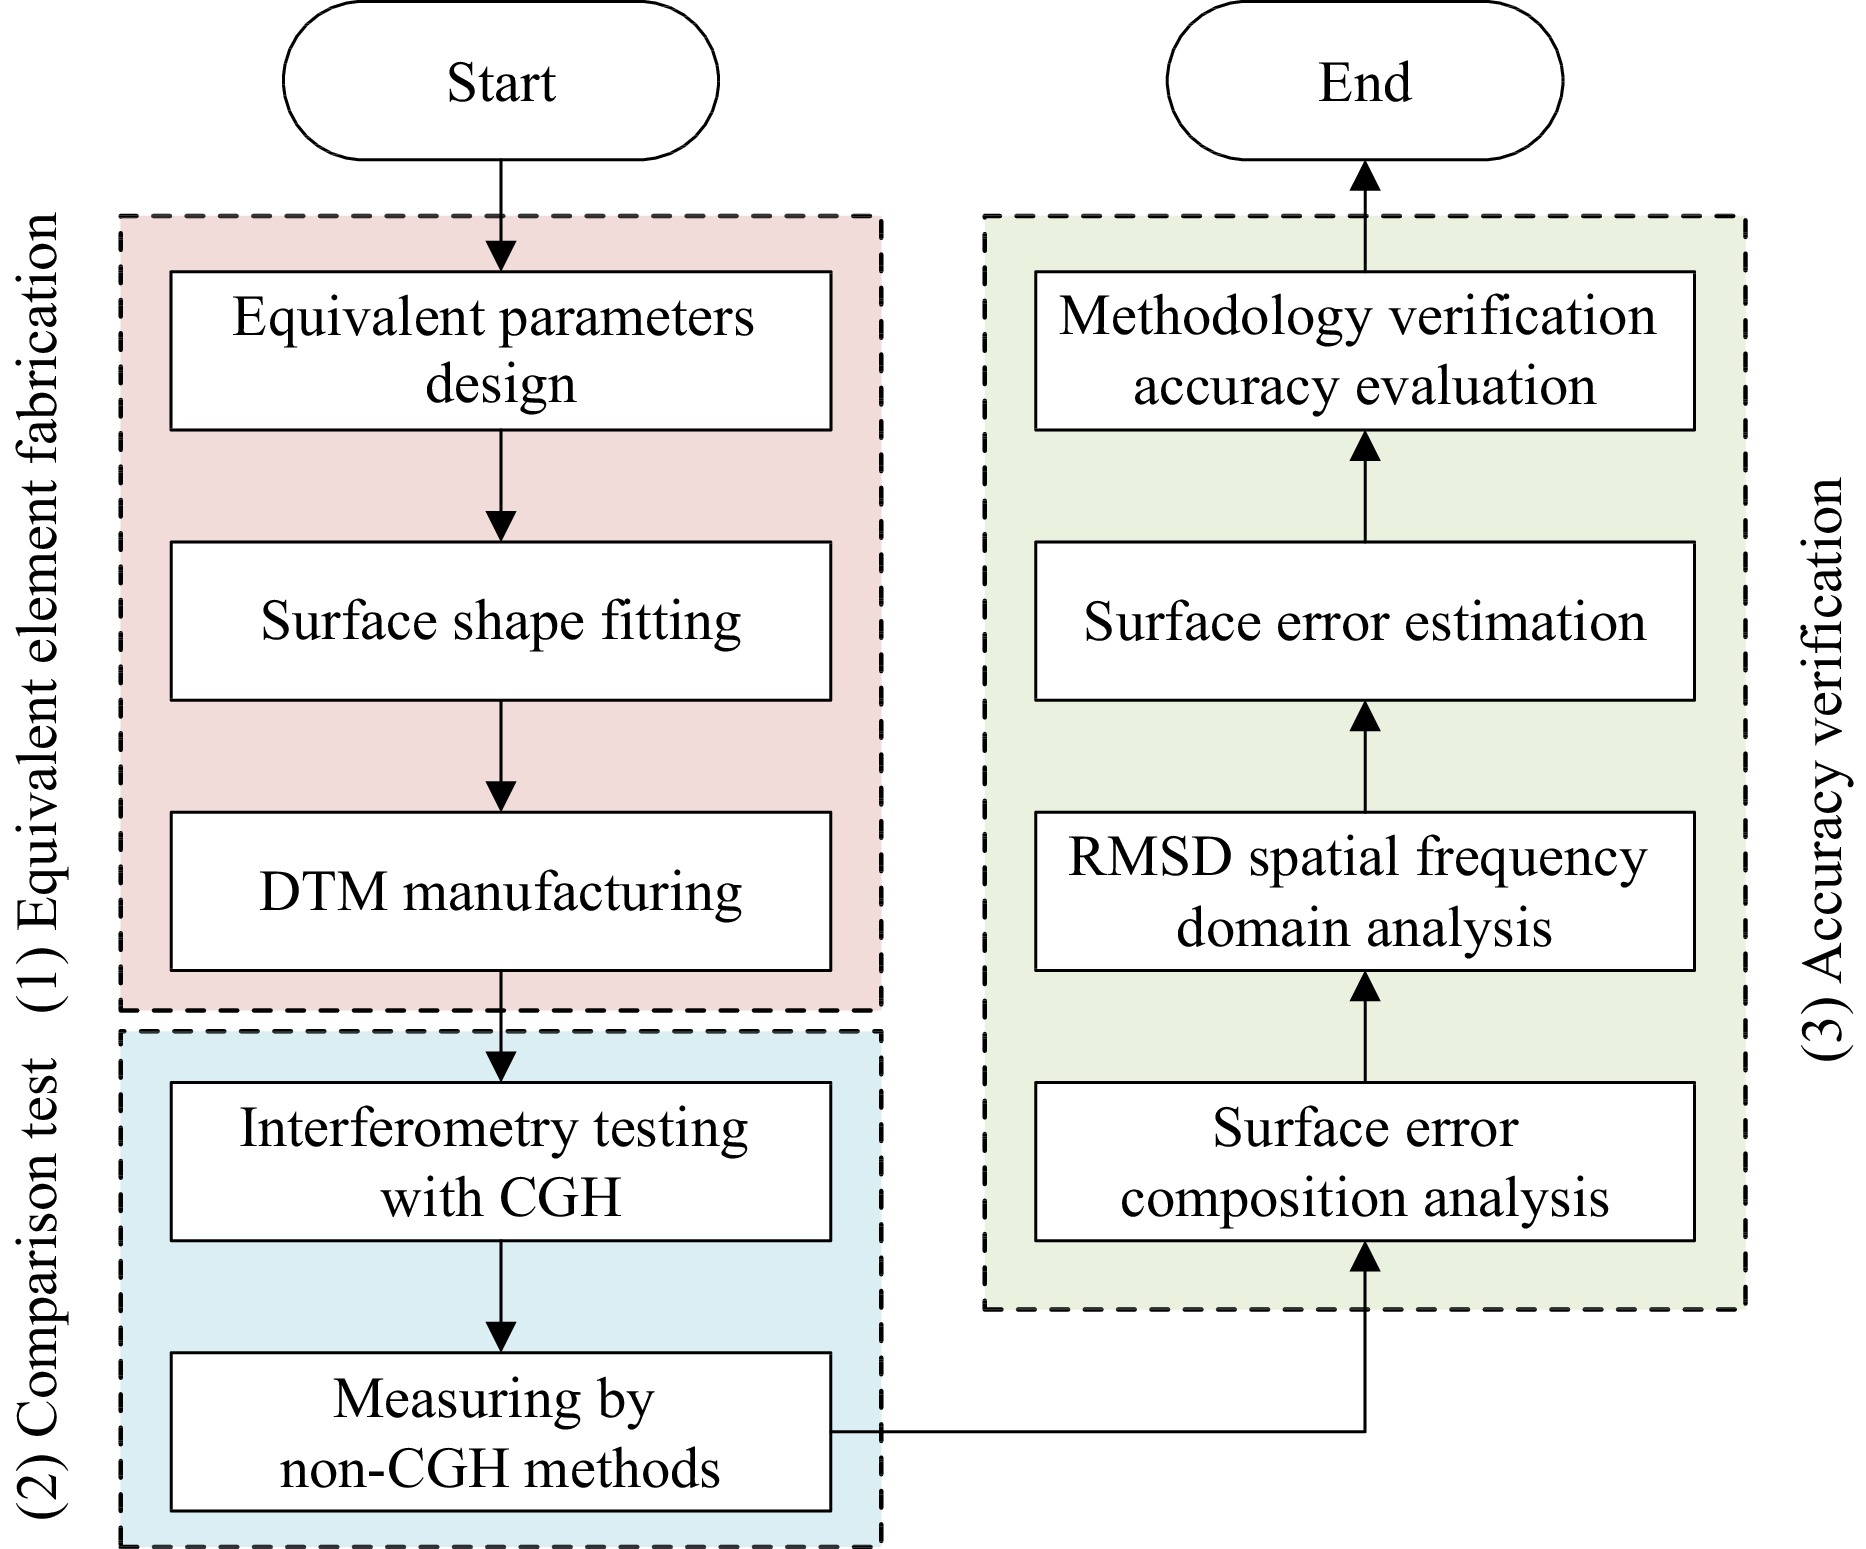
Fig. 1 Flowchart of the CGH accuracy verification methodology.
After fabricating the equivalent element, a comparison test of the surface accuracy was performed using the CGH and non-CGH measurement methods. As the most reliable expression form, pointwise deviations of the measurement results were used to evaluate the methodology verification accuracy of the CGH. Surface error composition and RMSD analyses were performed to evaluate the consistency of the results. Moreover, the RMS values of the surface errors were estimated to further analyze the inconsistencies in the characteristic frequency bands.
-
Fig. 2 shows a typical layout used for testing large-aperture mirrors with a CGH as the null lens. The surface shape of the equivalent element is obtained by scaling a large-aperture mirror along the optical axis.
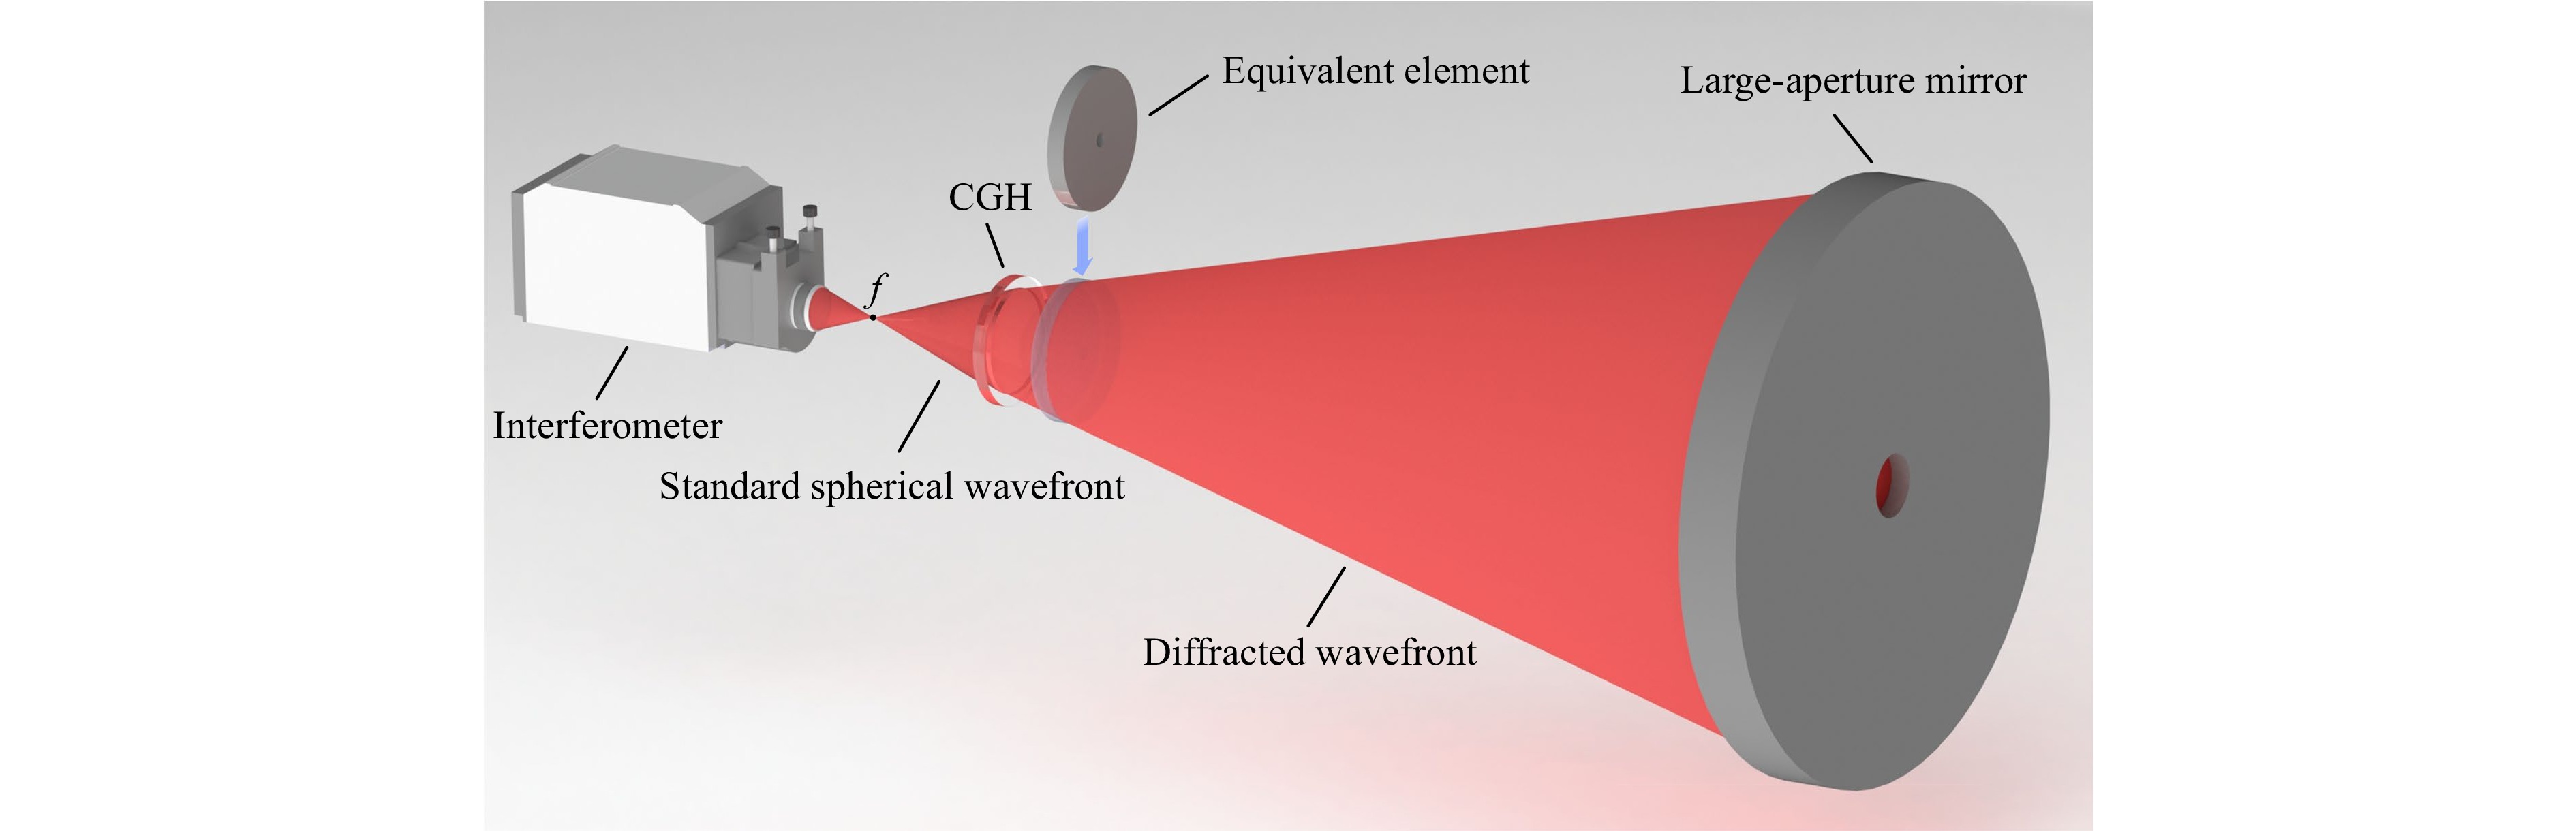
Fig. 2 Typical layout used for testing large-aperture mirrors with a CGH as the null lens.
First, the surface shape of the large-aperture mirror is discretized to obtain the point set, P. Next, each point in P is transformed in its normal direction to obtain the point set, Q, at the position of the equivalent element. The mathematical description of this transformation is as follows. For concave mirrors, the equivalent transformation factor, d, is inversely proportional to the aperture size of the equivalent element, expressed as
$$ \begin{array}{l}P\left(x,y,{\textit z}\right):\text{ }{\textit z}=f\left(x,y\right),\text{ }\left(x,y\right)\in D\text{.}\\ Q=P\left(x,y,{\textit z}\right)-d\stackrel{\wedge }{n},\text{ with }n=\left(\dfrac{\partial f}{\partial x},\dfrac{\partial f}{\partial y},-1\right),\text{ }\stackrel{\wedge }{n}=\dfrac{n}{\left|n\right|}\end{array} $$ (1) where x, y, and z are the three-dimensional coordinates of the O-XYZ coordinate system, f (x, y) is the surface shape formula of the large-aperture mirror, P is the point set of the surface shape of the mirror, D is the effective aperture area, Q is the set of surface shape points of the equivalent element, n is the direction vector, and d is the equivalent transformation factor.
The surface shape T of the equivalent element is obtained by fitting the point set, Q. A general expression of the surface-fitting formula, which consists of a base function and an optimization polynomial, is expressed as
$$ T{\text{(}}x',y',{\textit z}'{\text{)}}:{\textit z}' = g(x',y') + \sum {{h_i}(x',y')} $$ (2) where x', y', and z' are the three-dimensional coordinates of the fitted surface shape in the O'-X'Y'Z' coordinate system, T is the mathematical expression of the equivalent element fitted by point set Q, g is the base function, and hi is the optimization polynomial.
-
An equivalent element of a 3.5 m aspheric concave mirror was designed to verify the accuracy of its CGH. The surface shape of the 3.5 m mirror was defined as
$$ {\textit z}\left( {x,y} \right) = \frac{{\left( {{x^2} + {y^2}} \right)/R}}{{1 + \sqrt {1 - (k+1 )\left( {{x^2} + {y^2}} \right)/R^2} }} + \sum\limits_i^n {{A_i} \cdot {{\left( {{x^2} + {y^2}} \right)}^i}} $$ (3) where x, y, and z are the three-dimensional coordinates of the O-XYZ coordinate system, z (x, y) is the surface shape formula of the large-aperture mirror, R is the vertex curvature radius, k is the conic constant, and Ai is the aspheric coefficient.
Based on the equivalent principle described in the previous section, point set P was first obtained by selecting points at an interval on the ideal surface shape of the 3.5 m mirror. Next, according to Eq. 1, point set P was transformed in the normal direction of each point. During this process, the most crucial step was to determine the value of the equivalent transformation factor, d. Fig. 3 shows the linear relationship between the aperture of the equivalent element and the equivalent transformation factor, d. As shown in Fig. 3, the aperture of the equivalent element decreased as d increased. The equivalent element was positioned 150 mm from the CGH in the optical axis direction to reduce the aperture and reserve space for adjustment.
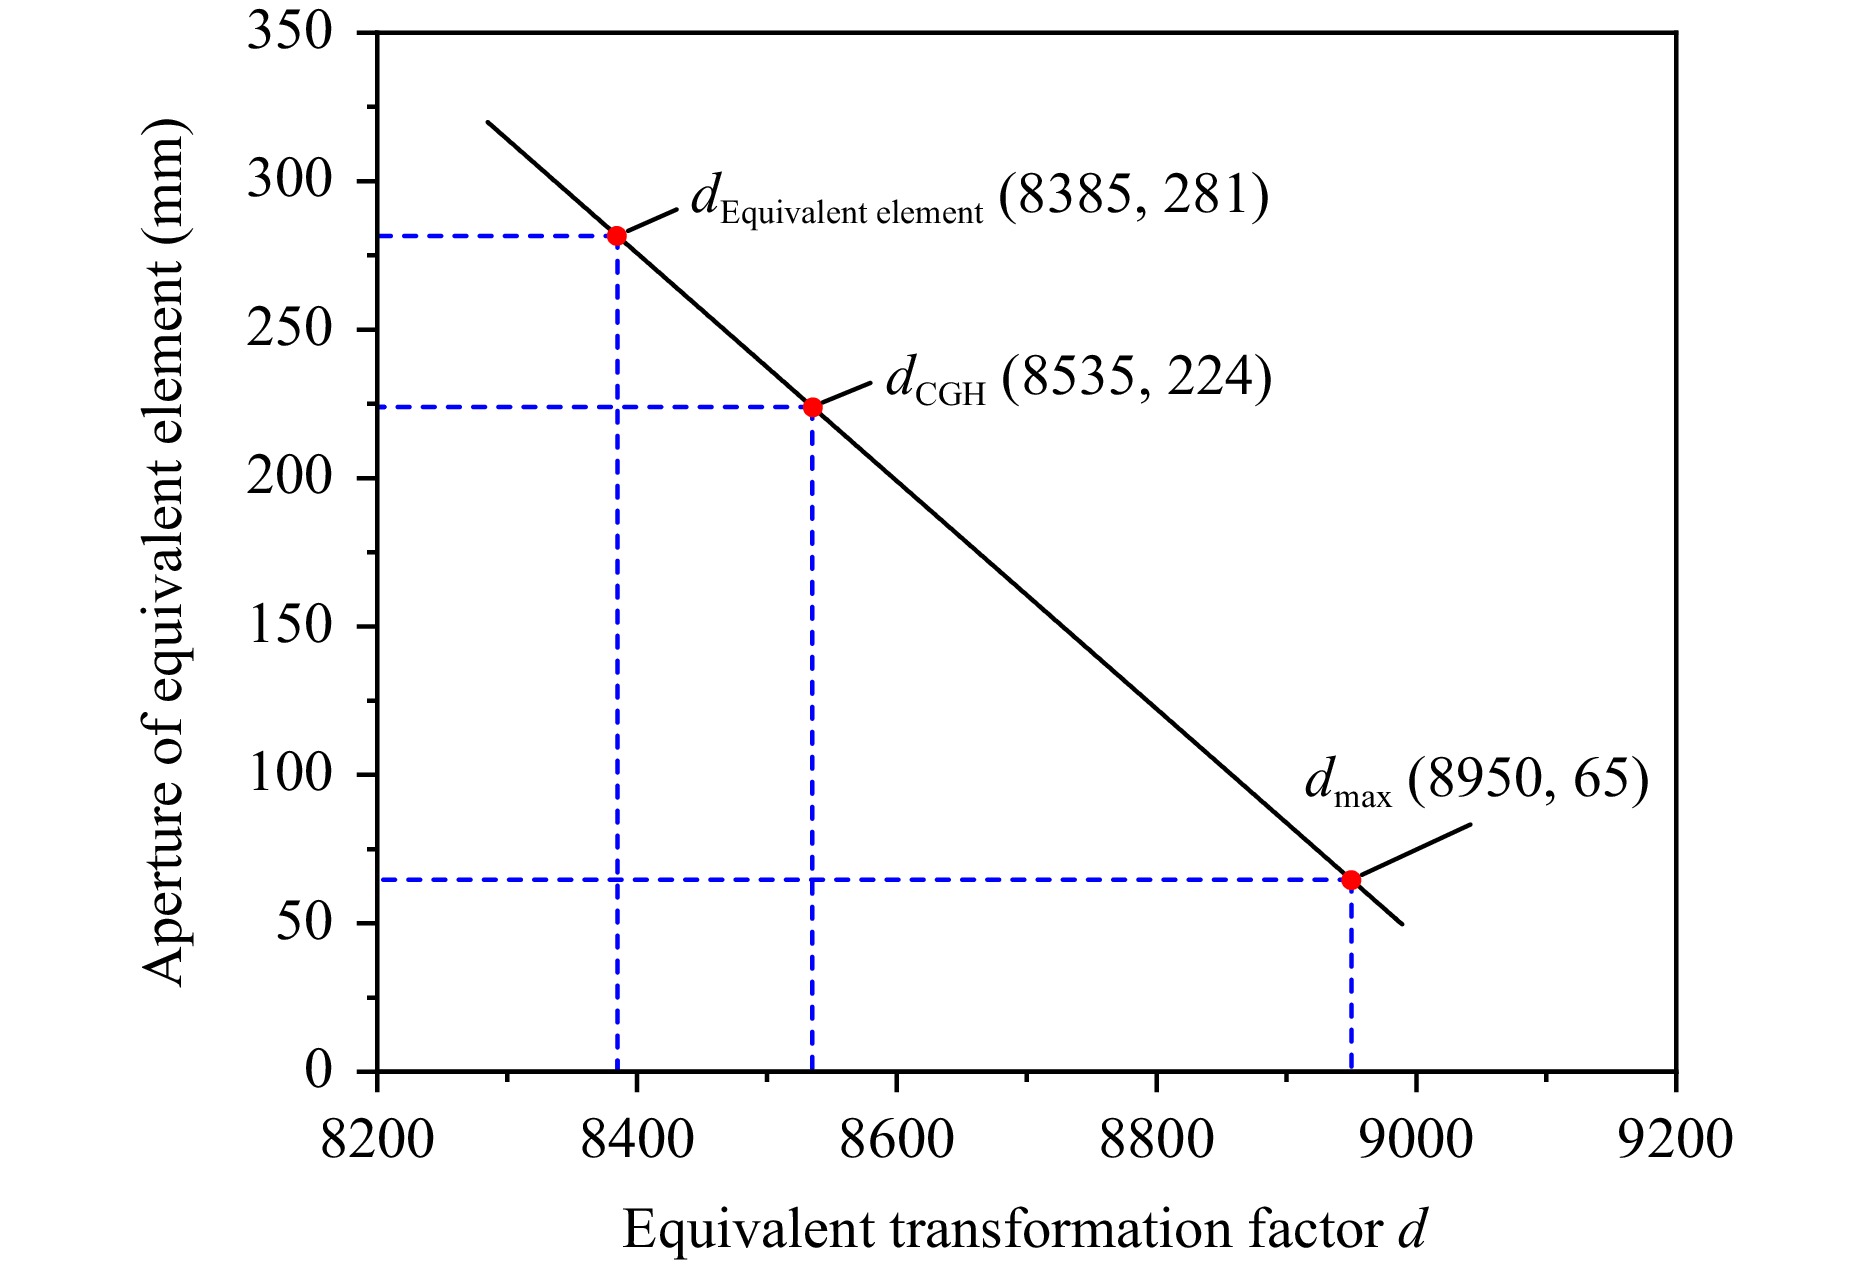
Fig. 3 Linear relationship between the aperture of the equivalent element and the equivalent transformation factor d.
The equivalent element had an effective aperture of 281 mm, which was approximately 1/12 that of the 3.5 m mirror. The sag of the designed surface shape was approximately 15 mm, which was significantly steeper than that of the 3.5 m mirror. Therefore, a spherical basis function combined with aspheric terms was used to perform surface fitting. The vertex curvature radius, R, was determined to be 660 mm. The aspheric coefficients were calculated using the damped least-squares method, and the first nine even-order aspheric terms were used for surface fitting. The fitting residual was 0.6 nm (RMS), which fully satisfied the subsequent accuracy verification requirements. Based on the design parameters of the equivalent element, a DTM was manufactured with a surface accuracy of RMS λ/60@λ = 632.8 nm, which was equal to that of the 3.5 m mirror.
-
The verified CGH was fabricated on a 300 mm fused silica substrate with a thickness of 30 mm, and the minimum period of the diffractive zones was 3.6 μm. It was exposed using a laser direct-writing machine. Fig. 4 shows the experimental setup for the DTM test using the CGH. An interferometer (ZYGO verifire HD 4″) with a standard transmission sphere (PV λ/20@λ = 632.8 nm) was used for testing. The diameter of the light field was 224 mm, which was sufficient to fill the 281 mm effective aperture of the DTM. Although this setup was almost identical to that of the 3.5 m mirror, the distance between the DTM and CGH was only 150 mm, which was significantly shorter than the distance between the 3.5 m mirror and CGH. Such a short distance facilitates the prevention of airflow disturbances during measurements. A high-accuracy profilometer (LUPHOScan 420 HD), whose nominal measurement accuracy was RMS λ/60@λ = 632.8 nm for rotational symmetric aspheric surfaces, was used for comparison.
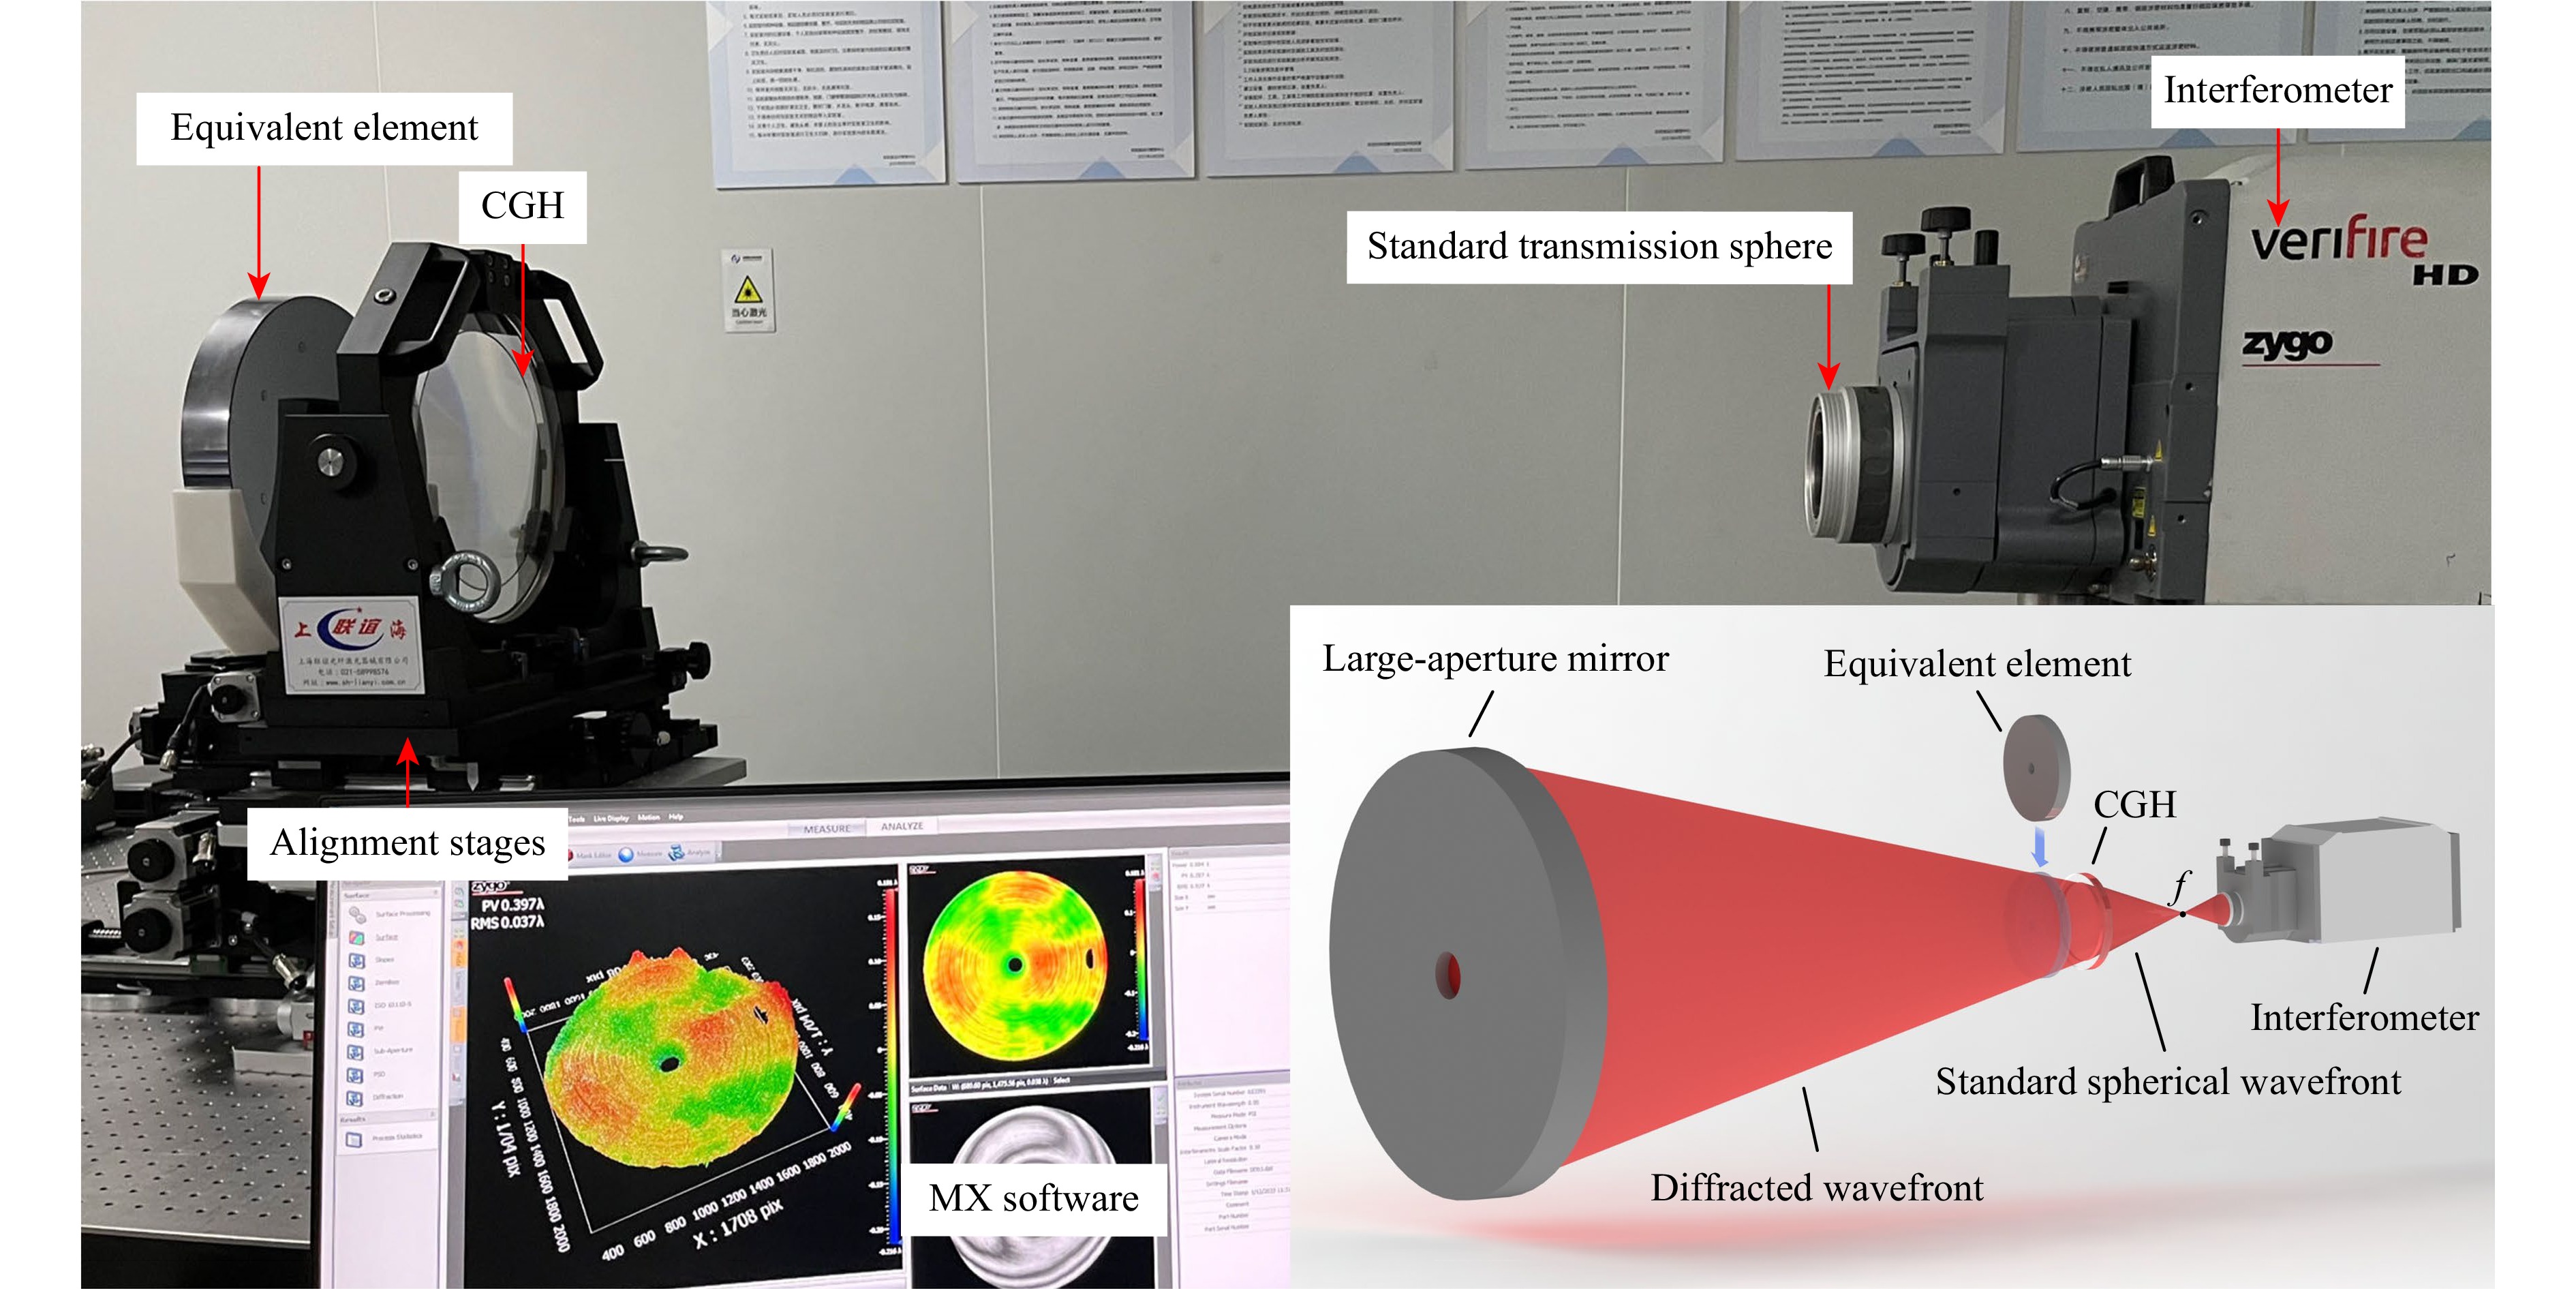
Fig. 4 Experimental setup of the DTM test with the CGH.
-
Error calibration was performed on the CGH measurements to eliminate surface errors introduced by the CGH. The obtained error maps were fitted using Zernike standard polynomials. After rotating the CGH by 60°, the calibrated RMS value of the tenth (90° trefoil) term introduced by the CGH on the error maps was 2.7 nm. Similarly, after rotating the CGH by 90°, the calibrated RMS values of the sixth (90° astigmatism) and fourth (45° astigmatism) terms were 1.3 and 1.1 nm, respectively. Fig. 5a shows the error map obtained using the CGH before error calibration; the RMS value was 10.4 nm. Fig. 5b shows the error map of the calibrated error; the RMS value was 3.1 nm. Fig. 5c shows the error map obtained using the CGH after error calibration; it indicates an RMS value of 9.4 nm.
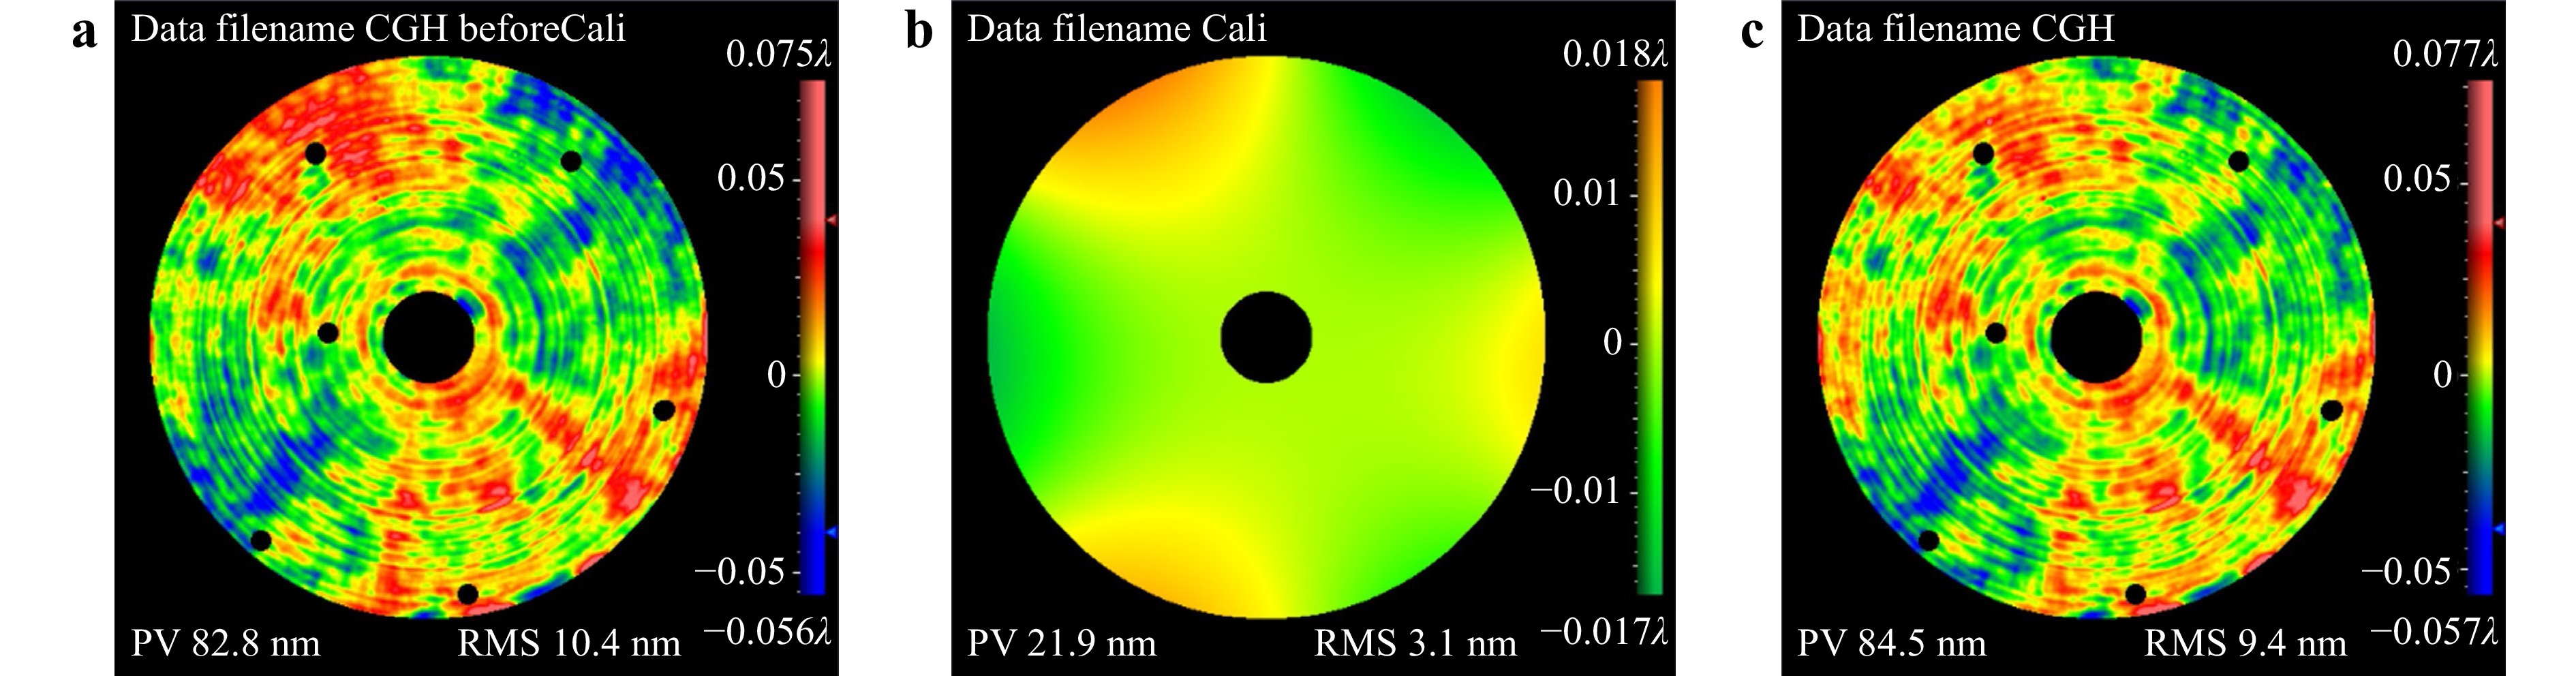
Fig. 5 Error maps of the (a) CGH before calibration, (b) calibrated error, and (c) CGH after calibration.
-
Fig. 6a shows the error map plotted using the CGH, and the RMS value is 9.4 nm. Fig. 6b shows the error map plotted using LUPHOScan (LPS), and the RMS value is 9.0 nm. Pointwise deviation is a direct method used to represent the differences between the measurement results obtained from different instruments. Fig. 6c shows the pointwise deviation map of Fig. 6a, b; it indicates an RMS value of 5.6 nm. Based on this result, the RMS values of the pointwise deviation were insufficient for evaluating consistency, although the two error maps were consistent in some characteristic areas. In the following section, the aberration and RMSD analyses used to evaluate the consistency between the two error maps are described.
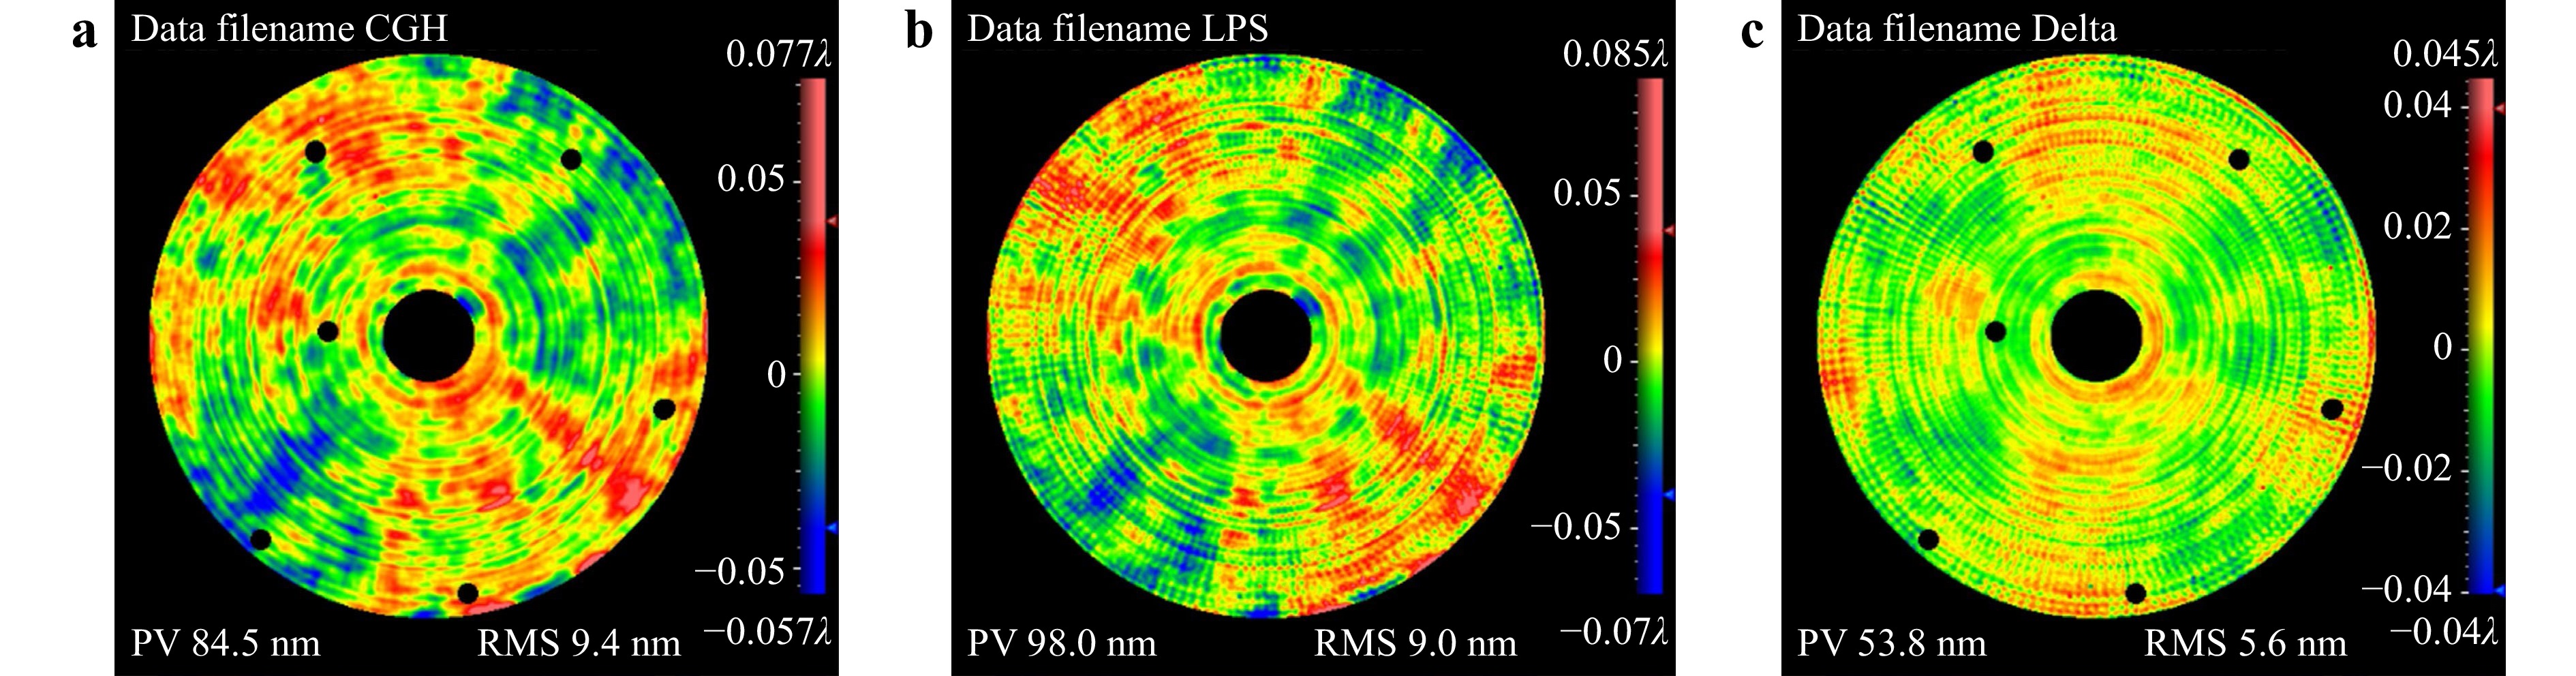
Fig. 6 Error maps obtained using the (a) CGH and (b) LUPHOScan. (c) Their pointwise deviation map.
-
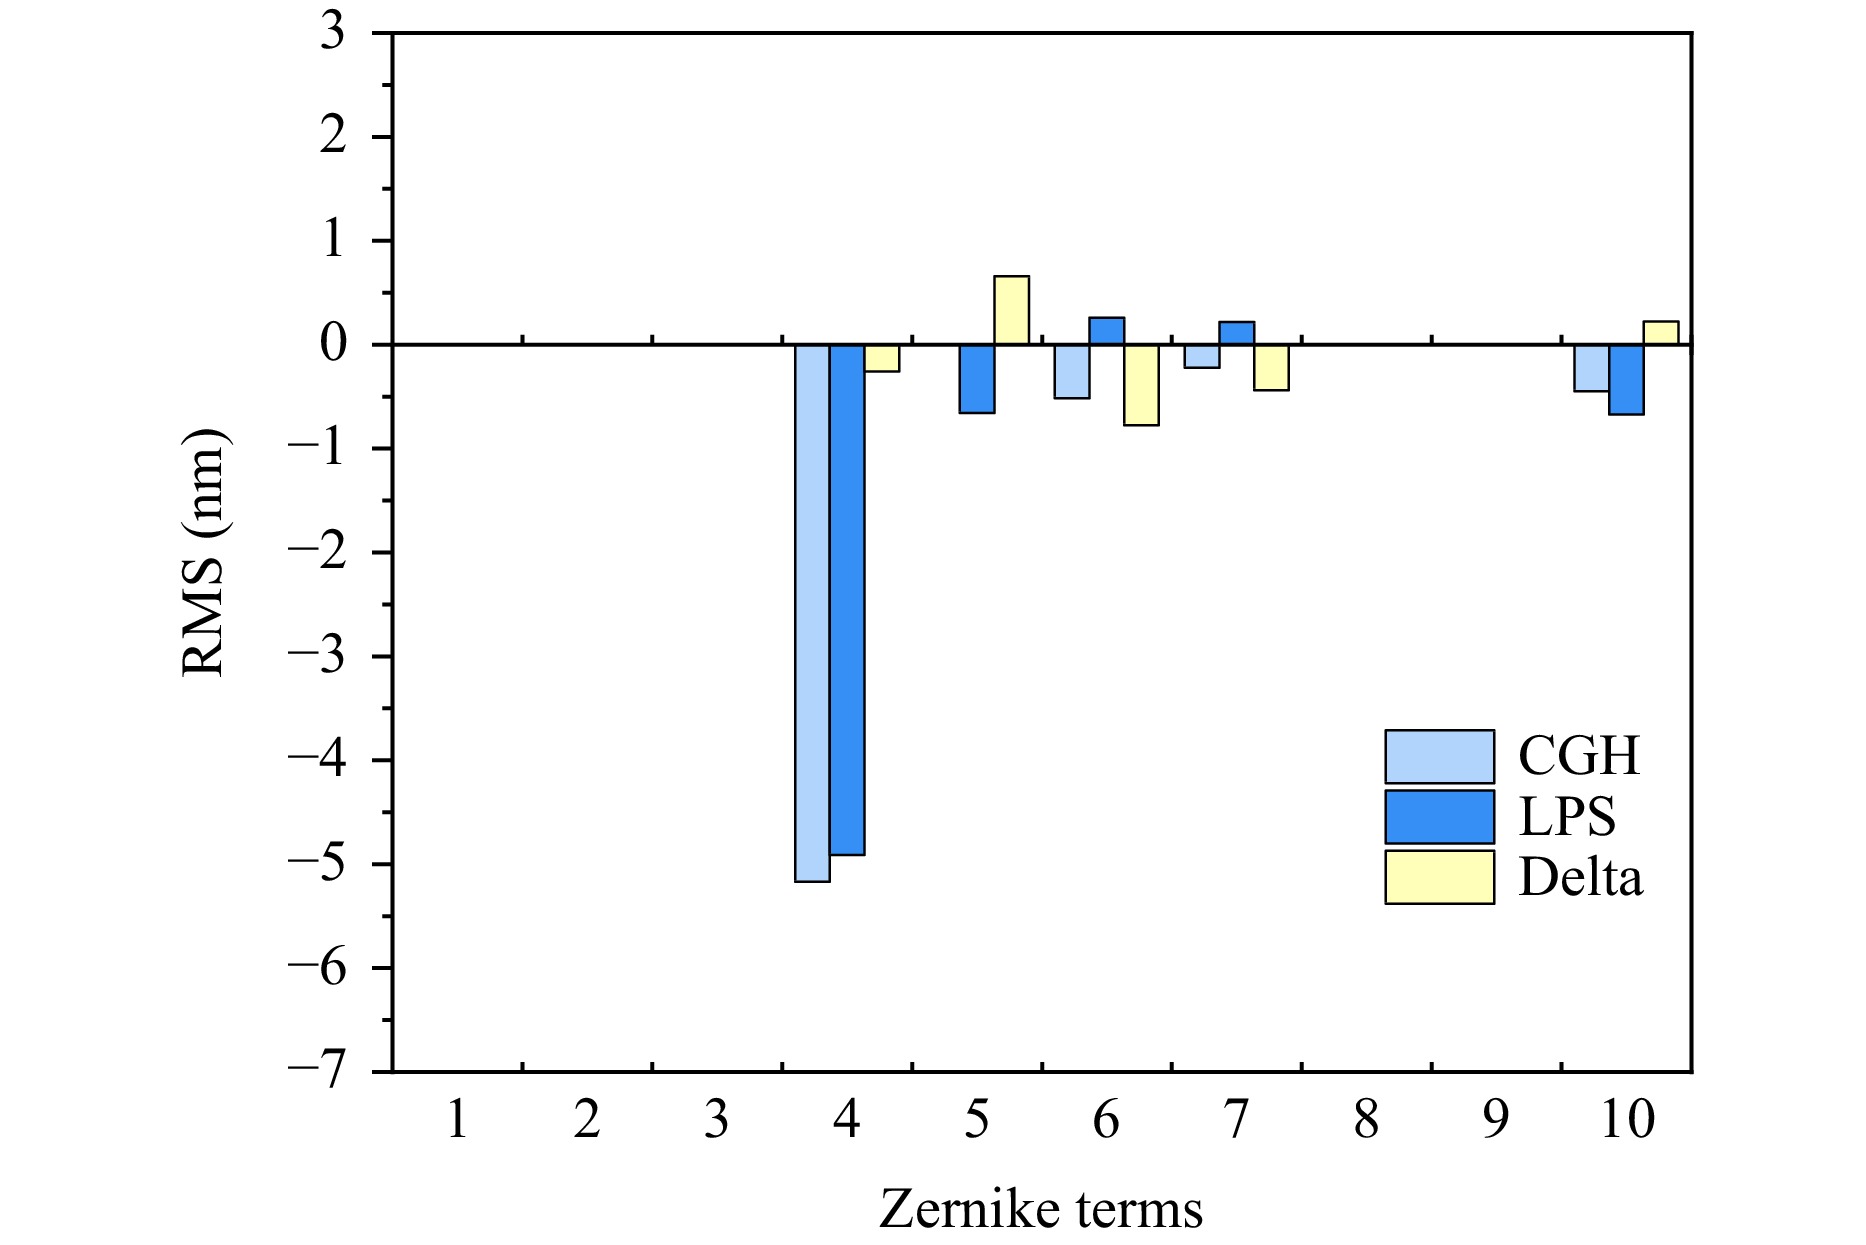
The consistency between the error maps obtained using the CGH and LUPHOScan was evaluated based on their surface error compositions. Accordingly, the error maps in Fig. 6a, b were fitted using Zernike standard polynomials. The RMS values of the first ten terms are shown in Fig. 7. The maximum RMS values obtained from the CGH and LUPHOScan tests occurred in the fourth term, indicating satisfactory consistency between the two error maps. “Delta” in Fig. 7 represents the RMS subtraction of the corresponding Zernike terms. The maximum RMS subtraction was 0.78 nm, which corresponded to the sixth term, whereas the other RMS subtractions were all lower 1 nm, further demonstrating the consistency between the two error maps. The RMS subtraction values corresponding to the terms beyond the tenth term (not shown in Fig. 7) were all lower than 1 nm.
-
Spatial frequency domain analysis is another effective method for evaluating consistency. Power spectral density (PSD) was initially used to analyze the surface shape error in the frequency domain25. However, the problem with this technique is that the surface shape error over various spatial wavelengths cannot be recognized, limiting an intuitive consistency analysis.
RMSD is a more effective approach for representing the PSD of a two-dimensional isotropic surface because it can intuitively and quantitatively express the surface shape error over various spatial wavelengths26. Eq. 4 is widely used to define the RMSD and expresses its relationship with the PSD.
$$ RMS {D^2}(\alpha ): = 2\pi \cdot \ln 10 \cdot {f^2}(\alpha ) \cdot PS {D_{2Diso}}\left[ {f(\alpha )} \right] $$ (4) where α is the decadic number.
The first ten terms (the zeroth to the third orders of the standard Zernike terms) in Fig. 6a, b were all removed to evaluate the consistency more intuitively. Fig. 8a, b show the residual error maps of the fourth and higher orders of the Zernike terms obtained using CGH and LUPHOScan, with RMS values of 7.9 and 7.5 nm, respectively. Fig. 8c shows the pointwise deviation map of Figs. 8a, b, with an RMS value of 5.5 nm.
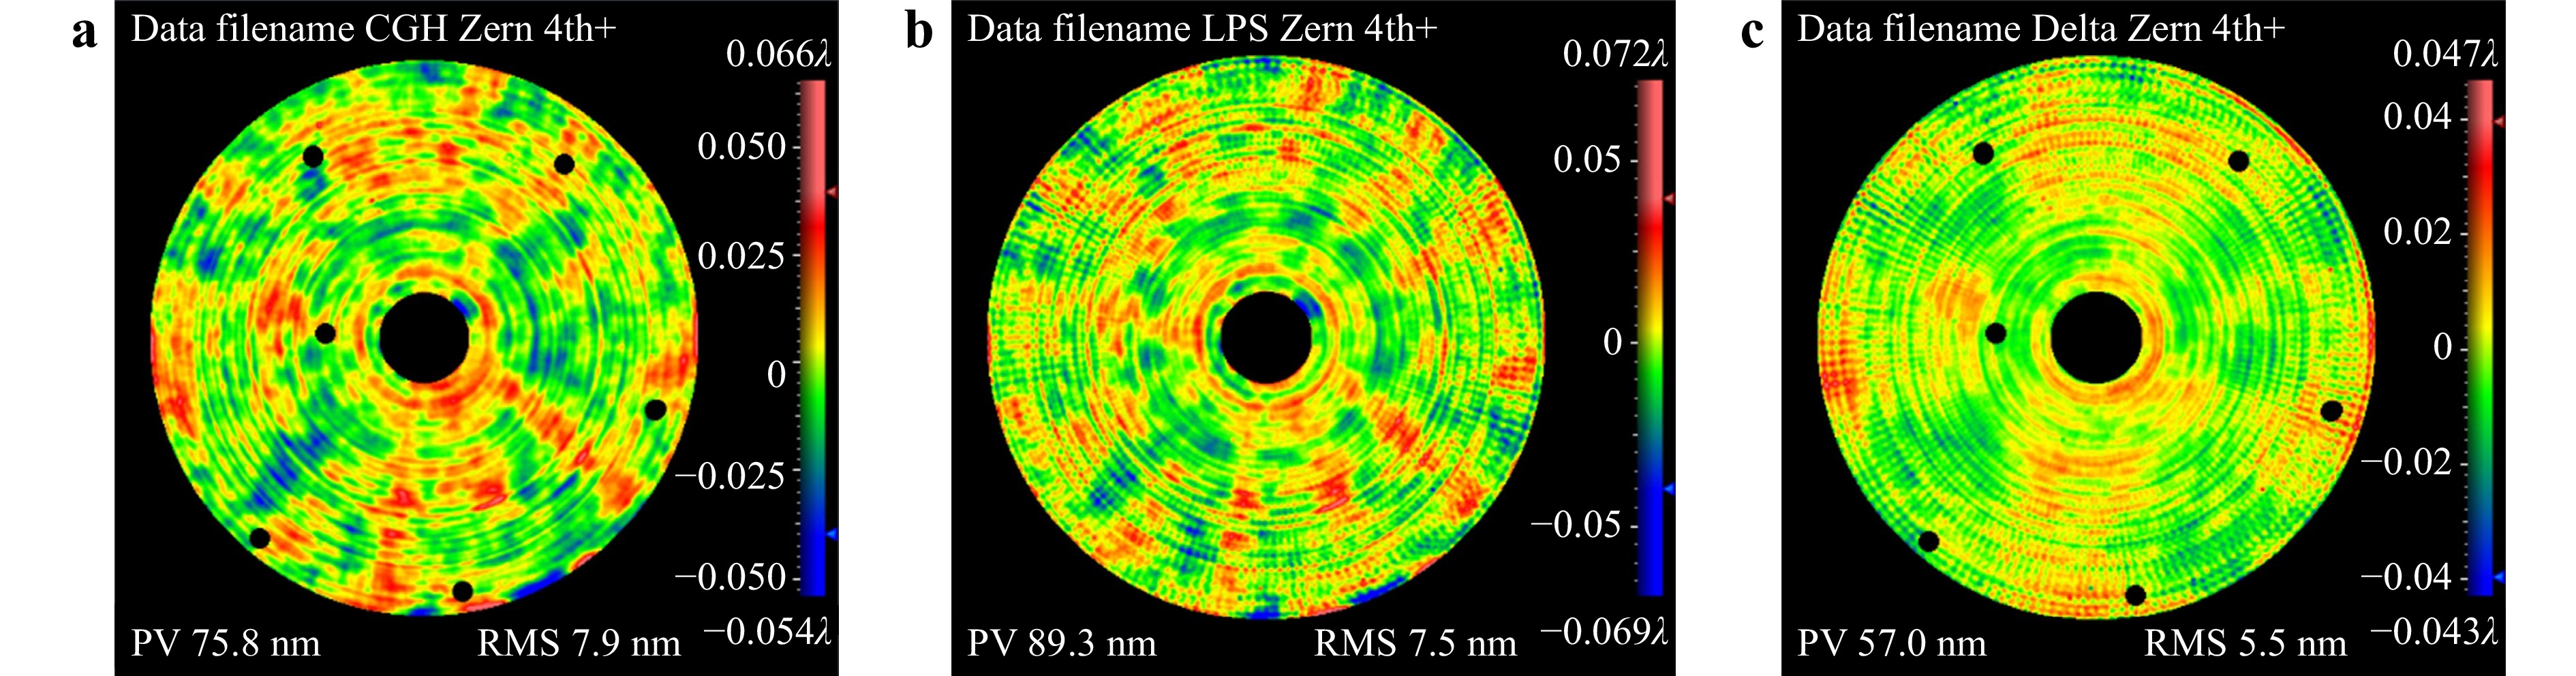
Fig. 8 Residual error maps of the fourth and higher orders of Zernike terms obtained using the (a) CGH and (b) LUPHOScan. (c) Their pointwise deviation map.
Fig. 9 shows the RMSD curves of the error maps presented in Fig. 8. “Delta” represents the RMSD curve of the pointwise deviation shown in Fig. 8c. The two error maps demonstrated favorable consistency over the entire frequency band, particularly for the low- to mid-frequency bands below 0.16 mm-1, with an average value of 4 nm. A relatively significant deviation only occurred in the high-frequency band ranging from 0.16 to 0.36 mm−1, with a maximum deviation of 6.8 nm.
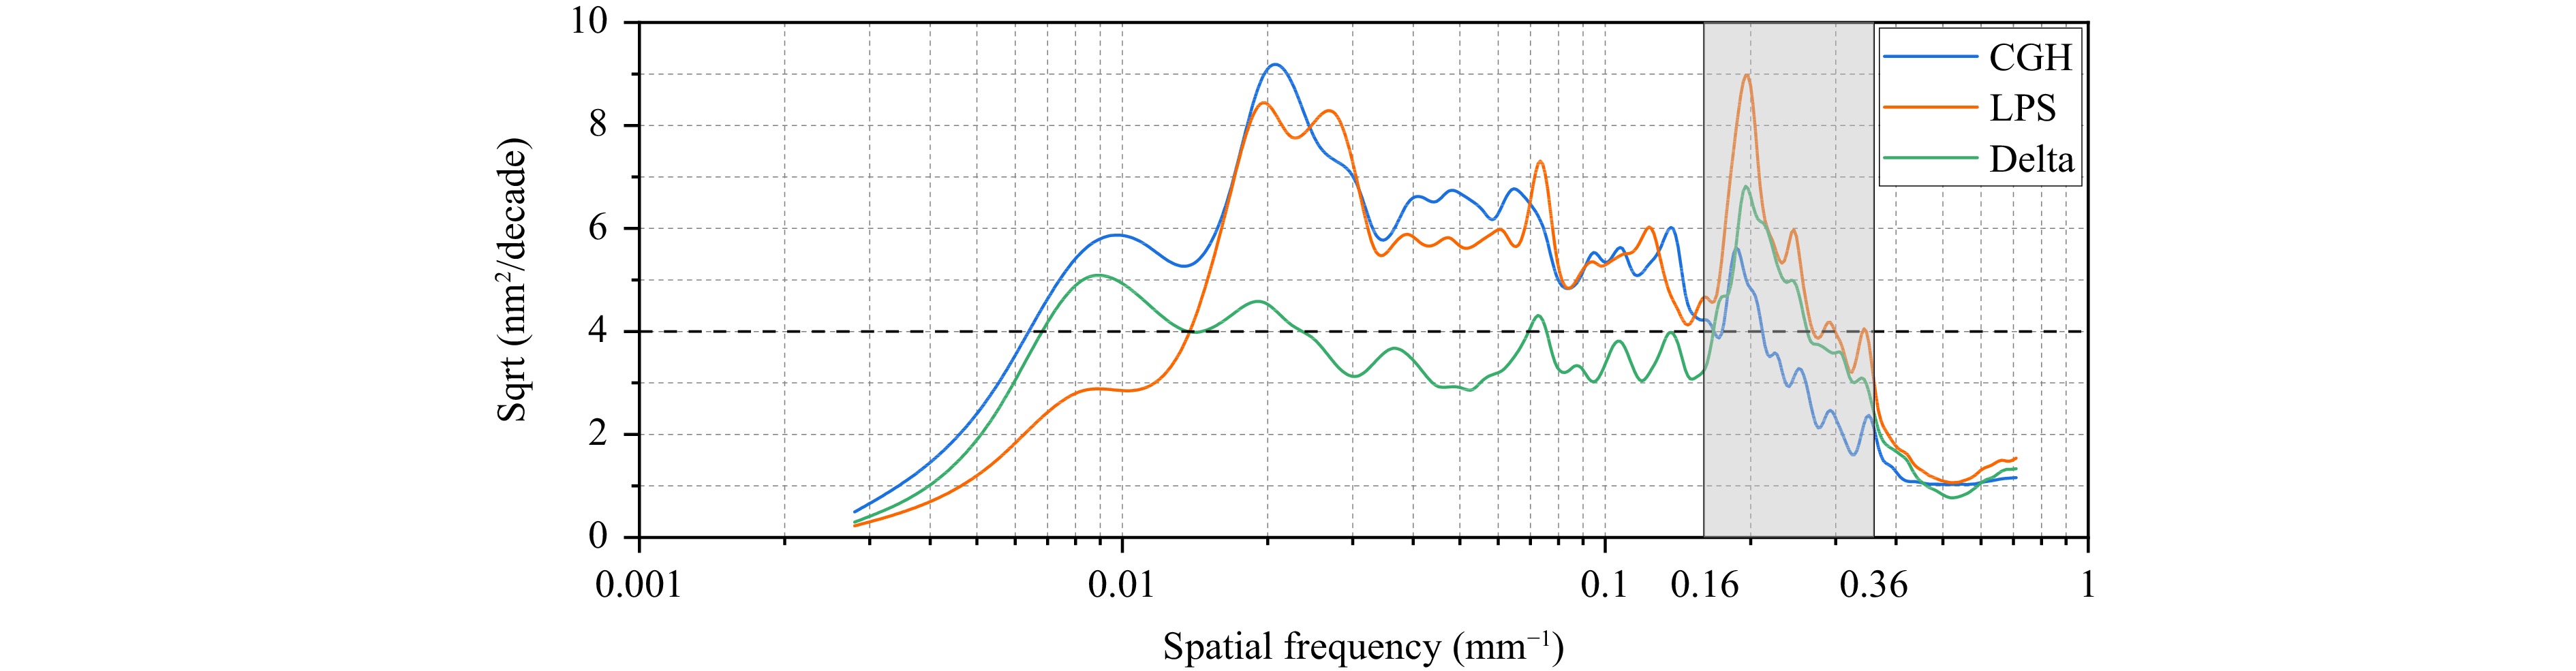
Fig. 9 RMSD curves of the error maps shown in Fig. 8.
The high-frequency bands ranging from 0.16 to 0.36 mm−1 in the error maps shown in Fig. 8 were filtered out to investigate this inconsistency. As shown in Fig. 10a, the ring characteristics were assumed to have been introduced via diamond turning. However, in addition to the ring characteristics, spoke-shaped errors were observed along the radial axis, as shown in Fig. 10b. These errors were more significant, as shown in Fig. 10c. The estimated RMS values of the surface errors were used to determine the cause of inconsistencies in the high-frequency bands, as described in the following section.
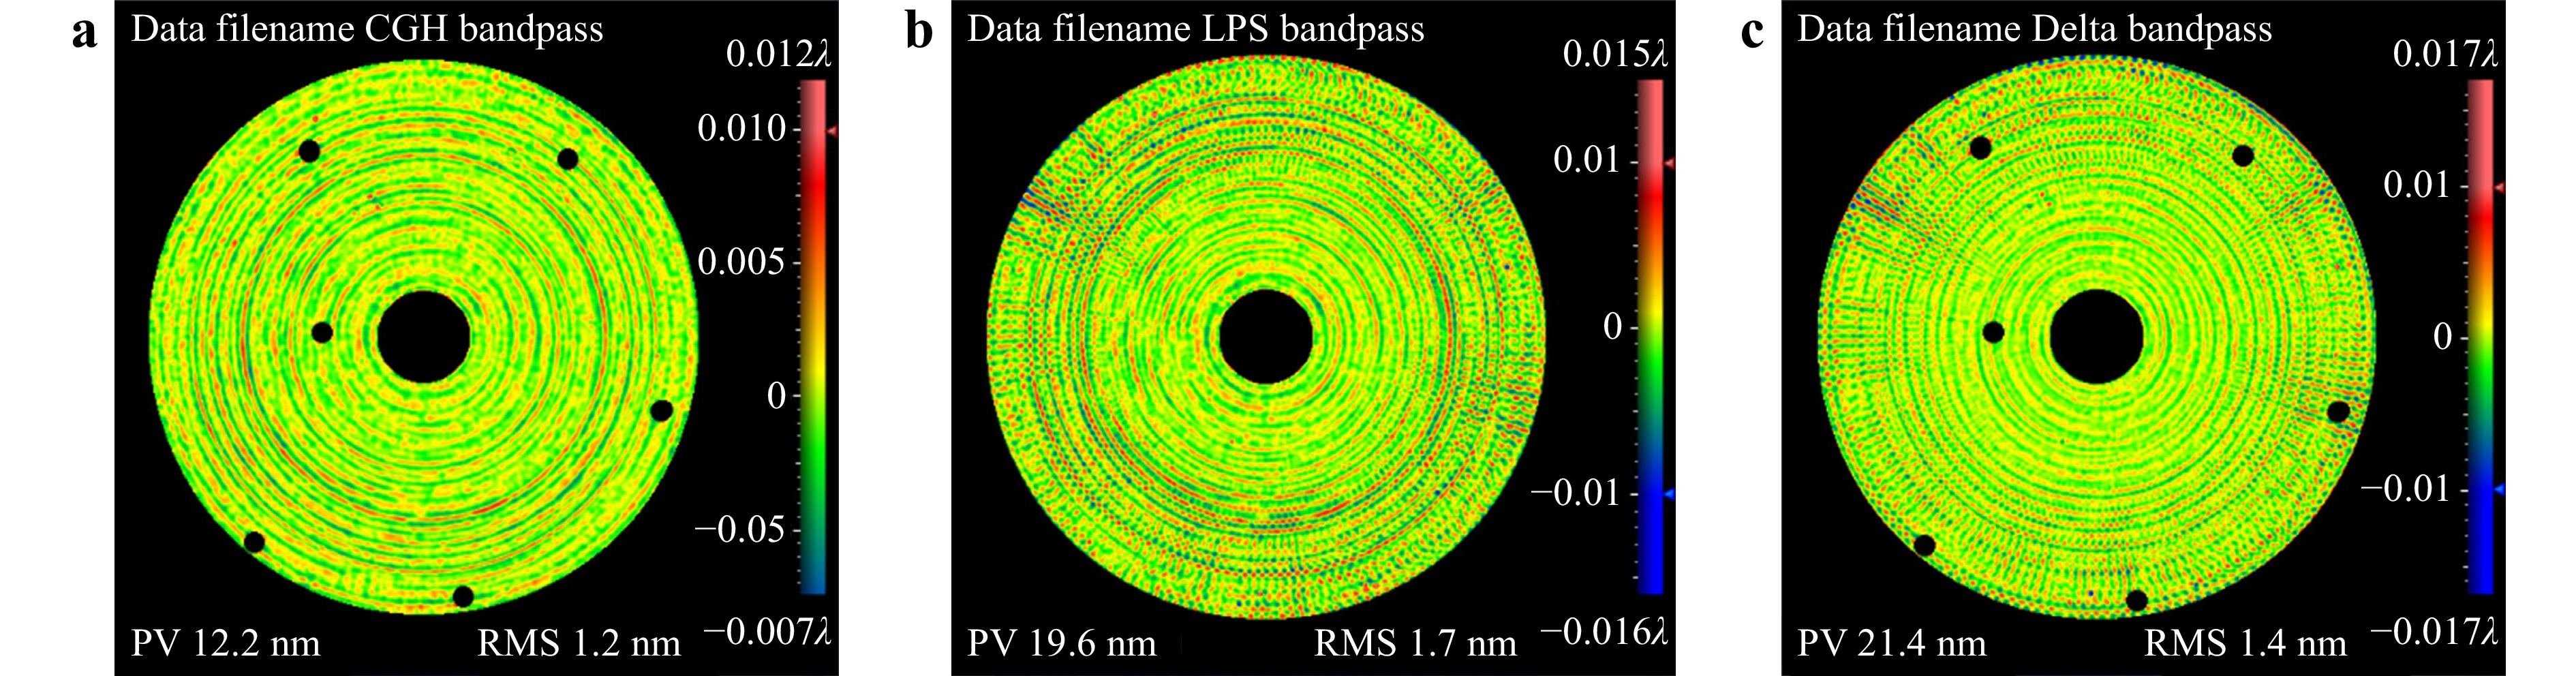
Fig. 10 High-frequency bands ranging from 0.16 to 0.36 mm−1 in the error maps shown in Fig. 8.
-
The RMS values of the surface errors were estimated using the two error maps obtained using CGH and LUPHOScan to reveal the inconsistencies shown in Fig. 10c. This is based on the orthogonality hypothesis, which states that the actual surface shape error, S, and the instrument measurement error, A, are linearly independent27. The orthogonality hypothesis is defined as
$$ \begin{gathered} {T_i} = S + {A_i},{\text{ with }}i = 1,2,...,n. \\ \left\langle {S|{A_i}} \right\rangle = \left\langle {{A_i}|{A_j}} \right\rangle = 0,{\text{ with }}i,j = 1,2,...,n \\ \end{gathered} $$ (5) where T represents each single-sample test map, i and j represent each sequence of test results, and n is the total sampling count.
The RMS value s of the actual surface shape error was then obtained using
$$ s \approx 0.7 \times \sqrt {t_1^2 + t_2^2 - t_{1 - 2}^2} ,{\text{ with }}t_{1 - 2}^2 = \left\langle {{T_1} - {T_2}|{T_1} - {T_2}} \right\rangle $$ (6) Fig. 11 shows the estimated RMSD curve of the surface errors calculated using Eq. 6. Theoretically, the estimated curve did not contain measurement errors27. This curve was consistent with the CGH curve in the frequency band above 0.065 mm. However, the LUPHOScan error map contained additional characteristic peaks. In particular, the differences between the estimated and LUPHOScan curves were more significant in the frequency band ranging from 0.16 to 0.36 mm−1. Moreover, the repeatability curve (LPS-2 in Fig. 11) of LUPHOScan showed that the repeatability worsened in this frequency band, indicating that LUPHOScan could not accurately measure high-frequency surface errors.
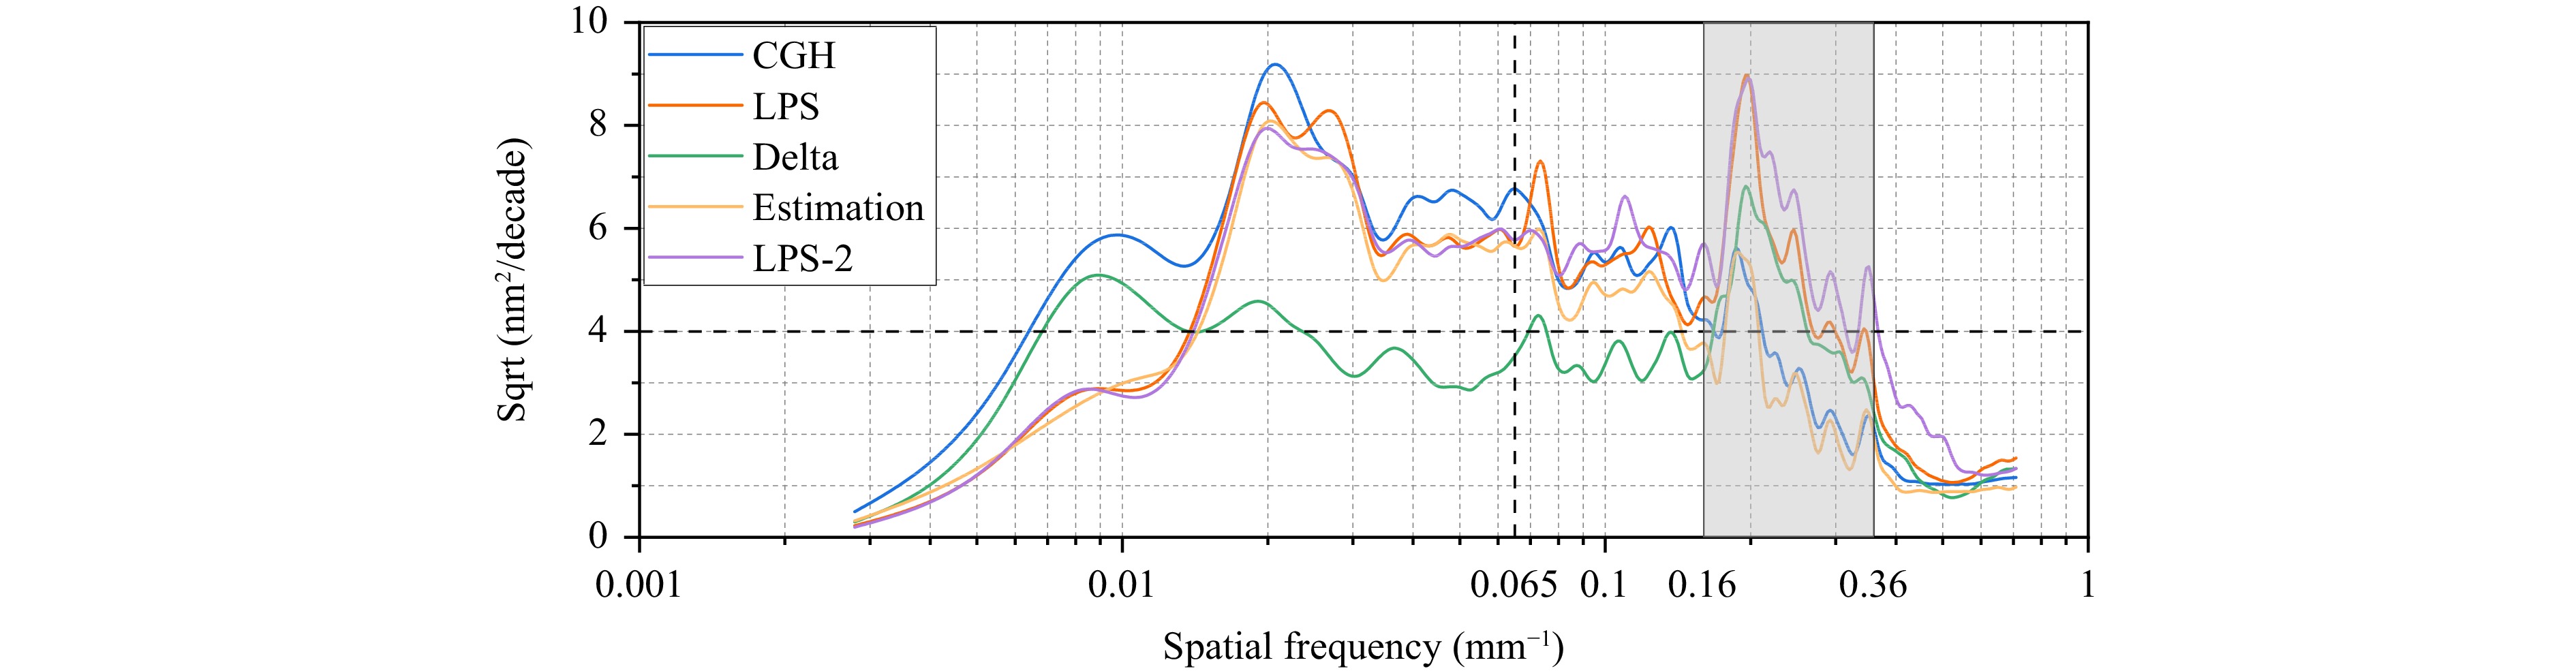
Fig. 11 Estimated RMSD curves of the DTM surface errors.
-
In this study, we developed an efficient CGH accuracy verification methodology for testing large-aperture mirrors in which an equivalent element was used to overcome the aperture limitation in the comparison test. The following conclusions were drawn.
(1) By scaling a 3.5 m mirror surface along the optical axis, a 281 mm DTM was designed as the equivalent element for the comparison test. The fitting residual of the designed surface was 0.6 nm (RMS), which satisfied the equivalence requirement for the CGH accuracy verification.
(2) The surface shape errors of the fabricated DTM were 9.4 nm (RMS) and 9.0 nm (RMS), as obtained using CGH and LUPHOScan profilometers, respectively. However, the RMS value of the pointwise deviation of the two error maps was 5.6 nm, indicating that it could not accurately characterize the consistency in different spatial frequency bands.
(3) By analyzing the surface error composition, the two error maps obtained using CGH and LUPHOScan were found to be highly consistent for the first 36 Zernike terms, with RMS subtraction values lower than 1 nm.
(4) Through an RMSD analysis, the two error maps were found to be highly consistent in the low- to mid-frequency bands but inconsistent in the high-frequency bands above 0.16 mm−1, with a deviation of up to 6.8 nm.
(5) The RMSD curves of the estimated surface errors were plotted based on the orthogonality hypothesis. LUPHOScan could not accurately measure the high-frequency surface errors in the frequency band ranging from 0.16 to 0.36 mm−1.
(6) By using a DTM with an RMS surface accuracy of approximately 10 nm, the methodology verification accuracy of the CGH was 4 nm in the low- to mid-frequency band below 0.16 mm−1.
The proposed methodology provides a feasible solution for CGH accuracy verification, ensuring high-accuracy and reliable testing of large-aperture aspheric mirrors. If higher-accuracy non-CGH technology can be used, the methodology verification accuracy for CGH can be improved further.
-
This study was supported by the National Natural Science Foundation of China (62127901, 52375471, and 62305333). This work was partially supported by the National Key Research and Development Program (2022YFB3403405), Youth Innovation Promotion Association of the Chinese Academy of Sciences (2019221), Young Elite Scientists Sponsorship Program of CAST (2022QNRC001), and Young Elite Scientists Sponsorship Program of Jilin Province (QT202222).
Accuracy verification methodology for computer-generated hologram used for testing a 3.5-meter mirror based on an equivalent element
- Kai Xu1, 2, 3, 4,
- Haixiang Hu1, 2, 3, 4, *, ,
- Xin Zhang1, 3, 4,
- Hongda Wei1, 3, 4,
- Zhiyu Zhang1, 2, 3, 4, *, ,
-
Xuejun Zhang1, 2, 3, 4,

- Light: Advanced Manufacturing , Article number: (2024)
- Received: 26 December 2023
- Revised: 13 April 2024
- Accepted: 13 April 2024 Published online: 15 May 2024
doi: https://doi.org/10.37188/lam.2024.025
Abstract: Interferometry with computer-generated holograms (CGHs) is a unique solution for the highly accurate testing of large-aperture aspheric mirrors. However, no direct testing method for quantifying the measurement accuracy of CGHs has been developed. In this study, we developed a methodology for verifying CGH accuracy based on an element that is functionally equivalent to a large-aperture mirror in terms of accuracy verification. The equivalent element decreased the aperture by one or higher orders of magnitude, implying that the mirror could be replaced by a non-CGH technology in a comparison test. In this study, a 281 mm diamond-turned mirror was fabricated as the equivalent element of a 3.5 m aspheric mirror and measured using CGH and LUPHOScan profilometers. Surface error composition and root-mean-square (RMS) density analyses were performed. The methodology verification accuracy of the CGH was 4 nm (RMS) in the low- to mid-frequency bands, with a measured surface accuracy of approximately 10 nm (RMS). This methodology provides a feasible solution for CGH accuracy verification, ensuring high-accuracy and reliable testing of large-aperture aspheric mirrors.
Research Summary
Accuracy verification methodology for computer-generated holograms
Interferometry with computer-generated holograms (CGHs) is a unique solution for the highly accurate testing of large-aperture aspheric mirrors. However, no direct testing method for quantifying the measurement accuracy of CGHs has been developed. In this study, we developed a methodology for verifying CGH accuracy based on an element that is functionally equivalent to a large-aperture mirror in terms of accuracy verification. A 281 mm diamond-turned mirror was fabricated as the equivalent element of a 3.5 m aspheric mirror and measured using CGH and LUPHOScan profilometers. Surface error composition and root-mean-square (RMS) deviation analyses were performed. The methodology verification accuracy of the CGH was 4 nm (RMS) in the low- to mid-frequency bands, with a measured surface accuracy of approximately 10 nm (RMS). This proposed methodology provides a feasible solution for CGH accuracy verification.
Rights and permissions
Open Access This article is licensed under a Creative Commons Attribution 4.0 International License, which permits use, sharing, adaptation, distribution and reproduction in any medium or format, as long as you give appropriate credit to the original author(s) and the source, provide a link to the Creative Commons license, and indicate if changes were made. The images or other third party material in this article are included in the article′s Creative Commons license, unless indicated otherwise in a credit line to the material. If material is not included in the article′s Creative Commons license and your intended use is not permitted by statutory regulation or exceeds the permitted use, you will need to obtain permission directly from the copyright holder. To view a copy of this license, visit http://creativecommons.org/licenses/by/4.0/.

 DownLoad: