


-
Fluorescence microscopy, including recent developments in super-resolution microscopy1, has become an important tool in biological studies. Both the broad spectra of fluorescence probes and excitation sources are essential for the multiplexed imaging of numerous subcellular structures and biomolecules. There is a wide range of commercially available organic and inorganic fluorescent probes, including fluorescent proteins in all emission bands, from blue to red fluorescein dyes2,3, rhodamine dyes4, cyanine dyes5−10, lipid dyes11, and BODIPY dyes12,13. The trend of excitation source development has been experienced by the use of conventional lamps, including mercury, xenon, and halogen lamps, and energy-efficient and solid-state light sources, including lasers and LEDs14.
Mercury lamps are commonly used in fluorescence microscopy, where mercury vapor discharges under high pressure with a spectral range mainly in the UV and visible regions. Mercury lamp have a short service life (~ 300 h); they must be changed frequently. It is also difficult to select the desired excitation wavelength with fixed spectra of mercury lamps while maintaining a high power density15. Xenon lamps have low power density in the visible region but several high emission peaks in the infrared band16. Their operational lifetime is longer than that of mercury lamps (approximately 2000 h)17. The halogen lamp mainly covers the spectral range of 350–700 nm, with the excitation power dropping sharply after this range. Conventional lamps bucky and produce large amounts of heat, which requires heat sinks. Therefore, all the above are used over a long distance from the back of the microscope, resulting in further optical efficiency losses.
The LED industry has grown rapidly in recent years, replacing conventional excitation sources owing to their high luminous efficiency, small size, low power consumption, long operational lifetime (around 10000–15000 h), and low price18. Recent studies have shown that new materials have great potential for solid-state illumination applications. Zang et al. proposed CsPbBr3@Cs4PbBr6/SiO2 nanocrystals as green emitters of white light-emitting diodes (WLED) which can be applied in visible-light communication19. They also proposed CsPbBr3@SiO2 quantum dots for stable WLED production20. Li et al. presented phosphor-free single-chip WLEDs for lighting-communication integration21. Lee et al. proposed an Ag@SiO2-embedded InGaN/GaN nanorod array for high-efficiency pe-white LED fabrication22.
Moreover, LEDs cover all wavelengths, from UV to IR, providing flexibility for multiplexed biomedical imaging applications. Albeanu et al. developed an LED array light source via a light guide, such as a liquid light guide (NT53-691, Edmund Optics) or optical fibre, using a fluorescence microscope23. The illumination system comprises one or two LEDs (via a dichromatic mirror), a heatsink, a mechanical tube, and a lens. They demonstrated that the LED excitation signal was 30% brighter and could be uniformly focused on the sample like the xenon-arc light source. Kogel et al. designed an LED-TIRF microscope using an LED-based TIRF/epifluorescence condenser system. They demonstrated an electrical supply and digital control system to achieve multicolor TIRF imaging24. Compared with the conventional laser-TIRF setup, the LED-TIRF design can eliminate artifacts caused by interference fringing and scattering effects.
Furthermore, LEDs can be flexibly applied as a stand-alone system, such as the commercial CoolLED series that uses a series of LEDs25, for example, up to four channels with 16 wavelengths of LEDs in their pE-4000 units. Dindas et al. used an illumination system to excite cpYFP at 405 and 470 nm and R-GECO1 at 580 nm26. The commercially available CoolLED used in the Leica DMi8 microscope, including a single-wavelength module pE-100 and the triple-wavelength module pE-300 series, provides three ways via a liquid light guide, optical fibre, and direct connection. However, the entire CoolLED system is highly commercially integrated, which causes obstacles to user customisation.
Here, we present the design of an LED fluorescence light source called an LED integrated excitation cube (LEC), which can be arbitrarily used in any fluorescent microscope. With electronics built into the 6-position filter cube turret (8-position in the latest design), each excitation channel can be controlled independently. The entire module is compact, low-cost, and easy to install by taking the full list of the advantages of LED excitations. Moreover, by pulsing the supply current, pulsed excitation can deliver a high optical power density but with reduced phototoxicity. Furthermore, by synchronising it with a time-gated detection unit, LEC-powered microscopes can be used in time-gated luminescence imaging applications.
-
Optical Simulation and Design. As LEDs have a large radiation angle (α in Fig. 1a), optical collimation towards the objective lens is essential. However, the limited space within the fluorescence filter cube makes installing spherical or aspheric lenses difficult. Our design used a 1.9 mm Fresnel lens to collimate the LED light. Because LEDs of different emission wavelengths can emit light at different radiation angles, the Fresnel lens’s position directly affects the excitation power’s delivery efficiency. In a typical epifluorescence microscope, the excitation light is reflected by a dichroic mirror into the objective lens (Fig. 1a). We performed an optical simulation in Zemax by changing the LED radiation angle α and the distance D between the LED and Fresnel lens in two microscope models, Nexcope NE900 and Olympus IX73, as illustrated in Fig. 1b.
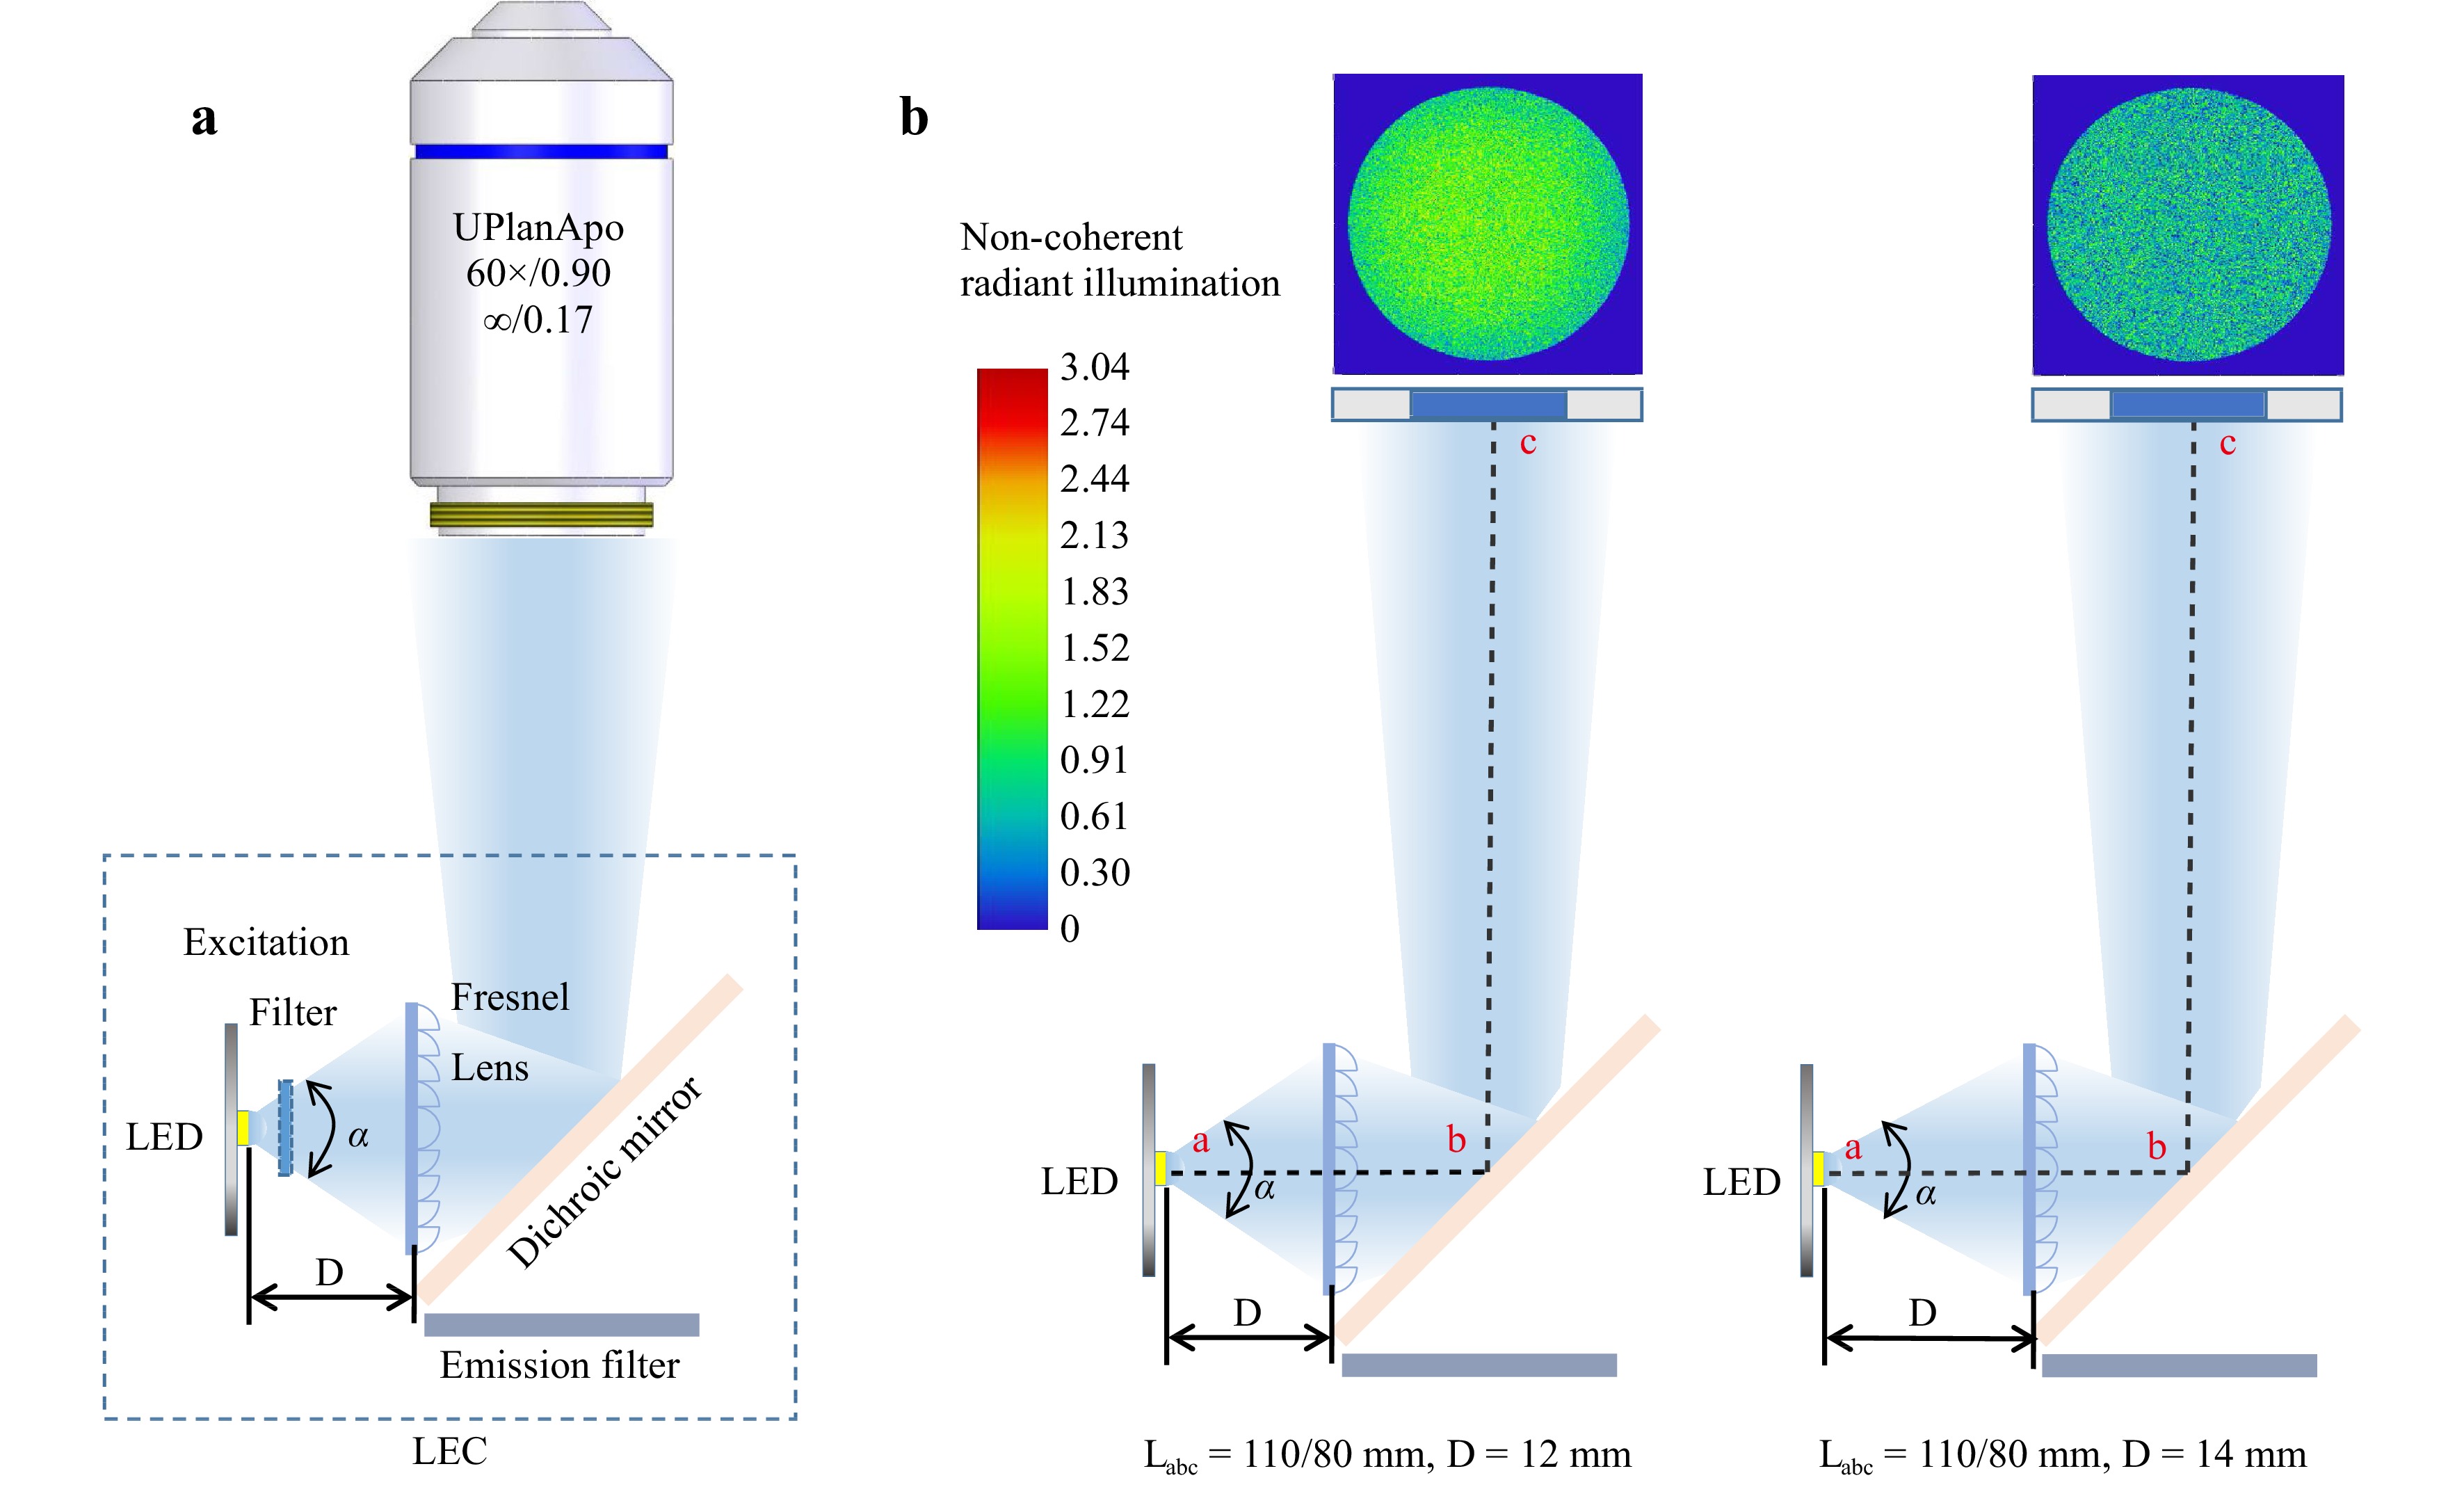
Fig. 1 Zemax simulation to optimize the excitation power density. a The LEC is mounted inside a microscope filter cube with the excitation light collimated by a Fresnel lens and reflected by a dichroic mirror into the objective lens. b Changing the LED radiation angle α and the distance D between the LED and the Fresnel lens in Nexcope NE900 (Labc = 110 mm) and Olympus IX73 (Labc = 80 mm) microscope models.
As microscopy manufacturers adopt different designs, two typical distances from the Fresnel lens to the entrance pupil of the objective lens, for example, LNexcope NE900 = 110 mm and LOlympus IX73 = 80 mm, were investigated here. With the LED power set to 1 W (Note: Owing to the limited space of the fluorescence filter cubes and LED heat dissipation, the optical power of a single LED can hardly exceed 2 W) and using the three typical focal lengths, f = 12, 10, and 8 mm, Fig. 2 summarises the simulation results of the power delivery efficiencies as a function of the LED radiation angle α and the distance D between the LED and Fresnel lens for the Nexcope (upper panel) and Olympus (lower panel) designs, respectively. The OSRAM official website provided the LED simulation files with different radiation angles (20°–150°). By altering the parameters D (Dmin – Dmax = 5–15 mm) for the two types of microscopes (LOlympus IX73 = 80 mm and LNexcope NE900 = 110 mm), we obtained the power integral at the entrance pupil area (here we used a diameter of 6 mm). We found that a shorter focal length of the Fresnel lens favoured the design within the limited mounting space inside the filter cubes. However, the shorter focal length also resulted in a lower excitation power.
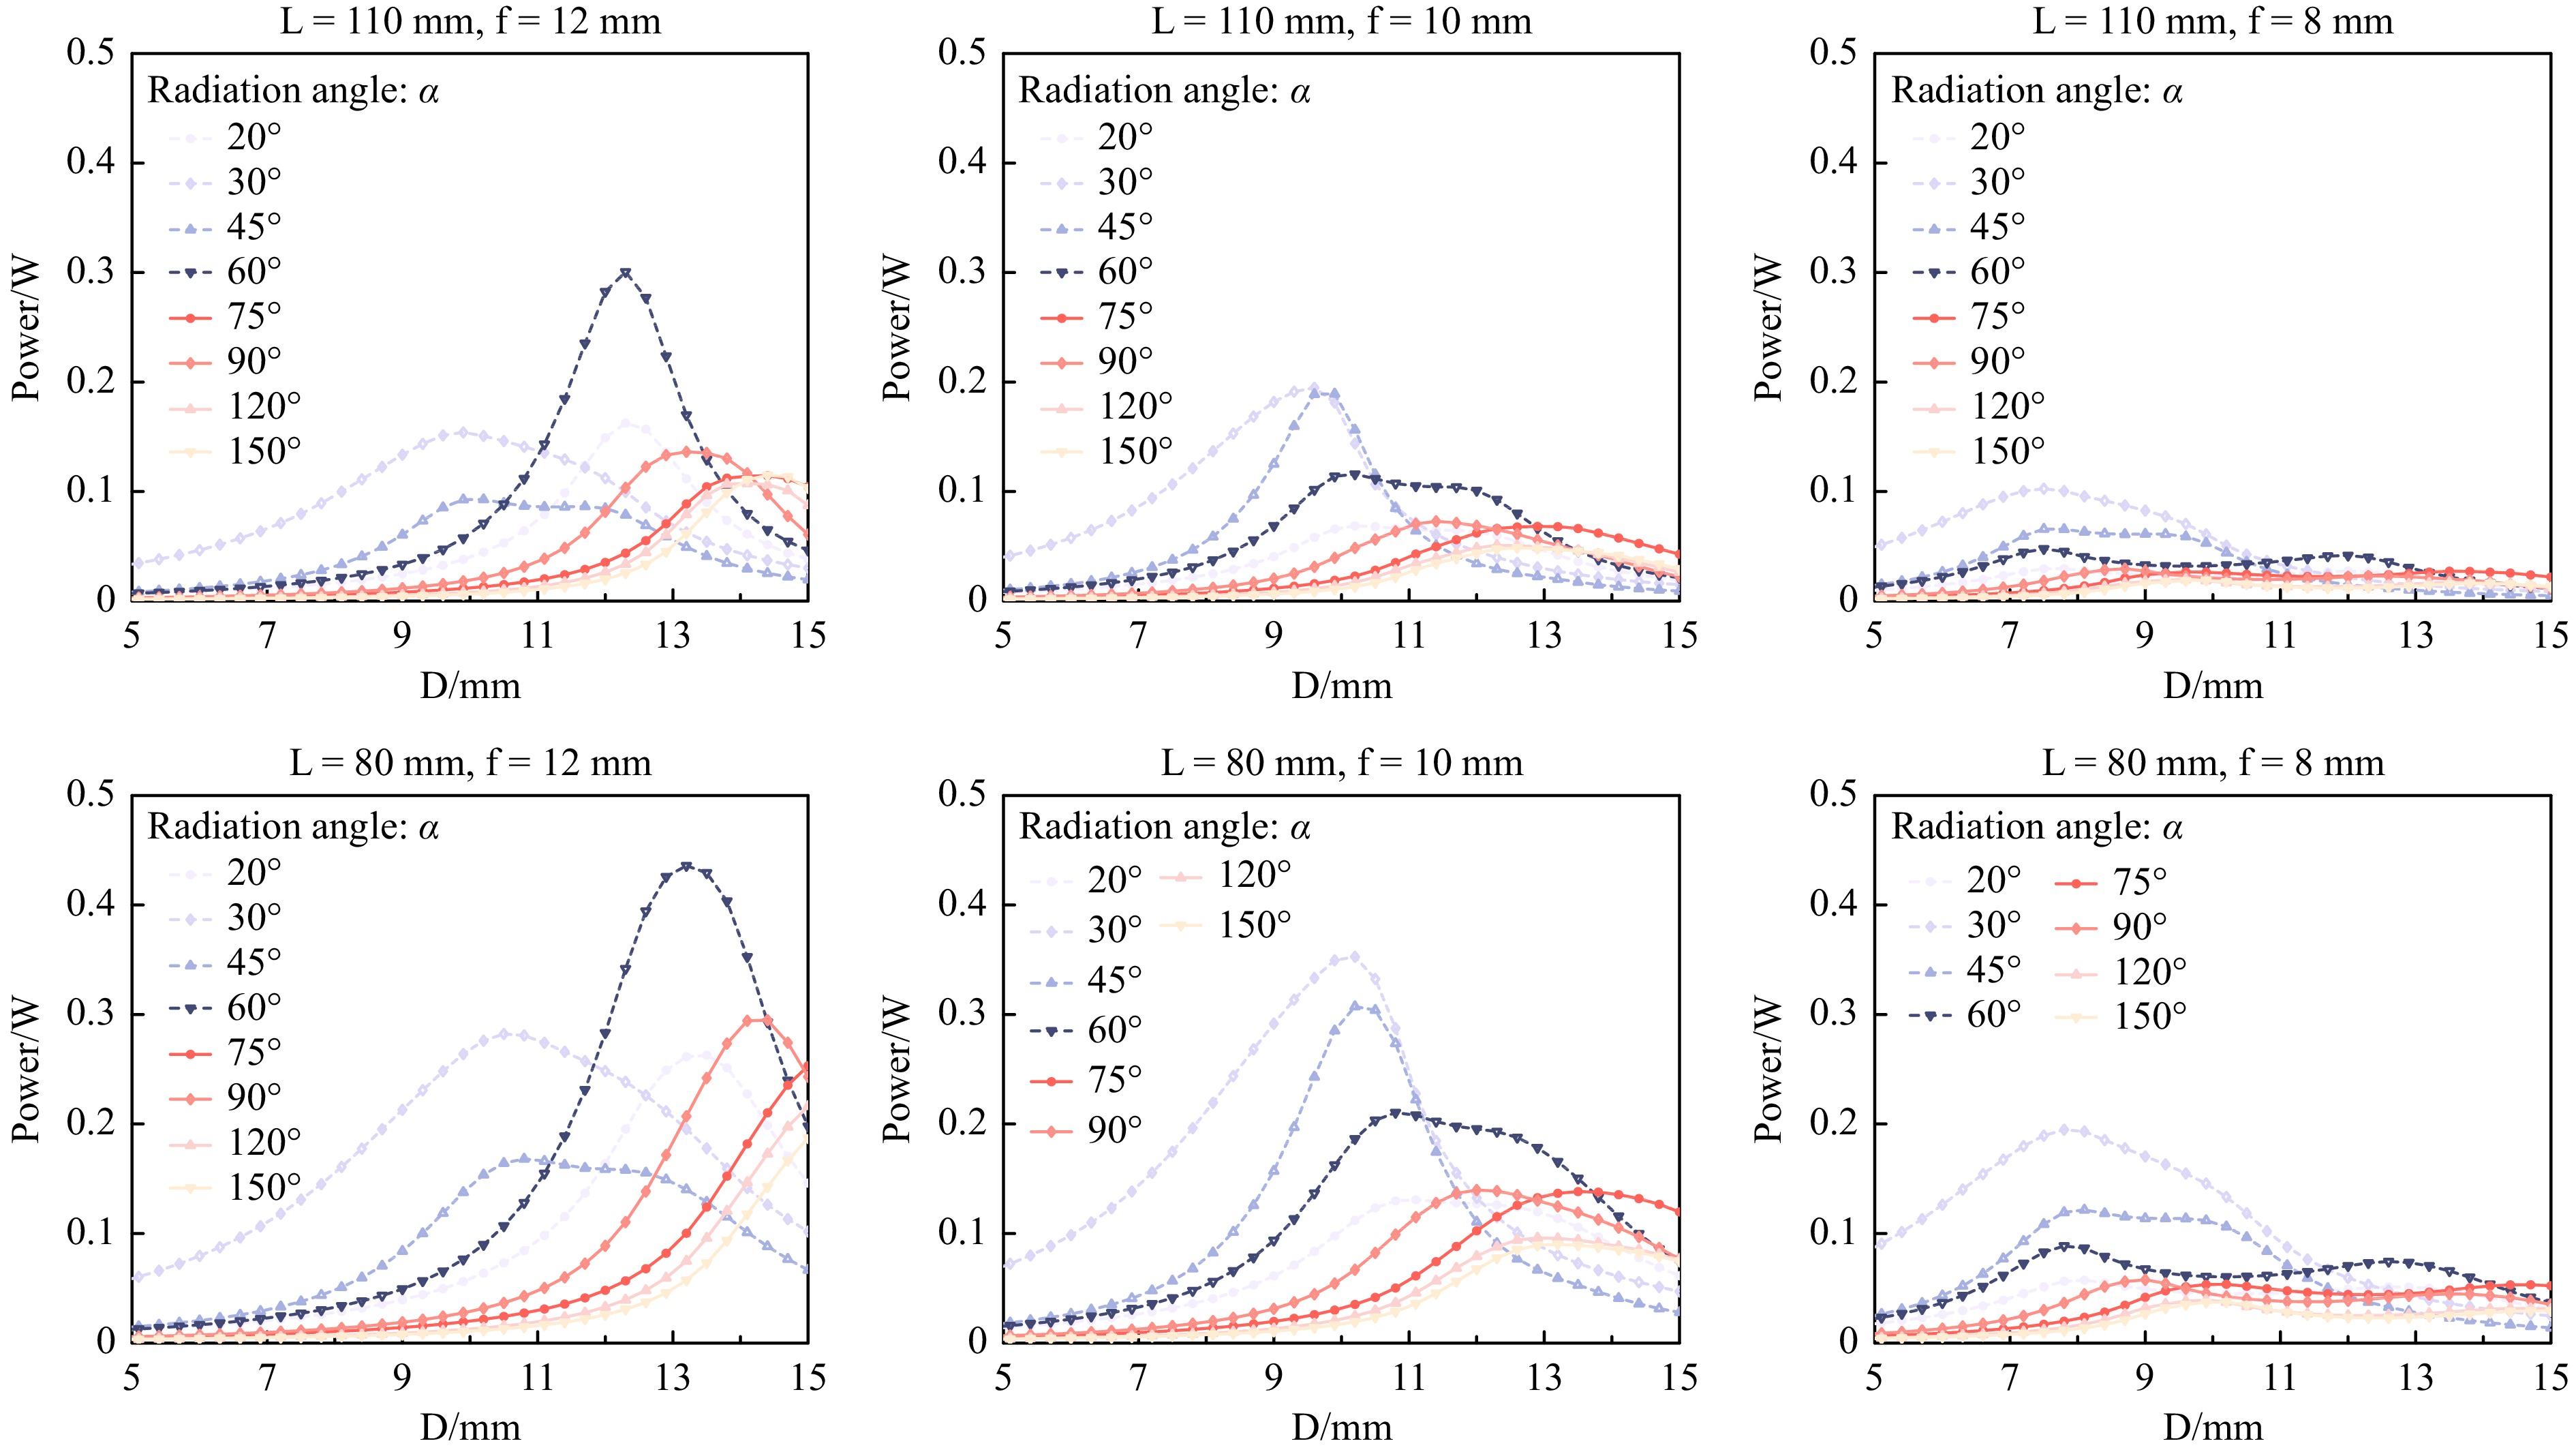
Fig. 2 Simulation analysis to optimize the LED excitation power delivery efficiency. The distances (L) between the Fresnel lens and the entrance pupil of the objective lens for Nexcope NE900 (upper panel) and Olympus IX73 (lower panel) microscopes are 110 and 80 mm, respectively. Using three typical Fresnel lenses, f = 12, 10, 8 mm, the best mounting distance D can be obtained when D is close to f.
Moreover, the highest power integral can be obtained when D is close to f. Therefore, we chose f = 11.5 mm as the Fresnel lens while D is 11.87 mm (Supporting Information Figure S1). Currently, the main manufacturers of fluorescent microscope excitation filter cubes are Zeiss, Leica, Nikon, and Olympus. Other manufacturers’ fluorescent microscope excitation filter cubes are generally the same size as those of the above four companies. Here, we demonstrate that high-efficiency illumination can be achieved within a 15 mm mounting distance (Figs. 1, 2); therefore, the LEC design should meet the above microscope installation requirements.
Selection of LEDs and Measured Optical Power. Fig. 3a shows the four typical LEDs used here, commercially available from NICHIA (360–370 nm 120°) and Yingfeng Opto-Electronic Co. (480–485 nm 60°, 540–560 nm 20°, 620–640 nm 20°). The wavelengths of the LEDs matched well with the four fluorescence channels filtered by a mercury lamp (OSRAM HBO 100W/2) through an excitation filter (Fig. 4). The LECs were mounted on a Nexcope NE900 microscope to measure the excitation powers after the three typical objective lenses (Nexcope PlanF S-Apo 20× NA = 0.5, Nikon Plan Fluor ELWD 60× NA = 0.6, Nexcope NIS 60× NA = 0.8). Fig. 3c shows the results of the final spectral measurement. To clearly show the advantage of the LEC design, we compared the power intensities of the four channels from the mercury lamp and summarised them in Table 1. Through the 20× objective lens, the optical power efficiencies of the four channels of the LECs were 97, 52, 66, and 341 times those of the mercury lamp, respectively. Similarly, through the 40× objective lens, the optical power efficiencies are 53, 60, 85 and 313 folds, respectively, and through the 60× objective lens, the optical power efficiencies are 44, 57, 84 and 361 folds, respectively, compared with those of the four filtered channels using a mercury lamp. Although objective lenses have different transmittances according to their spectral bands, LECs were at least one order of magnitude more efficient than mercury lamps (Table 1). In the red channel, particularly when it is difficult to achieve high-power excitation using a mercury lamp, the required power can be reached using the LEC.
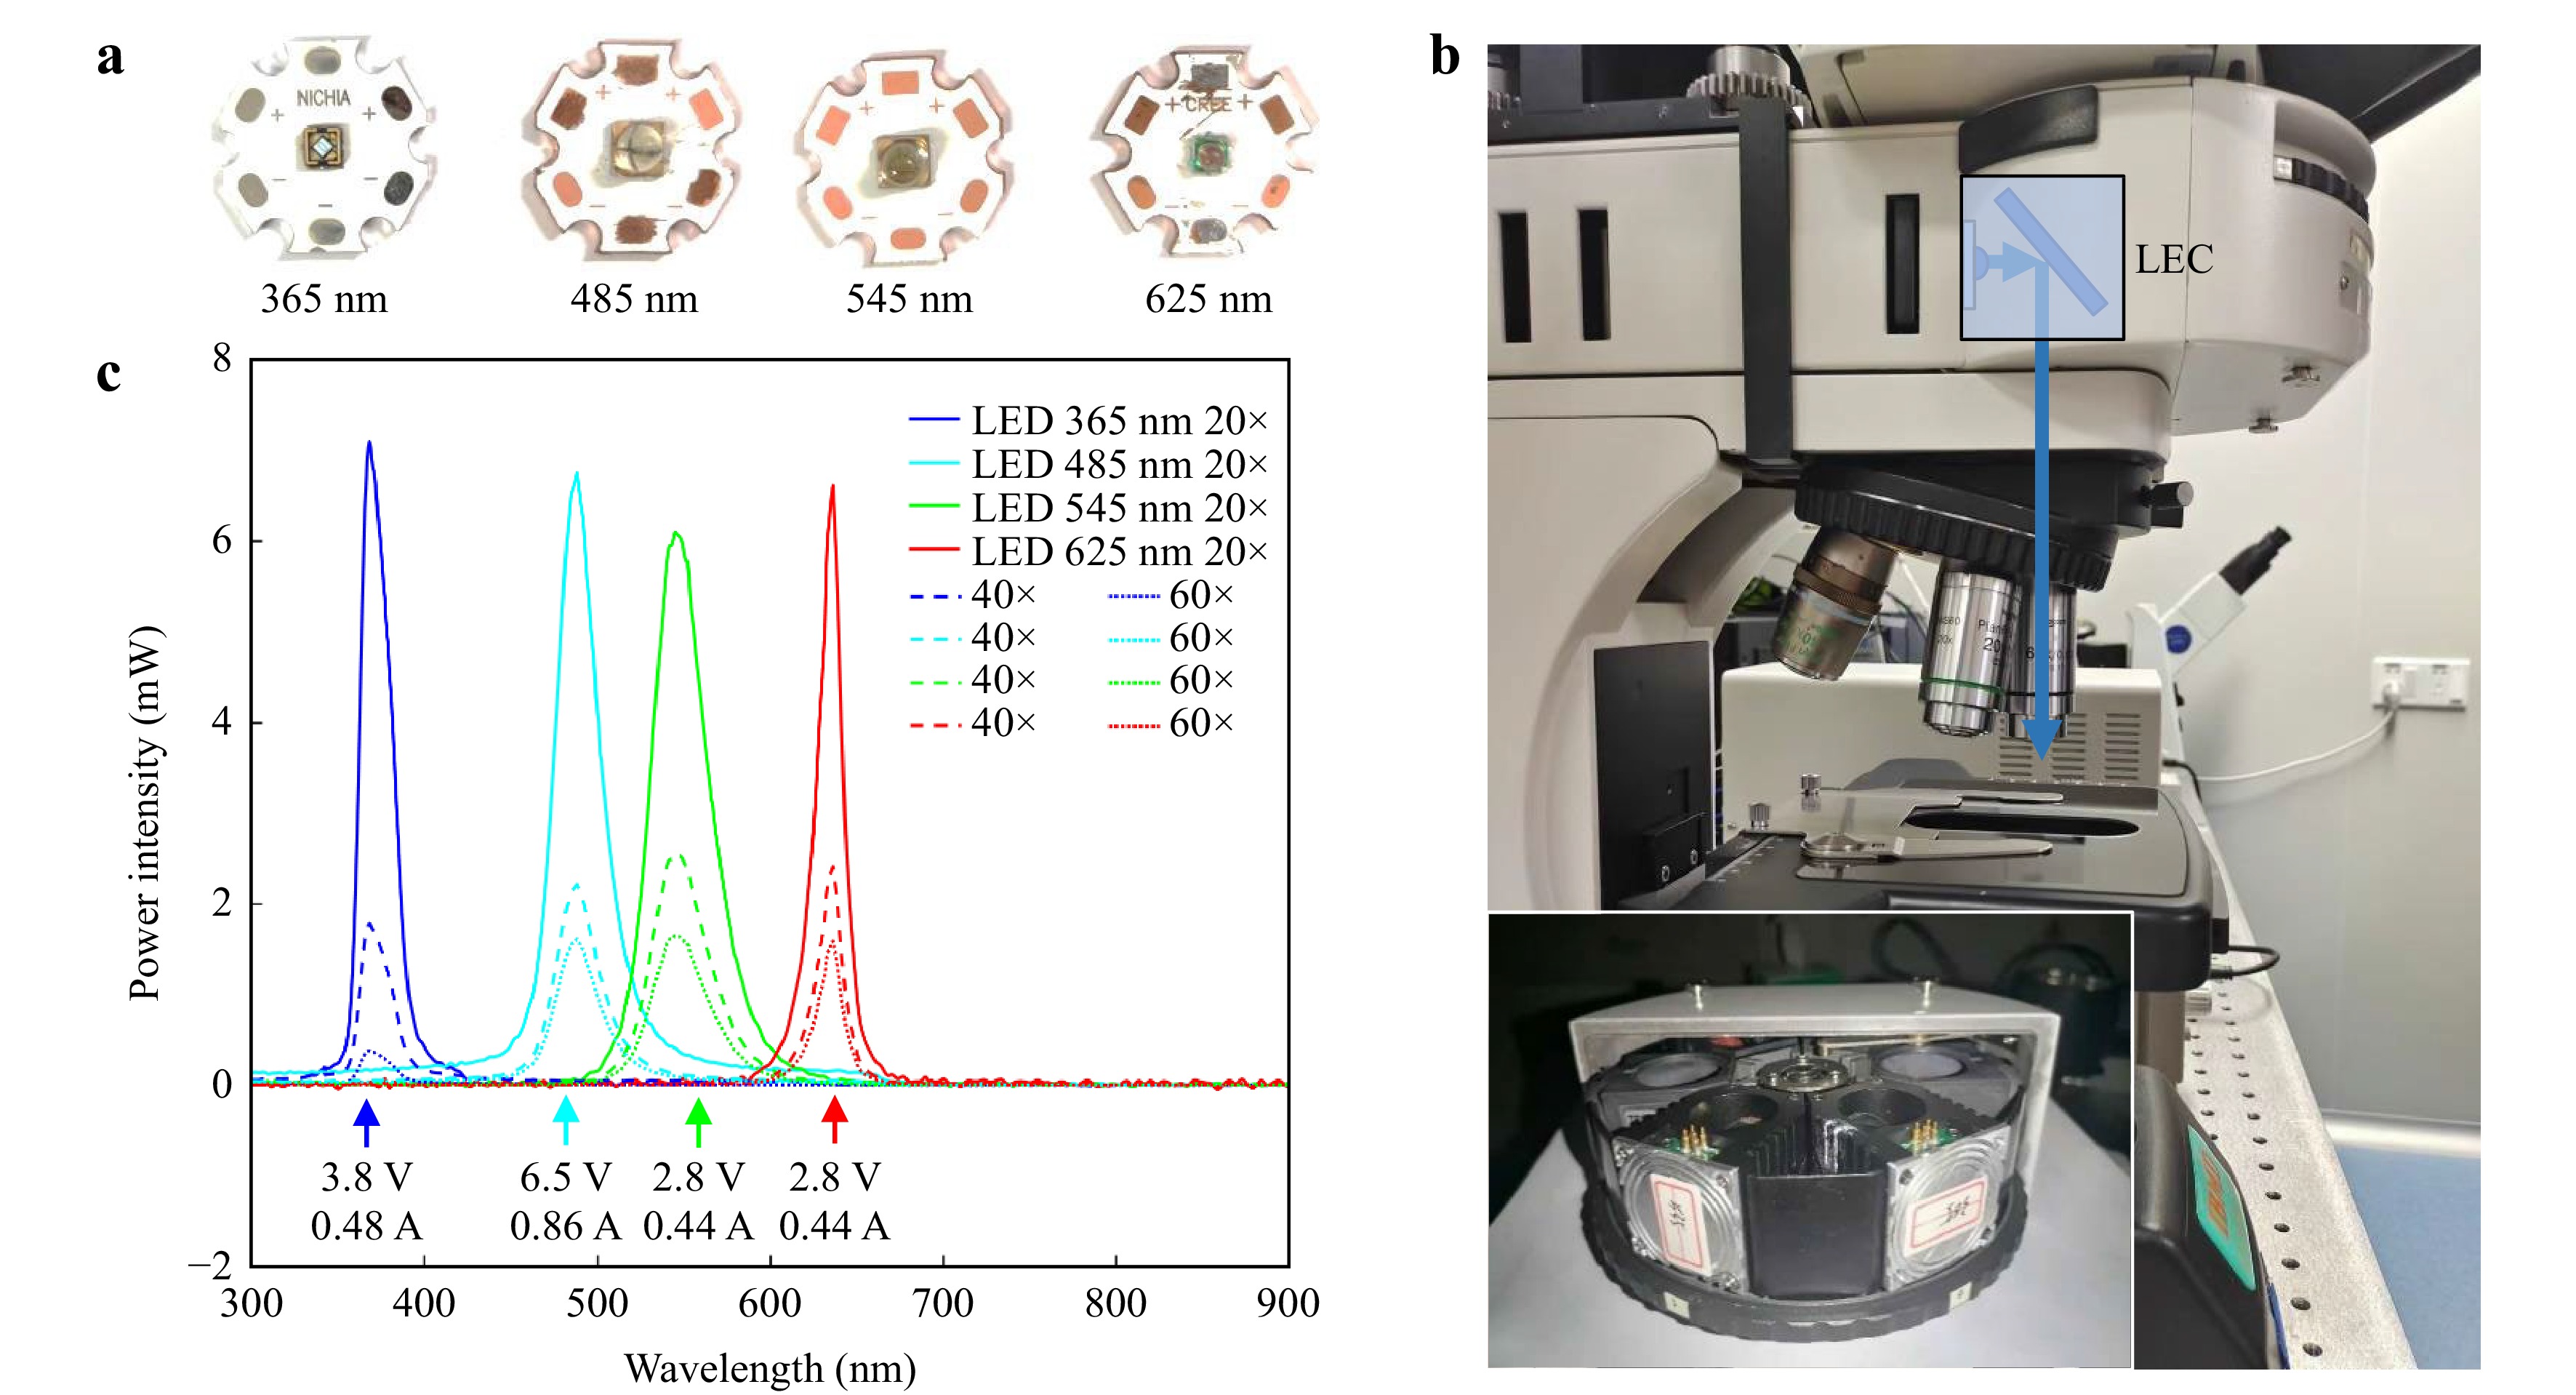
Fig. 3 LEC integrated components and maximum power test. a 365, 485, 545, and 625 nm LED (NICHIA U365 120°, Yinfeng Opto-Electronic Co. Ltd., 480–485 nm 60°, 540–560 nm 20°, 620–640 nm 20°). b LECs were mounted in Nexcope NE900 fluorescence microscope (L = 110 mm, Objective lens: Nexcope PlanF S-Apo 20× NA = 0.5, Nikon Plan Fluor ELWD 60× NA = 0.6, Nexcope NIS 60× NA = 0.8). c The experiment result of the four test LEDs. More detailed information is in Table 1.
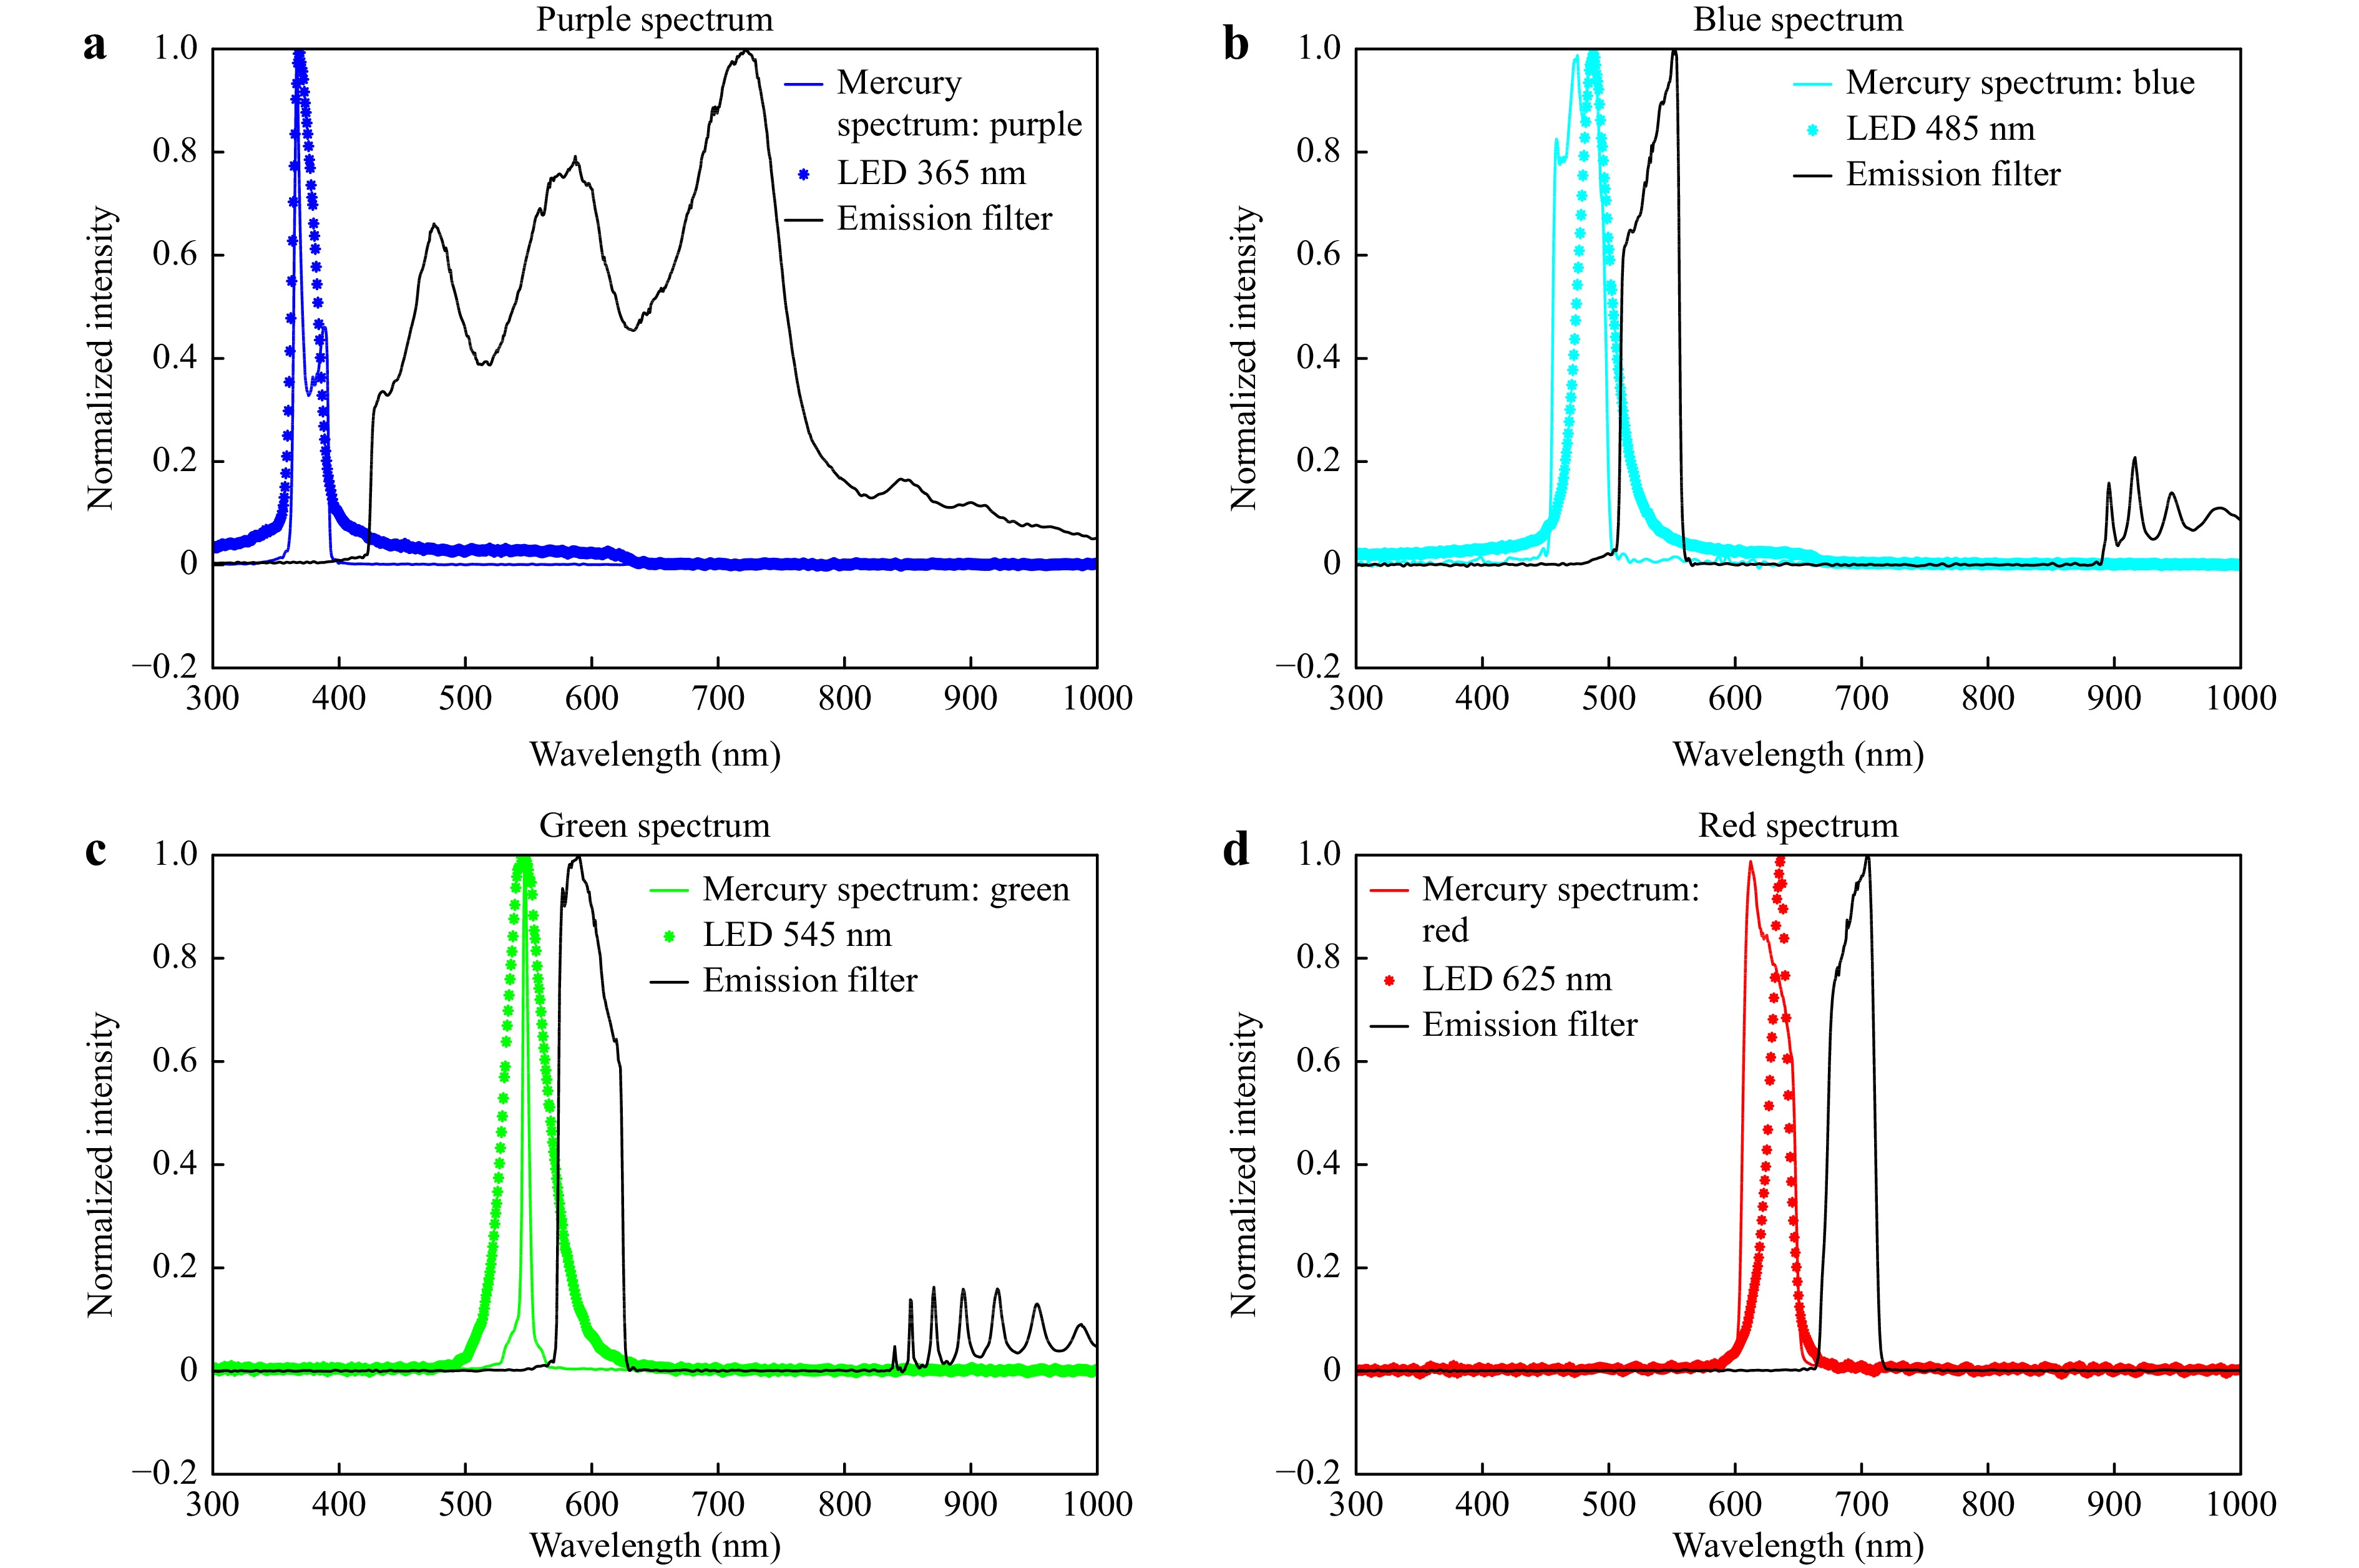
Fig. 4 The excitation spectrum and emission transmission curve of fluorescence filter cubes and LECs. a The purple solid line is the mercury lamp spectrum, the purple dashed line is the 365 nm LED spectrum, and the solid black line is the emission transmission curve. b The blue solid line is the mercury lamp spectrum, the blue dashed line is the 485 nm LED spectrum, and the solid black line is the emission transmission curve. c The green solid line is the mercury lamp spectrum, the green dashed line is the 545 nm LED spectrum, and the solid black line is the emission transmission curve. d The red solid line is the mercury lamp spectrum, the red dashed line is the 625 nm LED spectrum, and the solid black line is the emission transmission curve.
Light Source Conditions Rated electrical
Power(W)Optical power (mW)/
Efficiency/20×Optical power (mW)/
Efficiency/40×Optical power (mW)/
Efficiency/60×Mercury Lamp 375 nm 100 4.24 0.00424% 1.84 0.00184% 0.48 0.00048% 477 nm 2.32 0.0023% 0.67 0.00067% 0.41 0.00041% 545 nm 7.58 0.00758% 2.48 0.00248% 1.55 0.00155% 625 nm 1.58 0.00158% 0.64 0.00064% 0.36 0.00036% 365 nm LED 1.824 7.4 0.41% 1.78 0.098% 0.38 0.021% 485 nm LED 5.590 6.76 0.12% 2.21 0.040% 1.61 0.029% 545 nm LED 1.232 6.11 0.50% 2.55 0.21% 1.65 0.13% 625 nm LED 1.232 6.62 0.54% 2.41 0.20% 1.59 0.13% Table 1. The measured optical powers of mercury lamps and LECs and their optical delivery efficiencies after three typical objectives.
Selection of Emission Bands. We measured the spectra of four fluorescence excitation channels in a Nexcope NE900 fluorescence microscope, as shown in Fig. 4, and the excitation spectrum peaks were at 375, 477, 547, and 625 nm. To compare the imaging performance of the mercury lamp and LECs, we selected four high-power LEDs (365, 485, 545, and 625 nm). As the spectra of LEDs may often cover more than 80 nm (Fig. 4a−c) and the emission peaks may be shifted, a spectrometer was first used to characterise the spectra of the LEDs. Our compact LEC design also allows an excitation filter to be added in front of the Fresnel lens to purify emissions. As LEDs emit in a narrow spectrum with a well-defined wavelength range, a simplified design of either short-pass excitation filters or long-pass dichroic mirrors can be used to reduce the complexity and cost of the microscopy system. Moreover, emission filters can be saved by using time-gated luminescence microscopy.
Mechanical Design. Next, we tested the LEC design using commercial fluorescence microscopy. Fig. 5a and Supporting Information Figure S1 show the LEC designs based on the U-MF2 and U-FF modules mounted on an Olympus IX73 fluorescence microscope and a Nexcope NE900 microscope, respectively. The optimal mounting distance, D, can be adjusted by adjusting the thickness of the gasket in front of the Fresnel lens (see Fig. 5a, b). In addition, depending on the LEDs’ spectral purity and the fluorescent dyes’ Stokes shift, an emission filter and an excitation filter can be added. The distance between the LED and Fresnel lens was 13.2 mm, slightly different (~0.3 mm) from the simulation result in Fig. 1a.
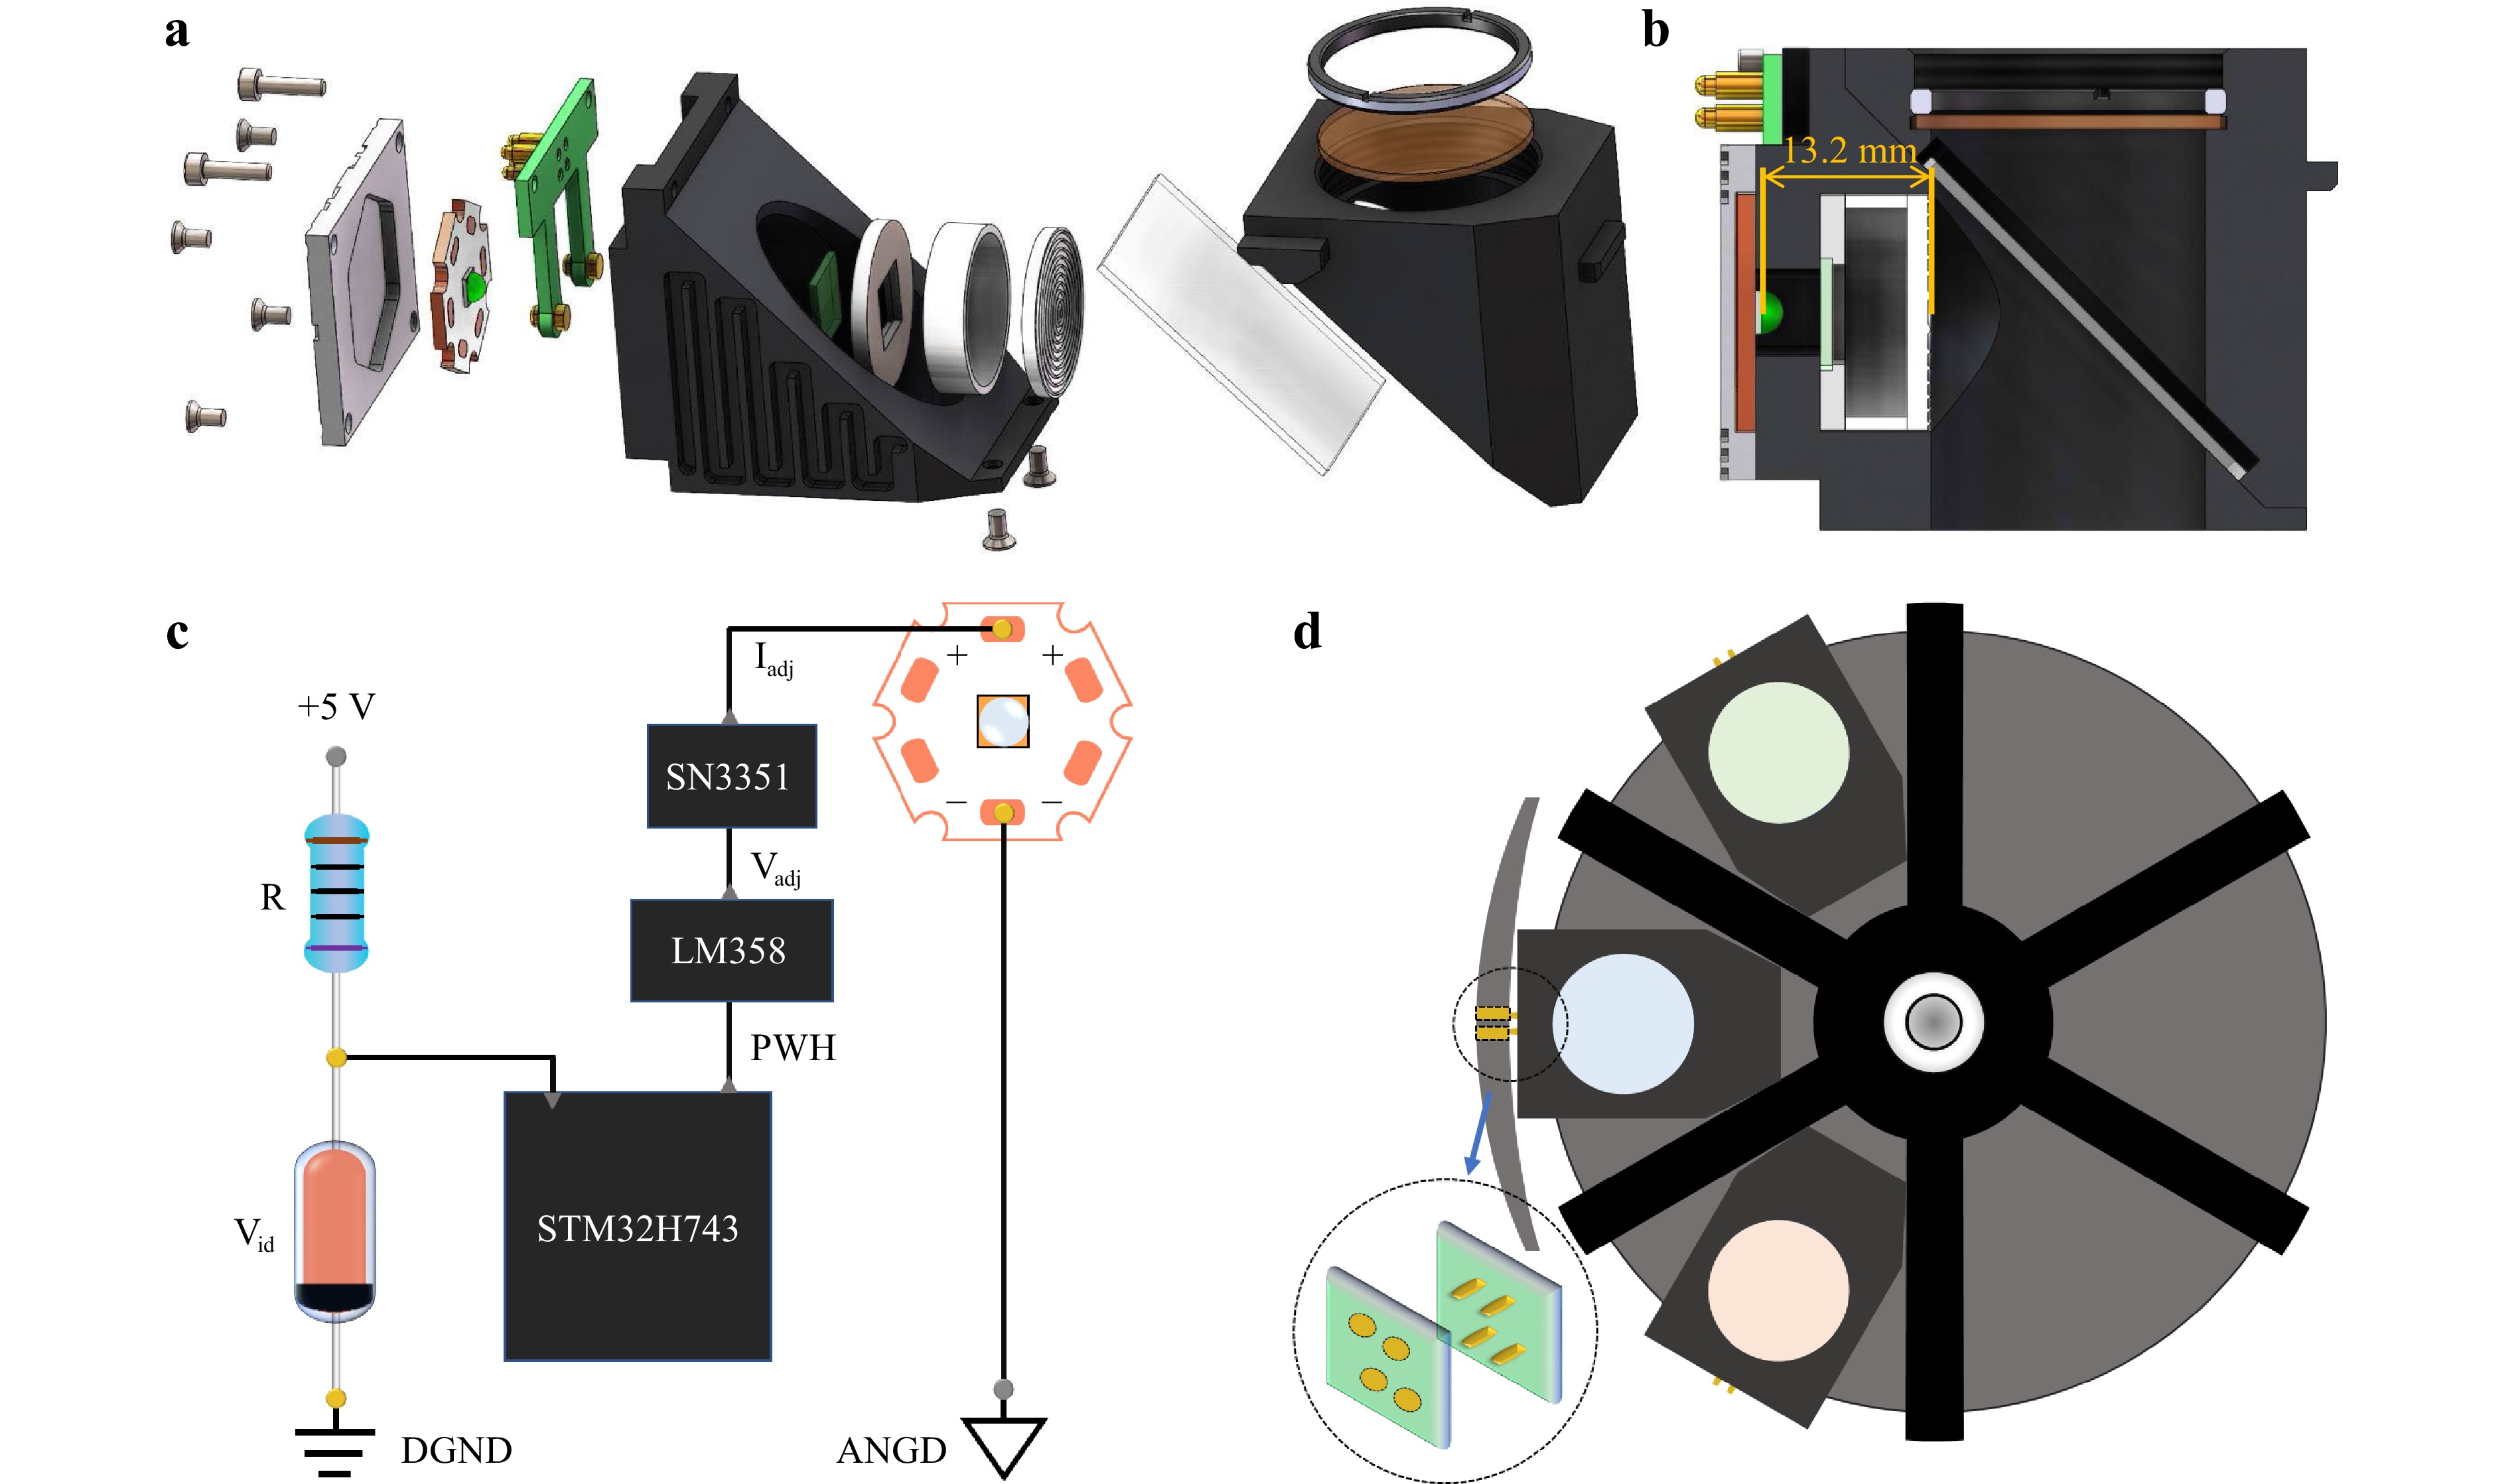
Fig. 5 LEC assembly details and electrical controller. a the assembly of LEC components designed for Olympus IX73 fluorescence microscope. b the schematic layout of the assembled LEC. c The electronics circuit and control module to power LEC that allows either continuous or pulsed modes. The driver can automatically recognize the type of LEDs and adopt the appropriate voltage of Vadj and current Iadj. d The schematic layout shows that multiple LECs can be installed inside the fluorescence microscope.
Electrical Controller. A LEC driver is designed for LEDs’ identification and control. When the turntable for the fluorescent filter cubes selected one of the LEC modules, the pair of golden electrodes (shown in Fig. 5d) touched each other to power the LEC in standby mode. Fig. 5c shows the circuit control principle. With Vid as the voltage across the Zener diode, each LED type can be identified by a Zener diode with a specific voltage setting. An advanced RISC machine (ARM) STM32H743 was used as the microcontroller of the LEC, which recognised the voltage across the Zener diode and generated a corresponding PWM signal to the LM358 module with adjustable voltage Vadj that controls the SN3351 module to generate a corresponding current Iadj to power a specific type of LED. This design provides a great degree of switching ability between multiple LECs used in a fluorescence microscope via the golden touch positions, as shown in Fig. 5d. It also produces a suitable operating current and modulation frequency for the excitation pulses that can be synchronised with the optical chopper for time-gated imaging.
-
We evaluated the performance of LEC microscopy using DAPI-stained nuclei of breast cancer cells BT474 (Fig. 6a), FITC labelled PD-L1 antigens of BT474 (Fig. 6b), the Cy3 labelled mouse kidney (Fig. 6c), and Cy5 stained MCF-7 cells (Fig. 6d). All biological tissue samples were subjected to standard immunofluorescence staining (Supporting Information Supplementary Note 1). The maximum excitation spectrum peak of DAPI is at 356 nm, which matches one of the mercury lamp spectrum peaks at 364 nm and the LED emission peak at 365 nm; the emission spectrum peak of DAPI is at 458 nm27. The excitation and emission spectrum peaks of FITC were observed at 498 and 518 nm, respectively. The excitation and emission peaks of Cy3 were observed at 554 and 565 nm, respectively. The excitation and emission peaks of Cy5 were observed at 645 and 665 nm, respectively. Fig. 6 shows the comparisons of fluorescence images collected by the LEC and the mercury lamp fluorescence microscope under excitation from UV to red. The clearly enhanced contrast was achieved by the LEC setup when the spectrum of the dye redshifted, for example, Cy5 with the excitation peak at 645 nm, as it is difficult for the mercury lamp to deliver sufficient power density, compared with the LED at 625 nm.
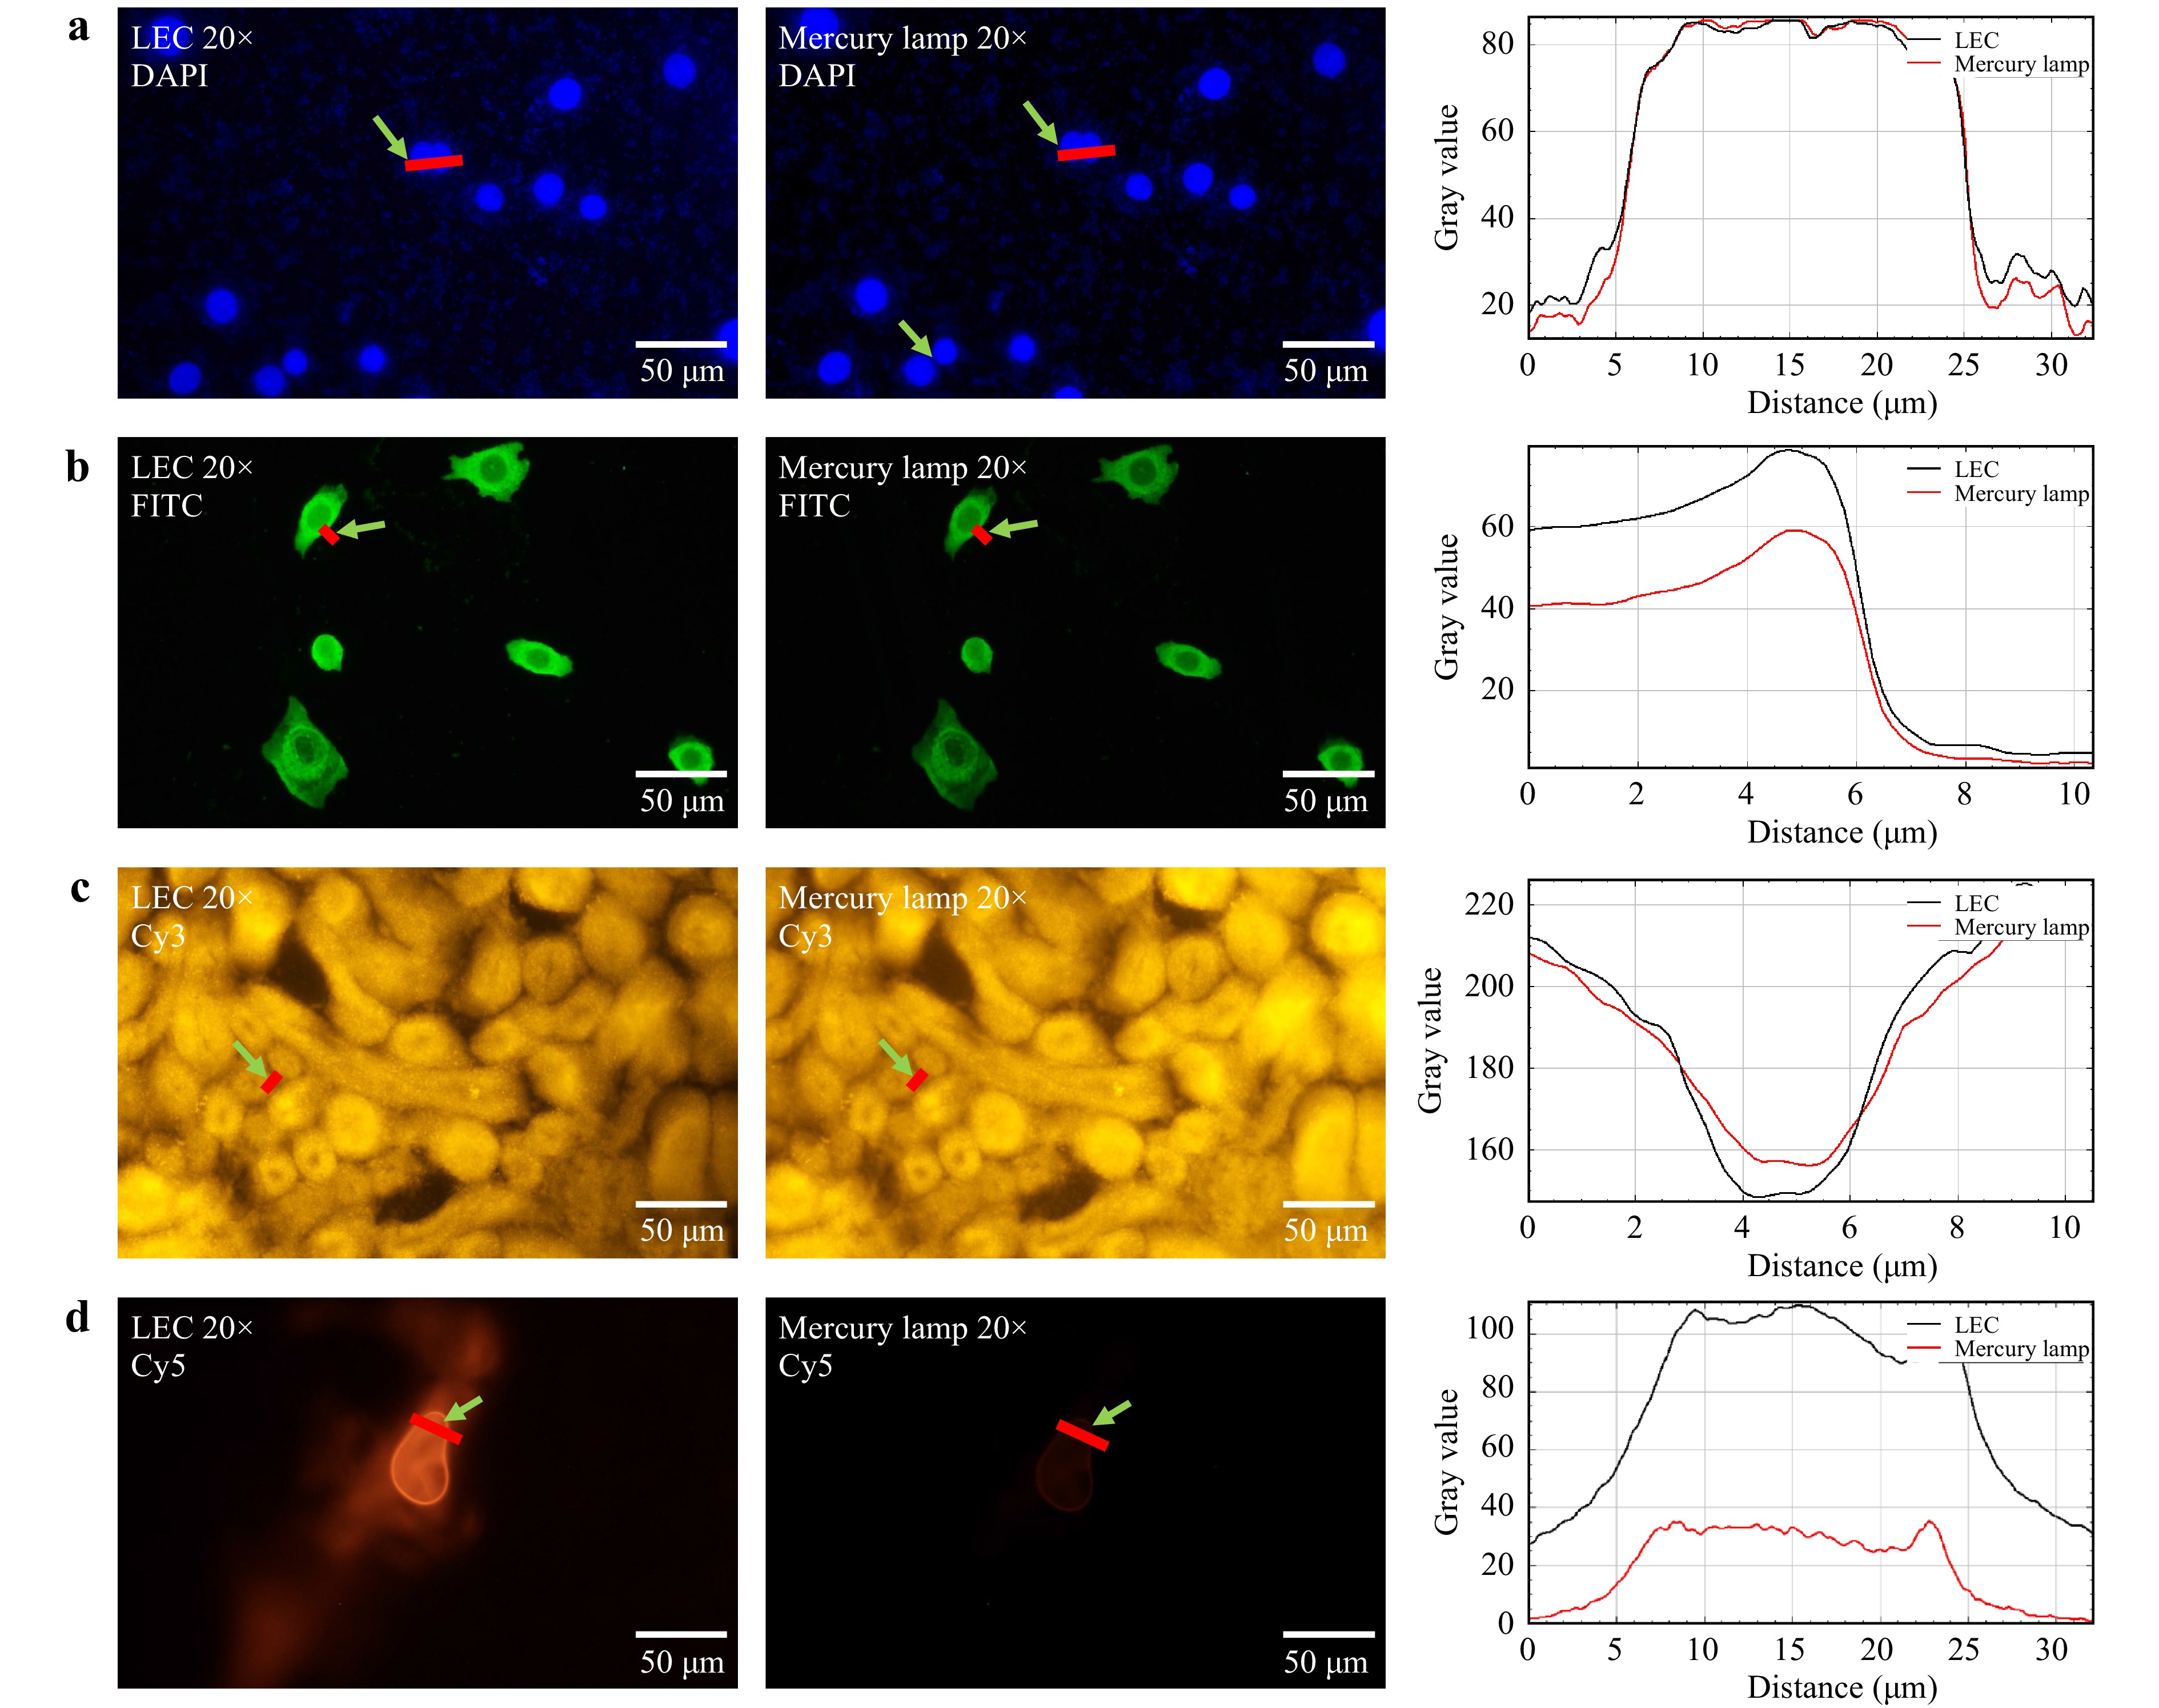
Fig. 6 Fluorescence imaging comparing LECs and mercury lamp excitation with 20X objective. a DAPI labelled nuclei of breast cancer cells BT474 with 20 ms exposure time. b FITC labelled PD-L1 antigens of breast cancer cells BT474 with 200 ms exposure time. c Cy3 labelled mouse kidney with 143 ms exposure time. d The Cy5 labelled MCF-7 cell with 300 ms exposure time. Each group was illuminated by mercury and LEC, respectively, and collected by E3CMOS02300KPA camera (Touptek Photonics Co. Ltd.).
Time-Gated Luminescence Microscopy Imaging of Breast Cancer Cells BT474 and SKBR3 Labelled by Eu3+ and Tb3+ Complexes. Time-gated luminescence microscopy imaging can remove autofluorescence and short-lived fluorescence signals to achieve background-free image collection28. As the lifetime of DAPI is on the nanosecond scale and that of long-lived lanthanide probes is in the range of tens of microseconds to a few milliseconds29,30, we can selectively remove the signal of DAPI and autofluorescence by adjusting the delay time between the LED pulse and the time-gated imaging window, as illustrated in Fig. 7. A detailed schematic of the time-gated luminescence detection technique is shown in Supporting Information Supplementary Figure S2. In our previous work, we described the construction of a time-gated luminescence microscope and characterised its performance under UV excitation31,32. The excitation spectrum band of the terbium (Tb3+) complex is typically at ~300–350 nm, and the europium (Eu3+) complex can typically be excited below 380 nm33−35. Here, we changed the excitation light source to 340 nm LEDs (Yinfeng Opto-Electronic Co. Ltd., 335–345 nm 120°, FWHM: 340–350 nm) and used the LEC driver to realise circuit control (Fig. 7d). The optical chopper and LEC were synchronized to 2000 Hz with a cycle duration of 500 μs. When using a 0 μs delay, the fluorescence signal of DAPI and long-lived luminescence probes can be detected by a colour sCOMS camera (Fig. 7a). When the delay time was set to 20 μs, because of the rapid rotation of the chopper blade to time-gate the short-lived DAPI fluorescence and other background autofluorescence, only long-lived signals remained (Fig. 7b). Breast cancer cell lines BT474 and SKBR3 were labelled using mRNA smFISH protocols and Chromosome 17 mitoses DNA FISH protocols, respectively (Supporting Information Supplementary Note 1). A Gaussian function was used to fit the region of interest (ROI) to calculate the full width at half maximum (FWHM) (Fig. 7c). Compared to no time-gated luminescence, using time-gated luminescence led to a 4.8-fold and 3.6-fold improvement in FWHM, respectively. Moreover, owing to the flexible design of the LEC powered by the rapidly pulsed current, our LEC driver arbitrarily adjusts the chopper and LEC frequency, pulse width, and excitation intensity on demand by other long-lived fluorescent and luminescent probes.
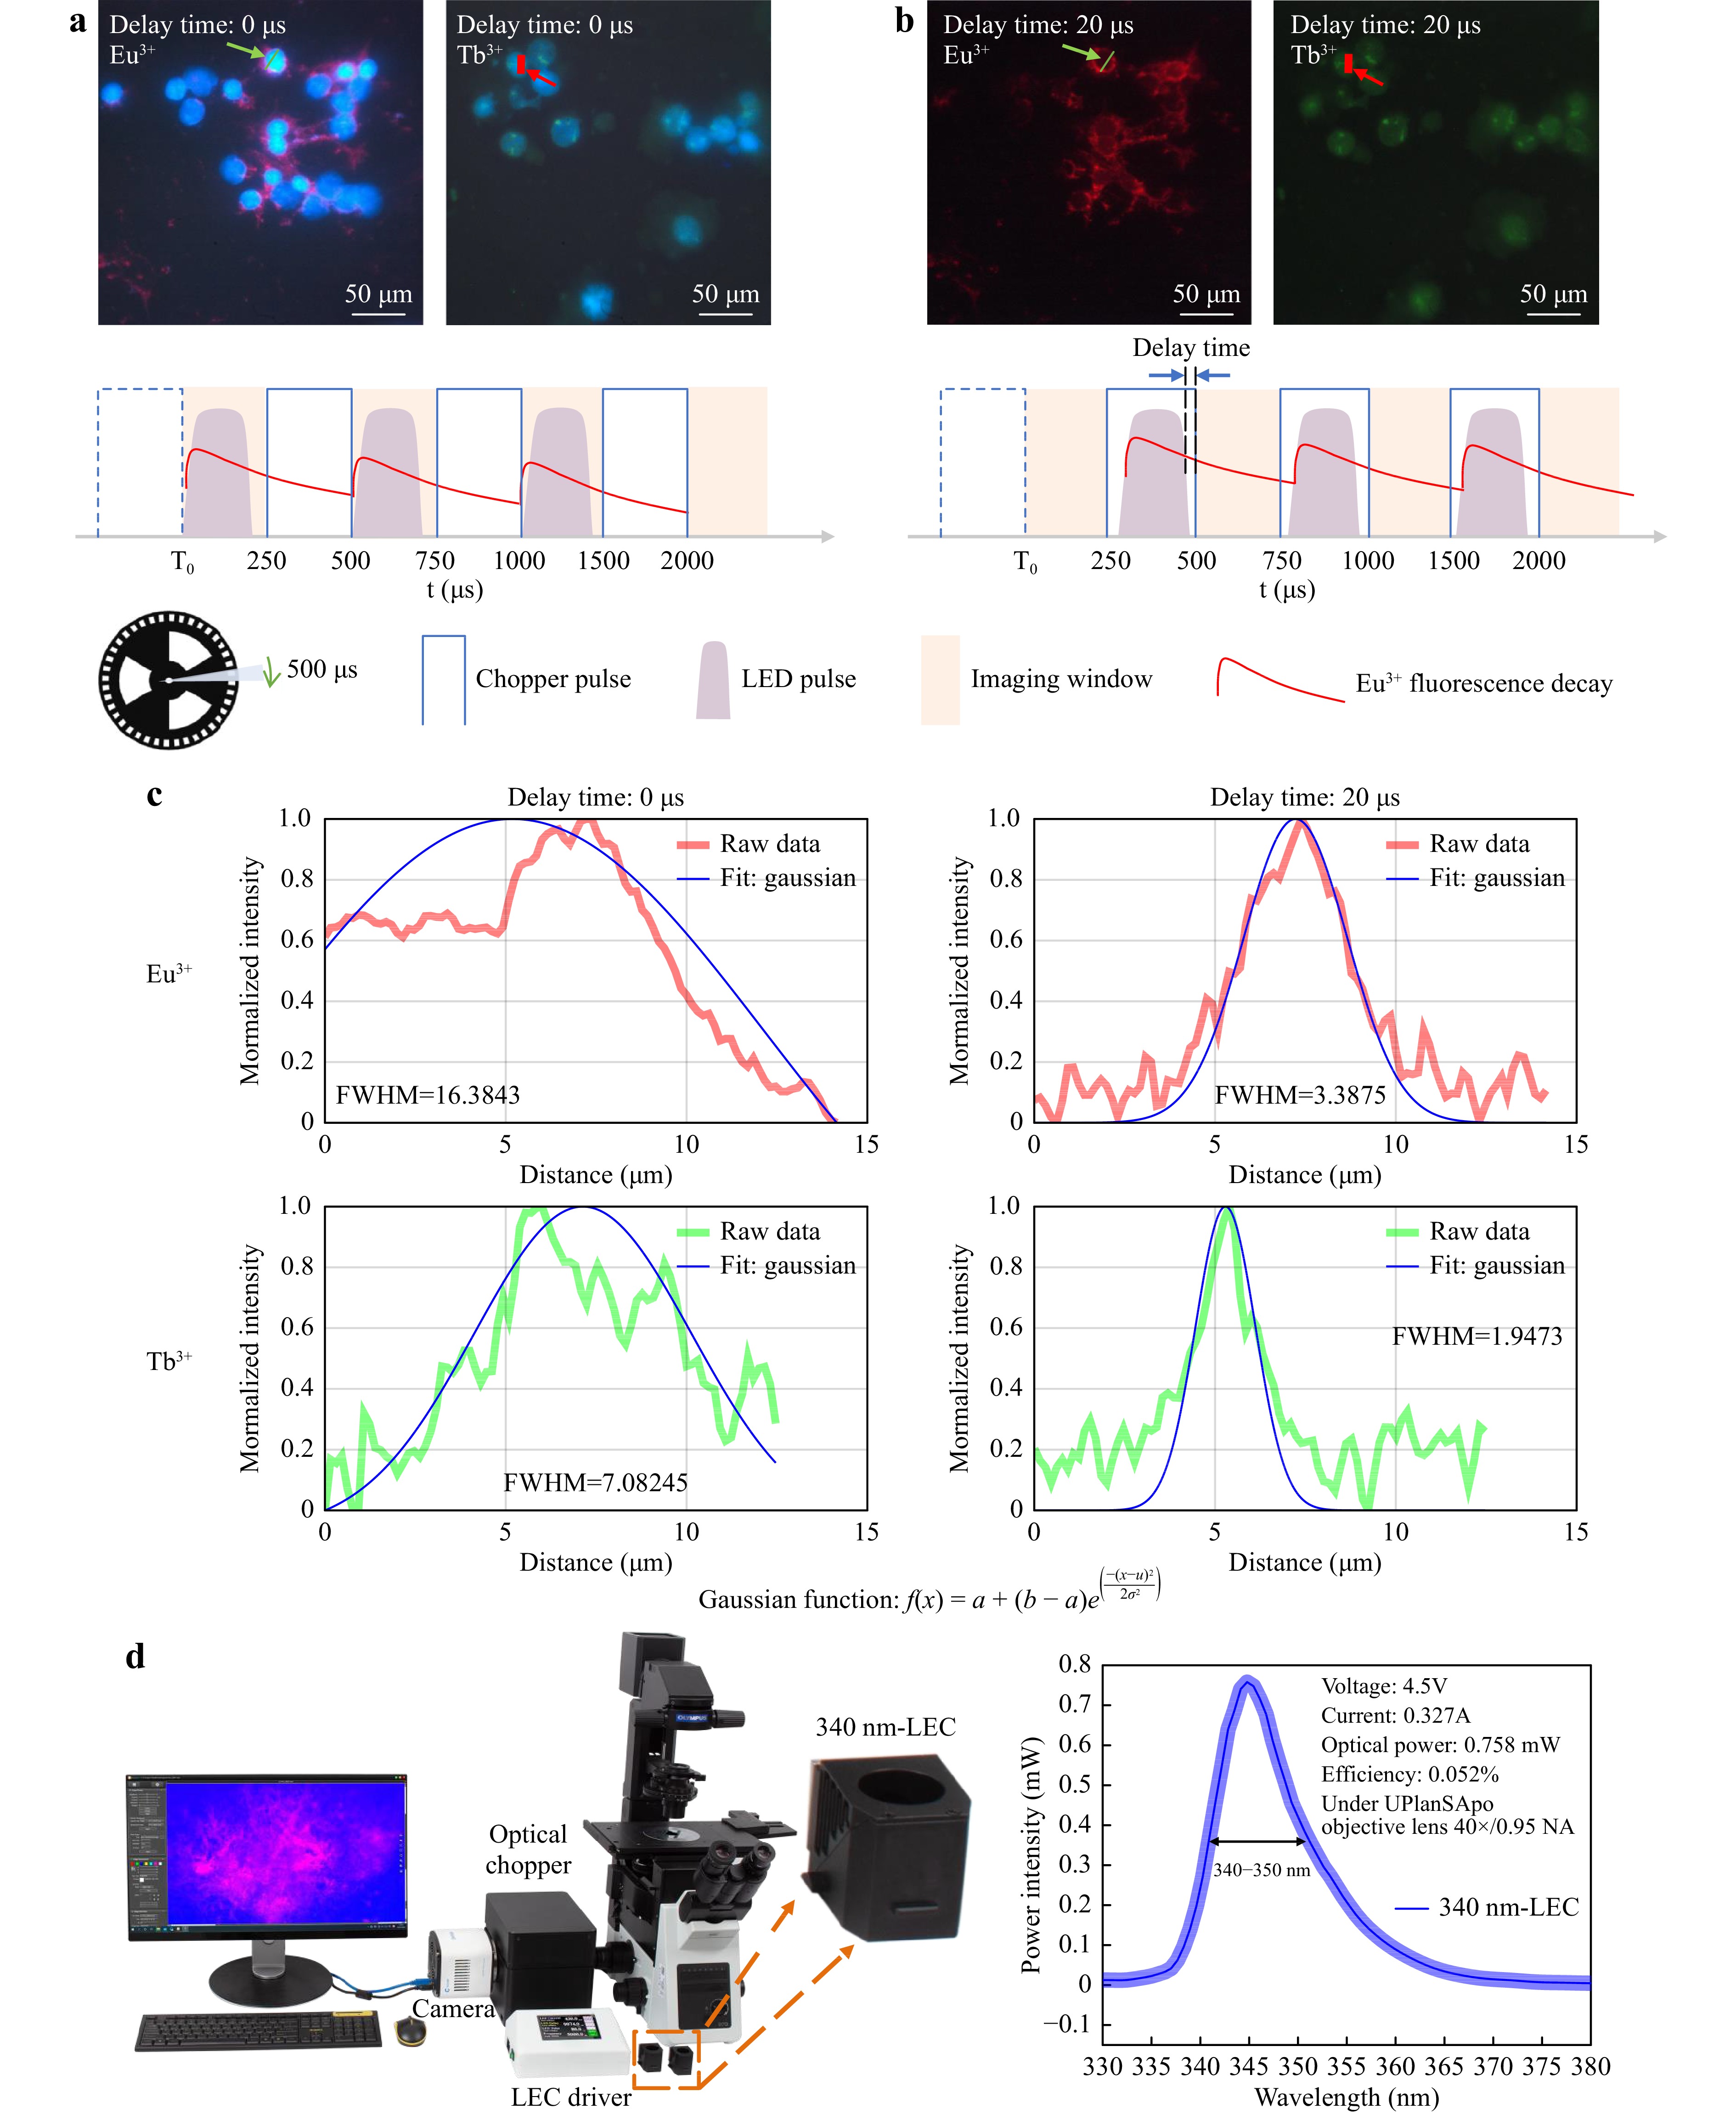
Fig. 7 Time-gated luminescence microscopy modality for background-free imaging of long-lived fluorescence labelled cells. a First fluorescence image is DAPI labelled nuclei, and Eu3+ labelled mRNA of breast cancer cells BT474 and the second fluorescence image is DAPI labelled nuclei, and Tb3+ labelled DNA of breast cancer cells SKBR3 under 0 μs delay time. b The comparison time-gated luminescence image under 20 μs delay time. Only the signal from long-lived fluorescence remained. c A Gaussian function was used to fit the region of interest (ROI) to calculate the full width at half maximum (FWHM). For Eu3+ images, the FWHMs are 16.3843 and 3.3875 of 0 μs and 20 μs delay time. For Tb3+ images, the FWHMs are 7.08245 and 1.9473 of 0 μs and 20 μs delay time. d The 340 nm LEC time-gated luminescence microscopy. Chopper and 340 nm LEC can be controlled synchronously by LEC driver.
-
In summary, we designed LECs by integrating LED, filters, Fresnel lenses, and dichroic mirrors into a filter cube for fluorescence microscopes. It has all the characteristics of LED: a long operation lifetime, small size, selectable excitation wavelengths, and low cost. Simulation analysis shows that the optimal mounting distance D can be limited to 15 mm by using a Fresnel lens to optimise the excitation delivery efficiency and optical power density of the specimen. Owing to the short mounting distance, we demonstrated that LEC can be installed in commercial microscopes as a simplified design for industry adoption. Experiments have shown that LEC can achieve widefield fluorescence imaging that covers a broad range of excitation spectra, from UV to far red. Especially for excitation wavelengths beyond 600 nm, it shows a higher excitation power to achieve remarkably enhanced contrast in fluorescence imaging, compared with the mercury lamp as the excitation source. Using our excitation driver, the LED’s voltage, current, and switching frequency can be arbitrarily adjusted for time-gated luminescence microscopy. Furthermore, LECs’ structure can be further upgraded to match a broad range of commercial fluorescent imaging devices, such as DMIRB, DM-i8, and DM-K for Leica microscope, TLV-TE2000 for Nikon microscope, U-MF2, and U-FF series for all kinds of Olympus microscopes. This solution provides easy access to industrial and biomedical end users in fluorescence microscopy.
-
The authors acknowledge the Shenzhen Science and Technology Program (KQTD20170810110913065 and 20200925174735005).
Contrast-enhanced fluorescence microscope by LED integrated excitation cubes
- Yuanhua Liu1,
- Xiang Zhang1,
- Fei Su1, 2,
-
Zhiyong Guo1, *, ,
 ,
, -
Dayong Jin1, 2, *, ,
- Light: Advanced Manufacturing 4, Article number: (2023)
- Received: 28 October 2022
- Revised: 15 February 2023
- Accepted: 15 February 2023 Published online: 31 March 2023
doi: https://doi.org/10.37188/lam.2023.008
Abstract: Fluorescence microscopy is a powerful tool for scientists to observe the microscopic world, and the fluorescence excitation light source is one of the most critical components. To compensate for the short operation lifetime, integrated light sources, and low excitation efficiency of conventional light sources such as mercury, halogen, and xenon lamps, we designed an LED-integrated excitation cube (LEC) with a decentralized structure and high optical power density. Using a Fresnel lens, the light from the light-emitting diode (LED) was effectively focused within a 15 mm mounting distance to achieve high-efficiency illumination. LEC can be easily designed in the shape of fluorescence filter cubes for installation in commercial fluorescence microscopes. LECs’ optical efficiency is 1–2 orders of magnitude higher than that of mercury lamps; therefore, high-quality fluorescence imaging with spectral coverage from UV to red can be achieved. By replacing conventional fluorescence filter cubes, LEC can be easily installed on any commercial fluorescence microscope. A built-in LEC driver can identify the types of LEDs in different spectral bands to adopt the optimal operating current and frequency of pulses. Moreover, high-contrast images can be achieved in pulse mode by time-gated imaging of long-lifetime luminescence.
Research Summary
A useful illumination device for fluorescence microscopy
A compact LED fluorescence light source that can be arbitrarily used in any fluorescent microscope. Fluorescence microscopy is a powerful tool for scientists to observe the microscopic world, and the fluorescence excitation light source is one of the most critical components. Recently, Dayong Jin from China’s Southern University of Science and Technology and colleagues present a LED fluorescence light source, called LED integrated excitation cube (LEC). By replacing the conventional fluorescence filter cubes, LEC can be easily installed on any commercial fluorescence microscope, and a built-in LEC driver can identify the types of LEDs in different spectral bands to adopt the optimal operating current and the frequency of pulses. The team applied LEC to Nexcope and Olympus fluorescence microscopes and achieved high-contrast imaging of time-gated technology.
Rights and permissions
Open Access This article is licensed under a Creative Commons Attribution 4.0 International License, which permits use, sharing, adaptation, distribution and reproduction in any medium or format, as long as you give appropriate credit to the original author(s) and the source, provide a link to the Creative Commons license, and indicate if changes were made. The images or other third party material in this article are included in the article′s Creative Commons license, unless indicated otherwise in a credit line to the material. If material is not included in the article′s Creative Commons license and your intended use is not permitted by statutory regulation or exceeds the permitted use, you will need to obtain permission directly from the copyright holder. To view a copy of this license, visit http://creativecommons.org/licenses/by/4.0/.

 DownLoad: