


-
Shearography is a highly sensitive optical interferometry method1. Because of its large measurement field of view and strong vibration-resistant capability, which most optical interference techniques do not feature, shearography has been increasingly studied and applied in the fields of three-dimensional non-destructive testing, material property analysis, and object vibration patterns recognition2−4. It is a two-step imaging technique that cannot directly obtain the measured information: it must first extract the phase information from the speckle pattern obtained by camera at different moments during object deformation, and then the corresponding object deformation information can be obtained5.
There are two main types of phase-extraction methods. One is the temporal phase-shifting method, which has been widely developed in the field of coherent optical interference owing to its simple structure, easy implementation, low speckle noise, and high phase accuracy. It ranges from the most classical 3-step6 and 4-step5 methods to the more accurate 9-step7 and 15-step8 methods. Recent research has proposed a method that can recover phase information without the need to know the specific phase-shifting step9. However, the traditional temporal phase-shifting method requires at least three interferograms to obtain the phase information while keeping the object undistorted. Recent two-interferogram phase-shifting algorithms are not robust to speckle noise; thus, the temporal phase-shifting method is not suitable for measuring the dynamic deformation of an object10, 11.
Another phase-extraction method is the spatial phase-shifting method, which is also known as the spatial carrier method. Pedrini et al.12 first proposed spatial phase-shifting shearography using a Mach–Zehnder interferometer. The spatial carrier method can extract phase information from a single speckle pattern, and its spectrum has strong operability; thus, it has been widely investigated in various fields in recent years, particularly in the areas of multidirectional non-destructive testing and multiwavelength three-dimensional object deformation detection13−16. However, owing to the coupling of the spatial carrier frequency with the shearing amount, the spatial carrier method often encounters the spectrum overlapping phenomenon, rendering the resulting phase fringe map prone to blurring and broken lines, as discussed in Section 213. To decouple the shearing amount from the carrier frequency, Barrera et al.17 proposed a common-path shearography system using a mask with three apertures combined with wedge plates to achieve spatial carrier shearography. This system is simple in structure; however, the system components are fixed and certain parameters, such as the shearing amount, are difficult to adjust. Therefore, the practical application of the system is very limited. Yan et al.18 proposed a pixelated carrier method based on a polarization camera to achieve free adjustment of the shearing amount; however, the polarization camera is expensive and the system is complex.
In holography, the same spectrum-overlapping problem exists; it affects the reconstructed intensity-map resolution and reconstructed phase accuracy. Pavillon et al.19 used an iterative method to suppress the zero-order term selectively based on the hologram information. This iterative process is simple and has a sufficient physical basis. However, it requires acquiring the reference beam in advance and assumes that the reference beam does not change during the recording of the holograms, whereas in shearography, both the reference and object light change with the object. Ma et al20. used a nonlinear filter to suppress the zero-order term. Because the reference light in holography is a plane wave with a narrow spectrum, it does not produce serious spectrum overlapping phenomena. However, in shearography, the spectrum area of the zero-order term is the same as the spectrum of the object light, and the use of nonlinear filters will affect the object light simultaneously.
In this study, a shearography phase-extraction method based on windowed Fourier ridge (WFR) is proposed. To the best of our knowledge, there are only a few studies on spatial carrier spectrum overlapping in shearography. The WFR proposed by Kemao Qian for phase extraction mainly focuses on fringes demodulation, or for temporally phase-shifting shearography in the absence of spatial carrier21−23. By processing the spectrum, the method proposed in this paper can quickly and accurately determine the reasonable frequencies bands of the WFR, which can considerably reduce the parameter adjustment trial and error time and avoid falling into local maxima. At the same time, the linearly transformed windowed Fourier transform kernel is used to obtain the required window shape in different frequency domain coordinates24. The proposed method can improve the quality of the phase extracted from speckle patterns and reduce the effect of spectrum overlapping. The principle of the proposed method is introduced in Section 2, including a brief description of the shearography spectrum overlapping phenomenon, the principle of phase extraction by WFR, and the process of parameter determination. In Section 3, we use simulated and real speckle patterns to verify the validity of the proposed method and compare it with the traditional method. We then discuss the characteristics of the parameter selection and briefly summarize the article in Sections 4 and 5.
-
A typical spatial carrier 4-f Mach-Zehnder shearography system is shown in Fig. 1. After the laser beam is expanded by the beam expander, it is uniformly irradiated on the rough surface of the object to produce diffuse reflection and interference in the space in front of the object and create a speckle pattern. The reflected light enters the shearography system and is divided into two beams by the beam-splitting prism 1 after passing through the aperture diaphragm AP, imaging lens IL, and Fourier lens L1. Then, the two beams are reflected by plane mirrors M1 and M2. By adjusting M2 with tilt angle
$\alpha $ with respect to M1, a certain lateral mismatch between the two reflected beams is generated; the size of this lateral mismatch is called the shearing amount. The light reflected by M2 is introduced into a relative spatial carrier frequency. Finally, the two beams are combined by the beam-splitting prism 2; the combined beam interferes in the imaging sensor target surface through Fourier lens L2.${f_l}$ is the focal length of the imaging lens, and f is the focal length of the Fourier lens. The speckle patterns before and after object deformation are recorded by an image sensor (IS), and the phase information in the speckle patterns is extracted and subtracted to obtain the object deformation derivative information. Assuming that the shearing direction is the$x$ direction, the wavefront expression of the two beams$ {u_1},{u_2} $ in the image sensor surface is as follows: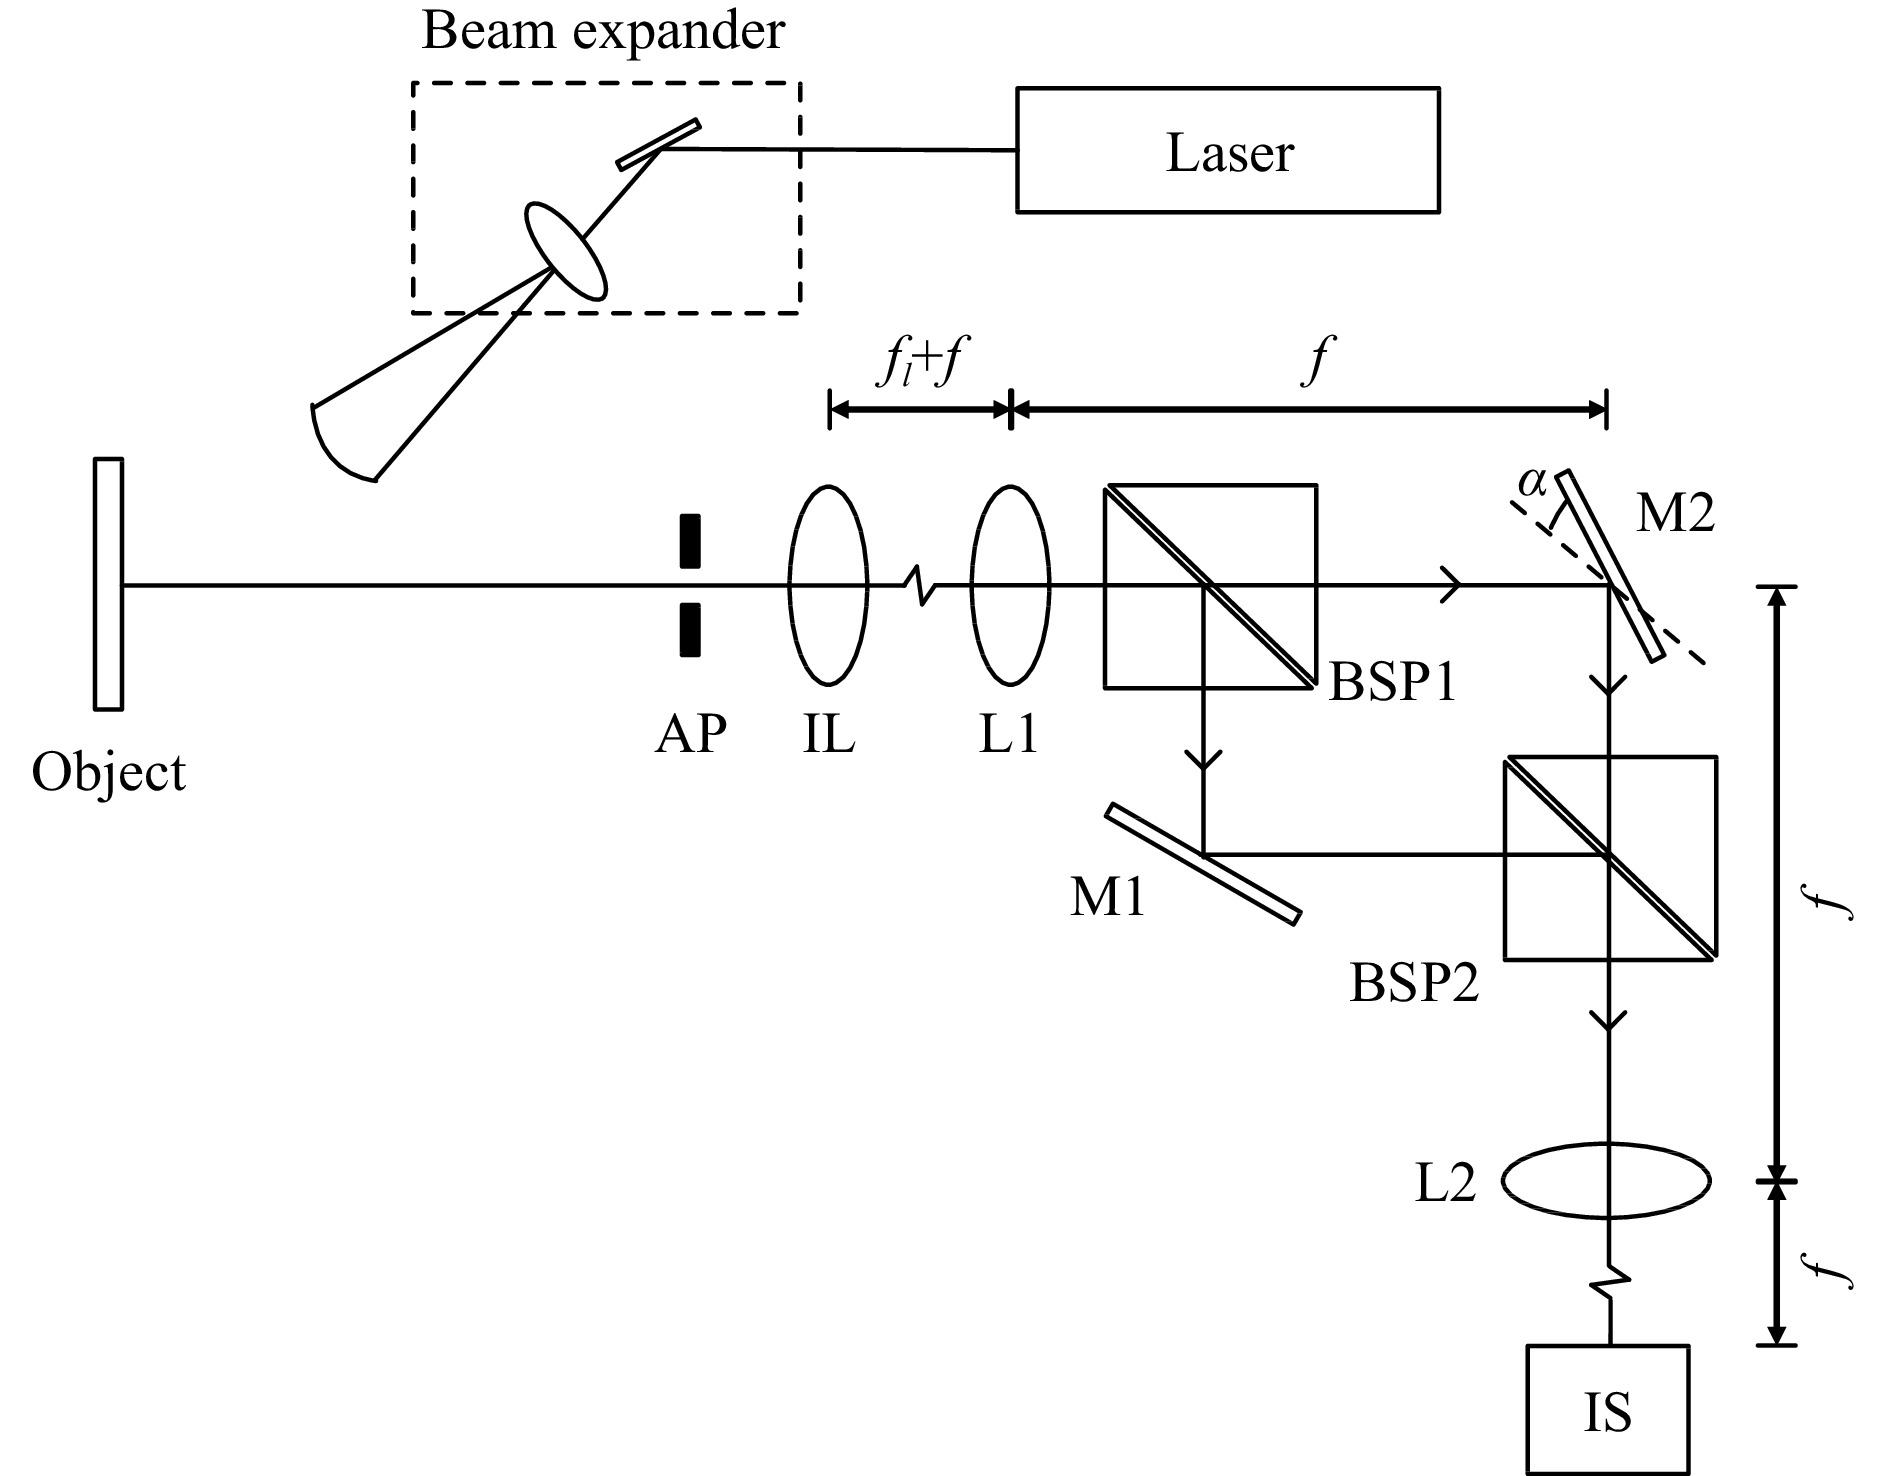
Fig. 1 Schematic of the spatial phase-shifting shearography system (not in scale). AP: aperture diaphragm, IL: imaging lens, L1, L2: Fourier lens, BSP1, BSP2: beam-splitting prism, M1, M2: mirror, IS: image sensor.
$$ \begin{array}{l} {u_1}\left( {x,y} \right) = \left| {{u_1}\left( {x,y} \right)} \right|\exp \left[ {j{\phi _1}\left( {x,y} \right)} \right] \\ {u_2}\left( {x,y} \right) = \left| {{u_2}\left( {x,y} \right)} \right|\exp \left[ {j\left( {{\phi _2}\left( {x,y} \right) + 2\pi {f_0}x} \right)} \right] \end{array} $$ (1) where
$\left( {x,y} \right)$ represents the sensor surface coordinates,${\phi _1},{\phi _2}$ is the phase of the two wavefronts,$ 2\pi {f_0}x $ is the space carrier frequency introduced by the plane mirror tilt,${f_0}{\text{ = }}\sin \alpha /\lambda $ ,$\alpha $ is the relative tilt angle of the two plane mirrors,$j$ is the imaginary unit, and$\lambda $ is the wavelength. Adjusting the tilt angle of mirror M2 will affect both the shearing amount and spatial carrier frequency. The larger the carrier frequency, the larger is the shearing amount. The expression for the interference light$I$ is as follows:$$\begin{split} I{\text{ = }}&\left( {{u_1} + {u_2}} \right){\left( {{u_1} + {u_2}} \right)^ * } = \left| {u_1^2} \right| + \left| {u_2^2} \right| + \left| {{u_2}u_1^*} \right|{e^{j\left( {{\phi _2} - {\phi _1}} \right)}}{e^{2\pi j{f_0}x}} +\\& \left| {{u_1}u_2^*} \right|{e^{ - j\left( {{\phi _2} - {\phi _1}} \right)}}{e^{ - 2\pi j{f_0}x}}\end{split} $$ (2) where * denotes the conjugate; the Fourier transform of the aforementioned equation yields
$$ {\cal{F}}\left( I \right){\text{ = }}{\cal{F}}\left( A \right) + {\cal{F}}\left( B \right) + {\cal{F}}\left( C \right) $$ (3) where
$ {\cal{F}} $ is the Fourier transformer symbol,$ A = \left| {u_1^2} \right| + \left| {u_2^2} \right|, B = \left| {{u_2}u_1^*} \right|{e^{j\left( {{\phi _2} - {\phi _1}} \right)}}{e^{2\pi j{f_0}x}} $ ,$ C = \left| {{u_1}u_2^*} \right|{e^{ - j\left( {{\phi _2} - {\phi _1}} \right)}}{e^{ - 2\pi j{f_0}x}} $ ,$A$ is the background light located in the low frequency part of the frequency domain, and the terms$B,C$ bear the spatial carrier frequency, thus, the centre of their spectrum is in$\left( {{f_0},0} \right)$ and$\left( { - {f_0},0} \right)$ , respectively; in fact,${B^*} = C$ . When the high-frequency part is completely separated from the low-frequency part, the phase difference between the two beams and the carrier frequency contained in the high-frequency part can be extracted by the windowed inverse Fourier Transform (WIFT), and the process can be summarised by Eq. 4.$$ {\phi _2} - {\phi _1} + 2\pi {f_0}x{\text{ = angle}}\left( {IFT\left( {Windowed{\text{ }}filter\left( {FT\left( I \right)} \right)} \right)} \right) $$ (4) Angle represents the calculation of the phase angle. Suppose the interference light after deformation is
${I^{'}}$ , the phase after deformation is$ \phi _2^{'},\phi _1^{'} $ . After phase extraction using the same phase extraction method, phase subtraction is performed with the phase before and after deformation to obtain the phase difference$\Delta $ , because the carrier frequency is unchanged before and after object deformation, it is eliminated by phase subtraction:$$ \Delta = \Delta {\phi ^{'}} - \Delta \phi = \phi _2^{'} - {\phi _2} + {\phi _1} - \phi _1^{'} $$ (5) If the spectrum appears to be mixed, resulting in an extracted phase containing zero-order term, the phase fringe map will show a large area of broken lines and failures, as shown in Fig. 2a. To separate the spectrum completely, the mirror M2 tilt angle must satisfy
$ \alpha \geqslant \arcsin \left( {2D/{f_l}} \right) $ , where$D$ is the diameter of the aperture, and${f_l}$ is the focal length of the imaging lens25. However, the tilt angle is positively correlated with the shearing amount, that is,$\Delta x$ . When using shearography to measure the out-of-plane deformation of an object, the phase difference before and after deformation$\Delta $ is related to the derivative of the object’s out-of-plane deformation$ \partial w/\partial x $ as follows: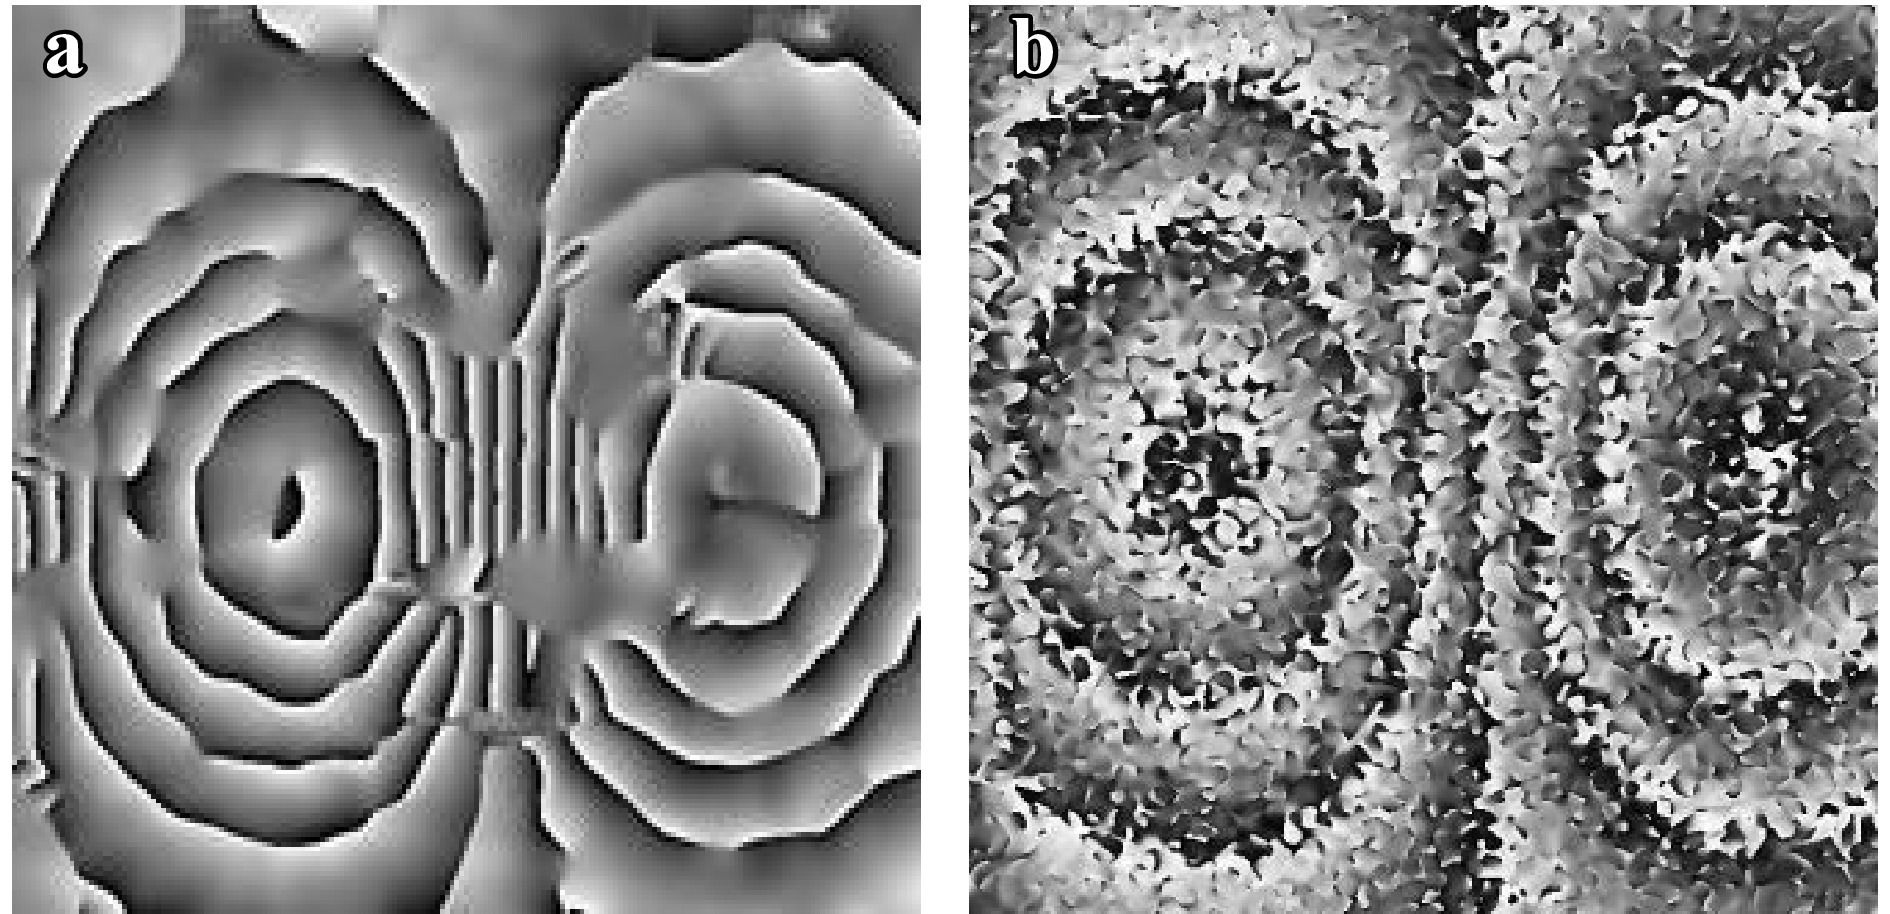
Fig. 2 a Phase fringe map with the zero-order term in the extracted phase, b phase fringe map with large speckle.
$$ \Delta {\text{ = }}\frac{{4\pi \Delta x}}{\lambda }\frac{{\partial w}}{{\partial x}} $$ (6) As the shearing amount increases, the obtained phase difference becomes more sensitive to deformation, and even a small deformation produces a drastic phase change. Because the phase fringe map is wrapped in the range of
$\left[ { - \pi,\pi } \right)$ , drastic phase changes will result in a denser fringe map, which is difficult to filter. Excessive shearing will also lead to a reduction in the actual interference area, distorting the phase map.The use of a small aperture can separate the spectrum with low carrier frequencies. However, this also reduces the light throughput and signal-to-noise ratio. Simultaneously, the aperture size is negatively correlated with the size of the speckle pattern, as shown in Eq. 7. An excessively large speckle pattern is difficult to filter, as shown in Fig. 2b.
$$ \Delta s = \frac{{\lambda {f_l}}}{D} $$ (7) -
In summary, the paradox of the spatial carrier method shearography is that the existing phase-extraction methods cannot obtain high-quality phase when the spectrum overlaps. To solve this problem, this paper proposes a shearography phase-extraction method based on WFR. The 2D windowed Fourier transform SI is defined as
$$ \begin{split}SI\left( {u,v;{\xi _x},{\xi _y}} \right) =& \sum\limits_{y = - \infty }^\infty \sum\limits_{x = - \infty }^\infty I\left( {x,y} \right){g^*}\left( {x - u,y - v} \right)\\&\exp \left[ { - j\left( {{\xi _x}x + {\xi _y}y} \right)} \right] \end{split}$$ (8) where
$\left( {{\xi _x},{\xi _y}} \right)$ is the frequency coordinate.$g\left( {x,y} \right)$ is the windowed Fourier transform kernel, and when it is a Gaussian function, as in Eq. 9, it is also known as the Gabor transform.${\sigma _x},{\sigma _y}$ control the window size.$$ g\left( {x,y} \right) = \frac{1}{{\sqrt {\pi {\sigma _x}{\sigma _y}} }}\exp \left[ { - \frac{1}{2}\left( {\frac{{{x^2}}}{{\sigma _x^2}} + \frac{{{y^2}}}{{\sigma _y^2}}} \right)} \right] $$ (9) Because the surface deformation of the object measured by shearography is relatively gentle, we can assume that the phase of the speckle pattern acquired at an arbitrary point
${t_n}$ in the deformation process is a quadratic function and its intensity is constant. A Taylor expansion of the phase at this point yields23$$ \begin{split} \varphi \left( {x,y,{t_n}} \right) =& \varphi \left( {u,v,{t_n}} \right) + {\omega _x}\left( {u,v,{t_n}} \right) \cdot \left( {x - u} \right) +\\& {\omega _y}\left( {u,v,{t_n}} \right) \cdot \left( {y - v} \right) + 0.5{c_{xx}}\left( {u,v,{t_n}} \right) \cdot {\left( {x - u} \right)^2} +\\& 0.5{c_{yy}}\left( {u,v,{t_n}} \right) \cdot {\left( {y - v} \right)^2} \end{split} $$ (10) where
${\omega _x},{\omega _y}$ is called the local frequency and${c_{xx}},{c_{yy}}$ is the local curvature. When the windowed Fourier transform is performed on a speckle pattern$I{\text{ = }}A + B + C$ ,$A$ is the background light, and its phase does not contain any valid information. It is meaningless to analyse it and thus, it will be omitted. However, the background light part will still have an effect on the extraction phase. The two high-frequency parts of the speckle pattern are in different halves, and by controlling the frequency parameter, the influence of the other terms could be excluded. At moment${t_n}$ , the following is obtained:$$ \begin{array}{l} S{I_{{t_n}}}\left( {u,v;{\xi _x},{\xi _y}} \right) = S{C_{{t_n}}}\left( {u,v;{\xi _x},{\xi _y}} \right) \approx {C_{{t_n}}}\left( {u,v} \right){G_{{t_n}}}\left( {u,v;{\xi _x},{\xi _y}} \right) \\ {G_{{t_n}}}\left( {u,v;{\xi _x},{\xi _y}} \right) = M{E_x}\left( {u,v;{\xi _x}} \right){E_y}\left( {u,v;{\xi _y}} \right) \end{array} $$ (11) where
$$ \begin{split} M =& {\left[ {\frac{{16{\pi ^2}\sigma _x^2\sigma _y^2}}{{\left( {1 + \sigma _x^4c_{xx}^2} \right)\left( {1 + \sigma _y^4c_{yy}^2} \right)}}} \right]^{\frac{1}{4}}} \\ {E_x}\left( {u,v;{\xi _x}} \right) =& \exp \Bigg[ \frac{{ - \sigma _x^2{{\left( {{\xi _x} - {\omega _x}} \right)}^2}}}{{2\left( {1 + \sigma _x^4c_{xx}^2} \right)}} - j\frac{{\sigma _x^4c_{xx}^2{{\left( {{\xi _x} - {\omega _x}} \right)}^2}}}{{2\left( {1 + \sigma _x^4c_{xx}^2} \right)}} +\\& j\frac{1}{2}\arctan \left( {\sigma _x^2{c_{xx}}} \right) \Bigg] \\ {E_y}\left( {u,v;{\xi _y}} \right) = &\exp \Bigg[ \frac{{ - \sigma _y^2{{\left( {{\xi _y} - {\omega _y}} \right)}^2}}}{{2\left( {1 + \sigma _y^4c_{yy}^2} \right)}} - j\frac{{\sigma _y^4c_{yy}^2{{\left( {{\xi _y} - {\omega _y}} \right)}^2}}}{{2\left( {1 + \sigma _y^4c_{yy}^2} \right)}} +\\& j\frac{1}{2}\arctan \left( {\sigma _y^2{c_{yy}}} \right) \Bigg] \end{split} $$ (12) The time subscript in the Eq. 12 has been omitted for simplicity. When
$ {\xi _x}{\text{ = }}{\omega _x},{\xi _y}{\text{ = }}{\omega _y} $ , the approximate sign in Eq. 11 holds, which means that the forward windowed Fourier transform (FWFT) with reasonable parameter settings on the speckle pattern can obtain the high-frequency phase itself, whereas$ {\xi _x},{\xi _y} $ can be determined by the WFR, as shown in Eq. 1321.$$ {\omega _x},{\omega _y} = \mathop {\arg \max }\limits_{{\xi _x},{\xi _y}} \left| {SC\left( {u,v;{\xi _x},{\xi _y}} \right)} \right| $$ (13) Because object deformation tends to be a slowly changing process, particularly when a high-frame-rate camera is used for acquisition, the local curvature
$ {c_{xx}},{c_{yy}} $ between moments${t_n},{t_{n + 1}}$ can be considered constant. Thus, the phase difference between the two moments can be obtained by determining the phase angle in Eq. 14.$$ \Delta \varphi \left( {{t_n}} \right) = angle\left( {SI\left( {{t_{n + 1}}} \right) \cdot SI{{\left( {{t_n}} \right)}^*}} \right) = \varphi \left( {{t_{n + 1}}} \right) - \varphi \left( {{t_n}} \right) $$ (14) Because the shearography spectrum zero-order term has a fixed cut-off frequency, the theoretical spatial carrier frequencies required for WFR and WIFT are the same. However, WFR is a maximum-squeezing algorithm, which is more tolerant of spectrum overlapping than WIFT; thus, WFR can reconstruct the phase better in the case of spectrum overlapping.
The effect of the WFR algorithm depends on the parameter settings, which include the windowed Fourier transform kernel size
${\sigma _x},{\sigma _y}$ and frequency bands$ {\xi _{xh}},{\xi _{xl}},{\xi _{yh}},{\xi _{yl}} $ . As the WFR algorithm must traverse the frequency band in a fixed step, the frequency bandwidth determines the speed of the algorithm operation, a reasonable frequency band can shorten the operation time and use a smaller loop step to find the optimal solution. In traditional methods, the frequency band must be adjusted manually; several trials are required to determine the appropriate frequency band, which increases the time and computational cost and requires experienced researchers. The window size directly affects the reconstructed phase accuracy, and a smaller window is required in the case of spectrum overlapping to avoid mixing the background light phase in the extracted phase. Meanwhile, the window size affects the speckle size in shearography, and a too small window leads to excessive phase-map noise. In this study, a simple method is used to determine the upper and lower limits of the frequency band. A linearly varying windowed Fourier transform kernel is used, and the overall phase-extraction flow chart is shown in Fig. 3a.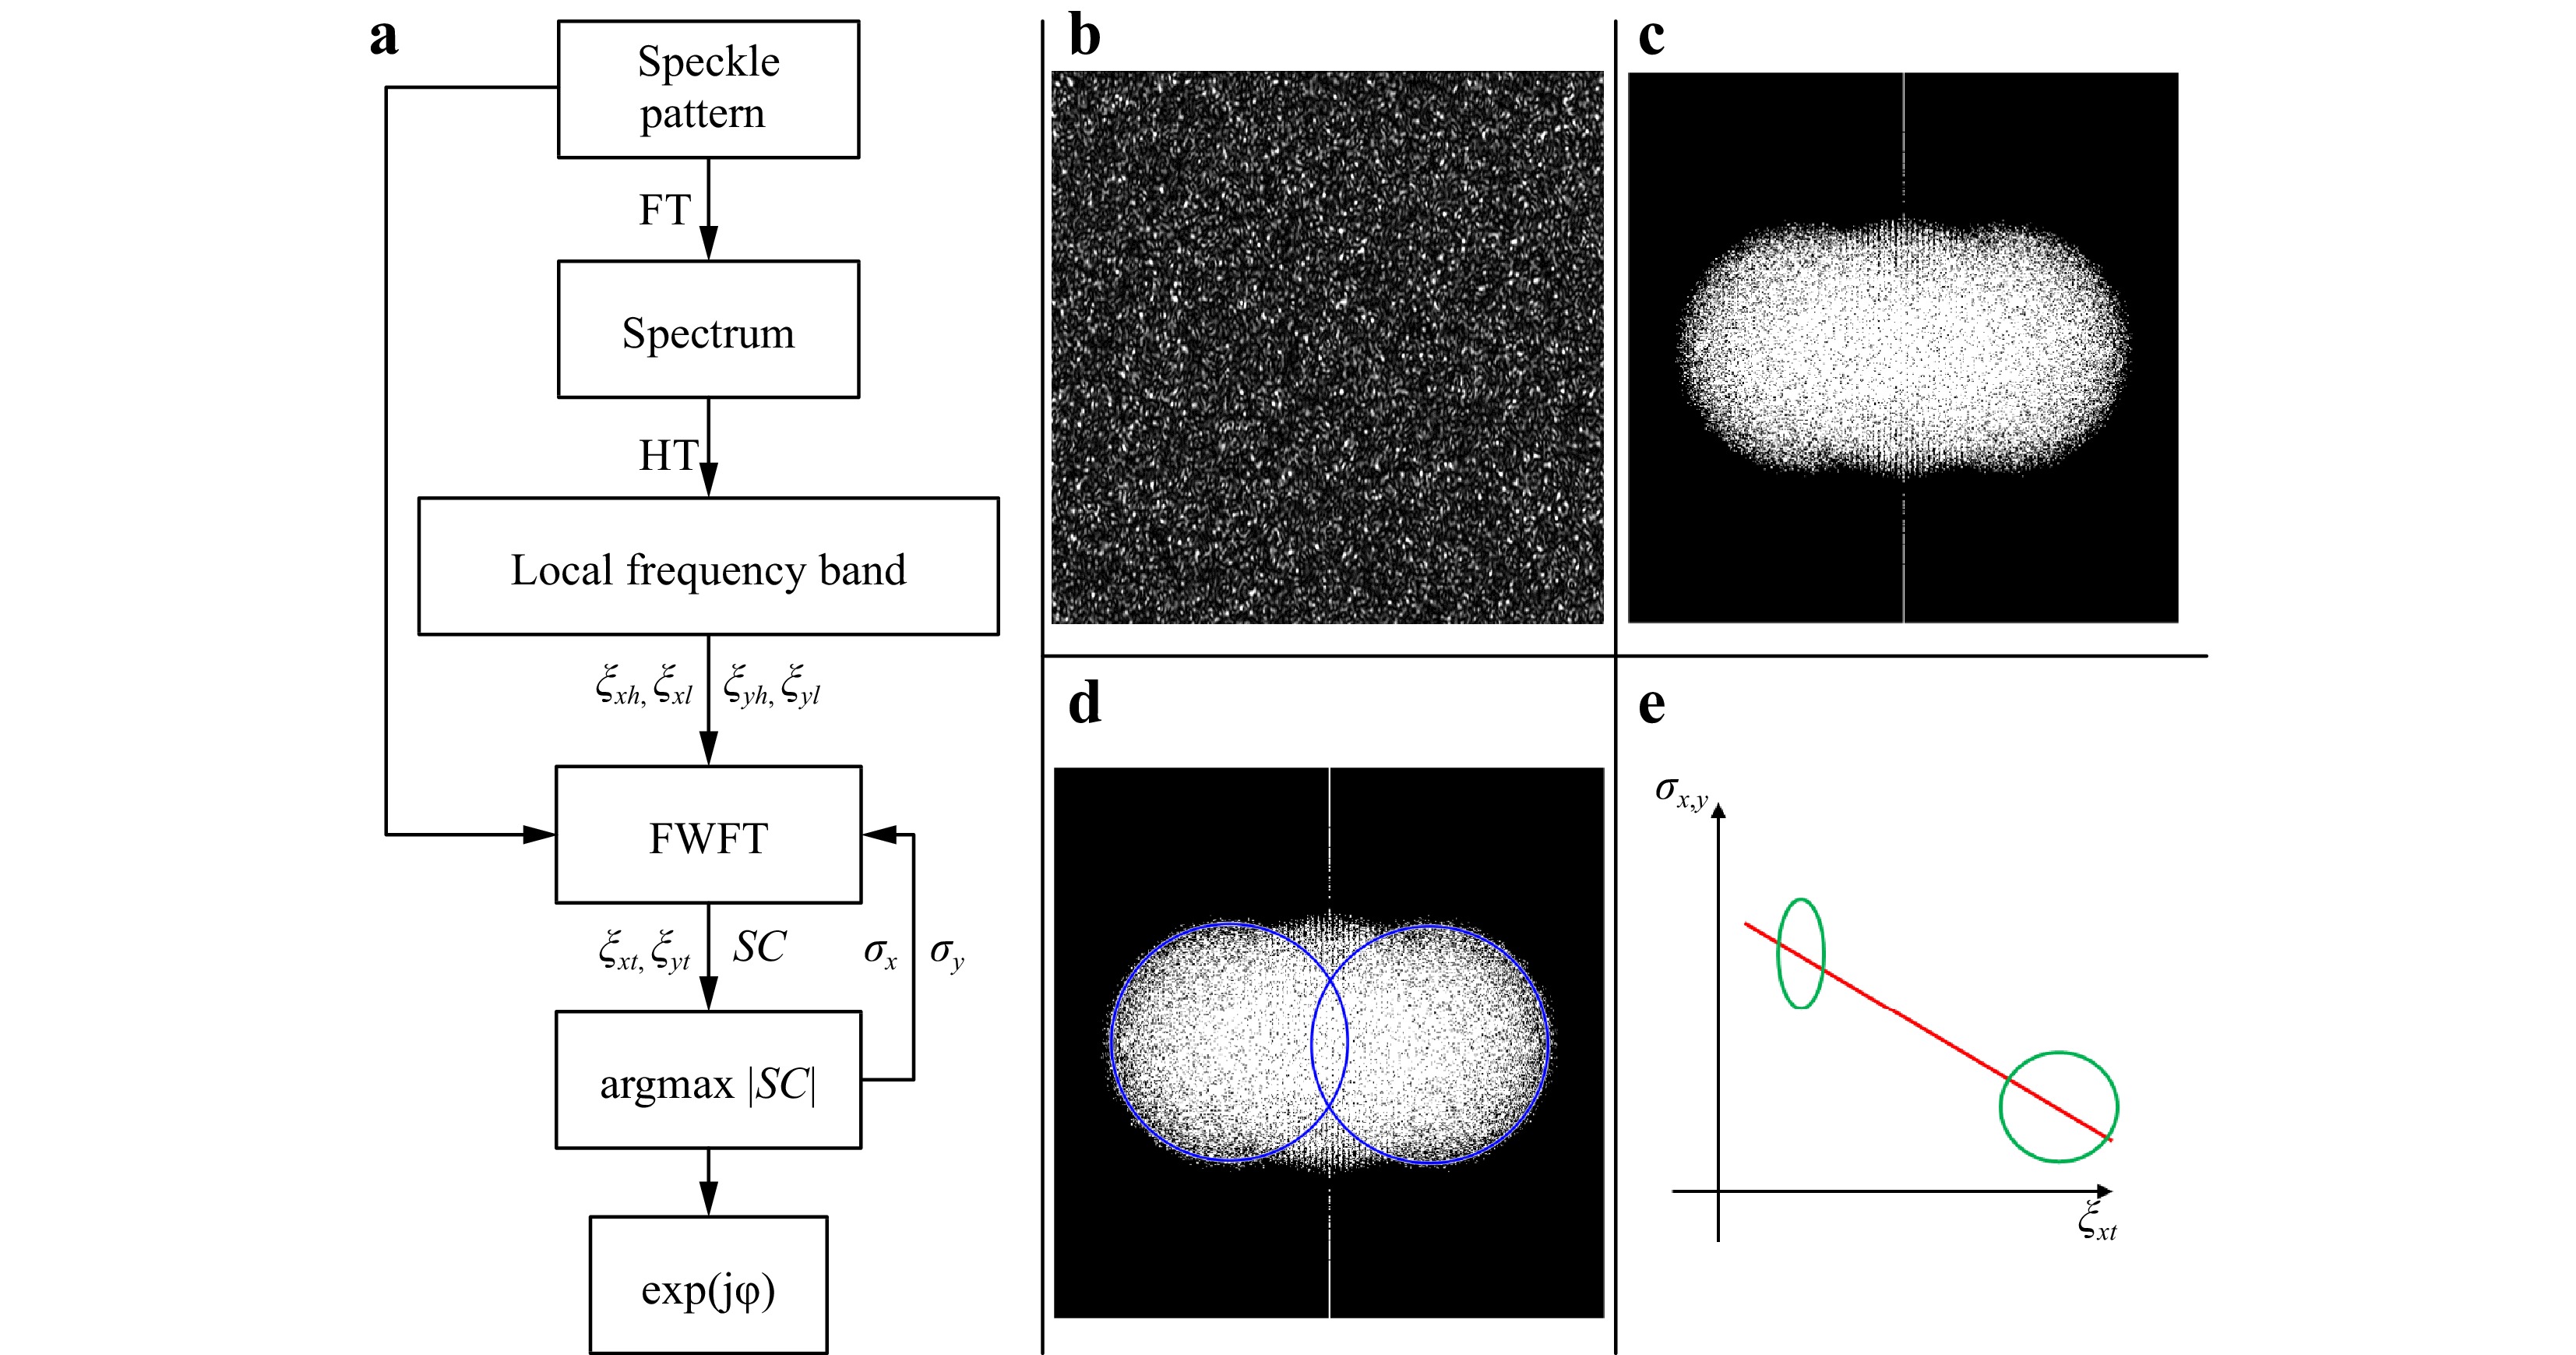
Fig. 3 a Flowchart of phase extraction, b speckle pattern, c spectrum of speckle pattern, d the high frequency part of the spectrum obtained by Hough transform identification, e schematic of the Fourier transform kernel window changing.
Because the speckle patterns acquired by the camera are discrete images, in the Fourier domain, the window slides by one period corresponding to the frequency domain coordinate interval
$\left[ { - \pi,\pi } \right)$ . Suppose that the size of the collected speckle patterns is$M \times N$ pixels; then, the frequency domain coordinates correspond to the pixel coordinates as$$ \left\{ {\begin{array}{*{20}{c}} {dx = \dfrac{M}{{2\pi }}} \\ {dy = \dfrac{N}{{2\pi }}} \end{array}} \right. $$ (15) The system is assumed to use a circular aperture diaphragm, which is employed in most optical systems. After performing the Fourier transform of the speckle pattern (Fig. 3b) to obtain the spectrum (Fig. 3c), the radius of the spectrum corresponding to the two high-frequency parts and the coordinates of the centre of the spectrum can be obtained by performing the Hough transform (HT), as shown in Fig. 3d. Assuming that the carrier frequency is introduced in the horizontal direction, as shown by the solid line in Fig. 4, the radius of the spectrum is
$ rr $ and the centre coordinates of object light spectrum is$\left( {cx,0} \right)$ . For convenience, the left half of the spectrum is omitted.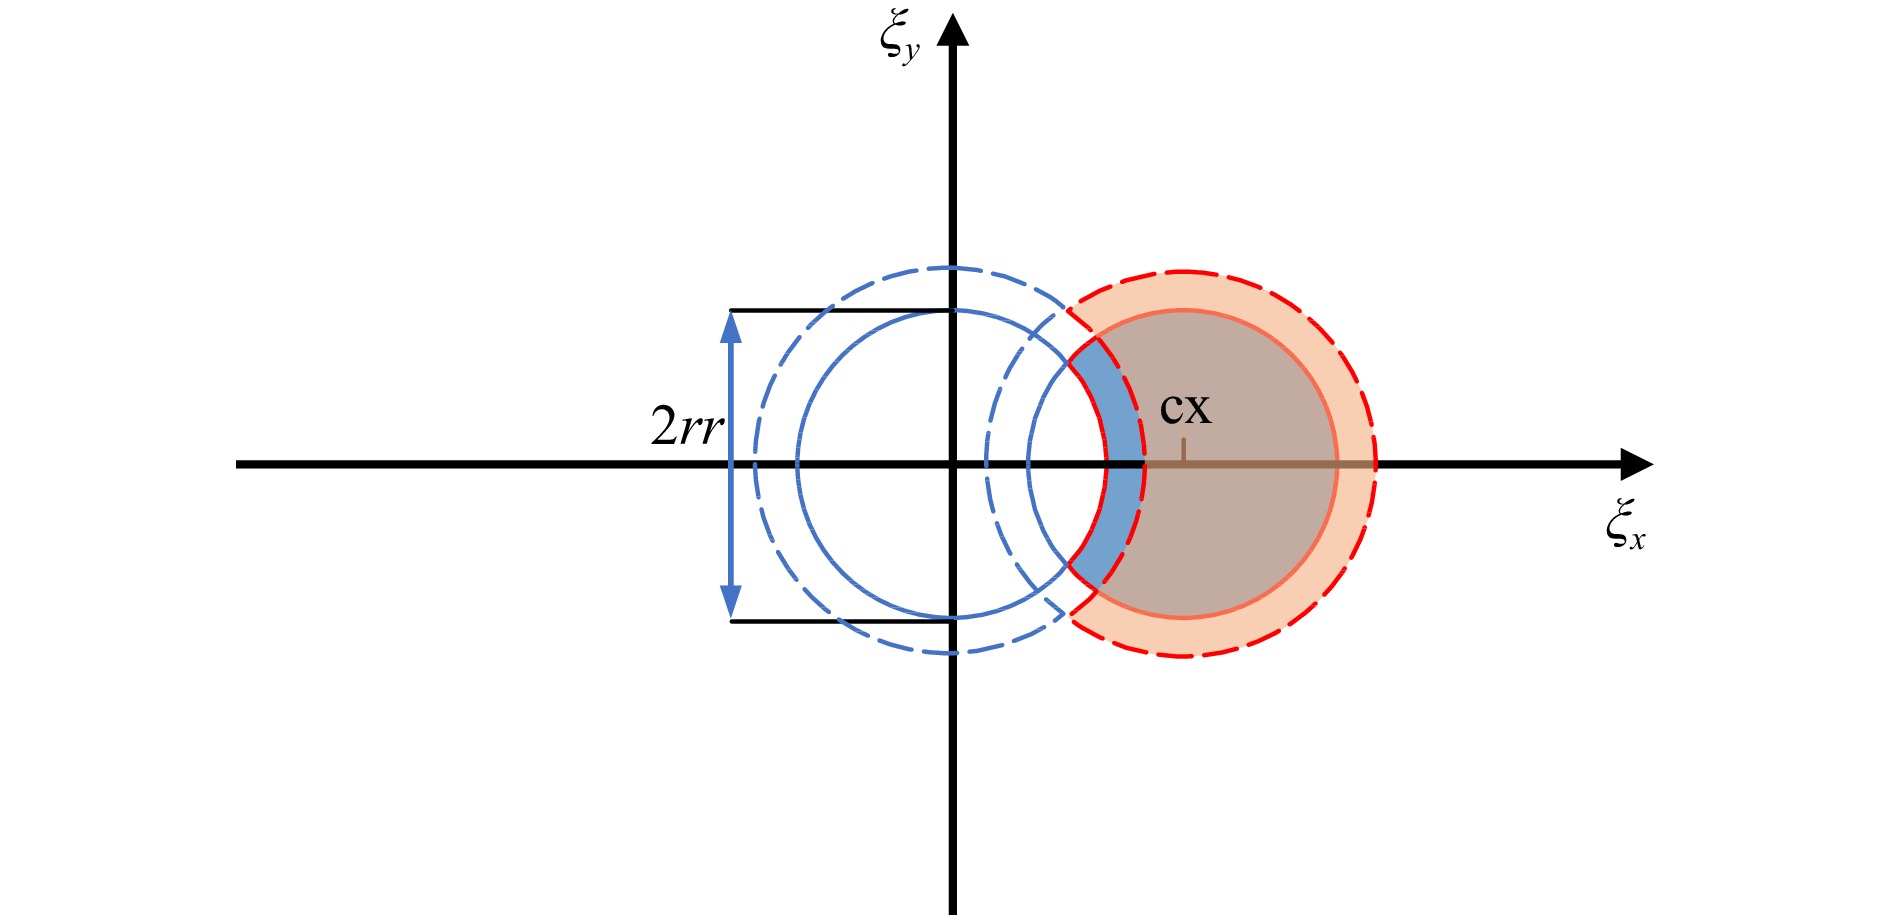
Fig. 4 Schematic of the spectrum coordinates.
The frequency band in the vertical direction is
$ {\xi _{yl}} = - rr/dy,\;{\xi _{yh}} = rr/dy $ , and the frequency band in the horizontal direction is$$ \begin{array}{l} {\xi _{xl}} = dr + rr/dx \\ {\xi _{xh}} = cx/dx + {\xi _{xl}} \end{array} $$ (16) Since the discrete Fourier transform has energy leakage, the energy leakage is more serious for the windowed Fourier transform, so the cut-off frequency requirement for the windowed Fourier transform is higher than that of the Fourier transform when extracting the phase. However, in the shearography where spectrum overlapping has occurred, the energy leakage does not make the actual extractable spectrum region smaller, but only leads to the overall right shift of the frequency band. The spectrum after energy leakage is shown as the dashed line in Fig.4, the blue and orange parts in Fig.4 correspond to the spectrum range before and after energy leakage, so this paper introduces a compensation amount
$dr$ . This compensation amount compensates for the deflection caused by energy leakage on the one hand, and on the other hand is used to compensate for the error in the circle centre coordinates identified by the HT. For possible spectrum overlapping, the use of a Gaussian window with fixed${\sigma _x} = {\sigma _y}$ will cause the reconstructed phase to affect the background light phase information, and using a fixed elliptical window will lead to idiosyncratic speckle noise. In this study, we used variable windows with different Gaussian window shapes for different frequency domain regions to avoid phase blending and improve the quality of the extracted phase to the extent possible.First, let
${\sigma _x}$ be a fixed value,${\sigma _x}{\text{ = }}{\sigma _0}$ . Assume that when the spectrum is half mixed, that is,$cx = rr$ , the vertical window size${\sigma _y}{\text{ = }}{\sigma _{\max }}$ , and when the spectrum is completely separated, that is,$cx = 2rr$ , the vertical window size is the same as the horizontal one,${\sigma _y}{\text{ = }}{\sigma _0}$ . When$rr < cx < 2rr$ , the initial value of the vertical window size is$$ {\sigma _{y0}} = \frac{{\left( {{\sigma _0} - {\sigma _{\max }}} \right)cx}}{{rr}} + 2{\sigma _{\max }} - {\sigma _0} $$ (17) When the window frequency-domain coordinates of the window Fourier transform are shifted to
${\xi _{xt}}$ , the linearly varying vertical window size is determined by Eq. 18. To compensate for the directional specificity of speckle noise to some extent,${\sigma _y}$ can finally be made slightly smaller than${\sigma _0}$ . Fig. 3e shows the change in the window with the change in the frequency-domain coordinates.$$ {\sigma _y} = \frac{{\left( {{\sigma _{y0}} - 0.9{\sigma _0}} \right)}}{{{\xi _{xl}} - {\xi _{xh}}}}{\xi _{xt}} + \frac{{\left( {0.9{\sigma _0}{\xi _{xl}} - {\sigma _{y0}}{\xi _{xh}}} \right)}}{{{\xi _{xl}} - {\xi _{xh}}}} $$ (18) -
To verify the effectiveness of the proposed method for phase extraction in the case of spectrum overlapping, speckle patterns were produced using computer simulations. In this study, two methods were used to construct the simulated deformation: one is the random matrix expansion method based on interpolation, in which a small matrix (e.g., 5 × 5) is first built and the values within [0, 1] are randomly assigned to it; then, it is expanded to a matrix of the desired size (e.g., 500 × 500) by bilinear interpolation or bicubic interpolation, and the expanded matrix is used as the deformation for simulation26; the other method is the traditional Gaussian function. The speckle patterns corresponding to the deformation constructed by the aforementioned methods were simulated by combining the angular spectrum interference theory, controlling the size of the simulated diaphragm aperture, and the introduced carrier frequency while adding pepper noise with a variance of 0.0025 to mimic the speckle noise. Multiple pairs of simulated speckle patterns were produced before and after deformation, as shown in Fig. 5.
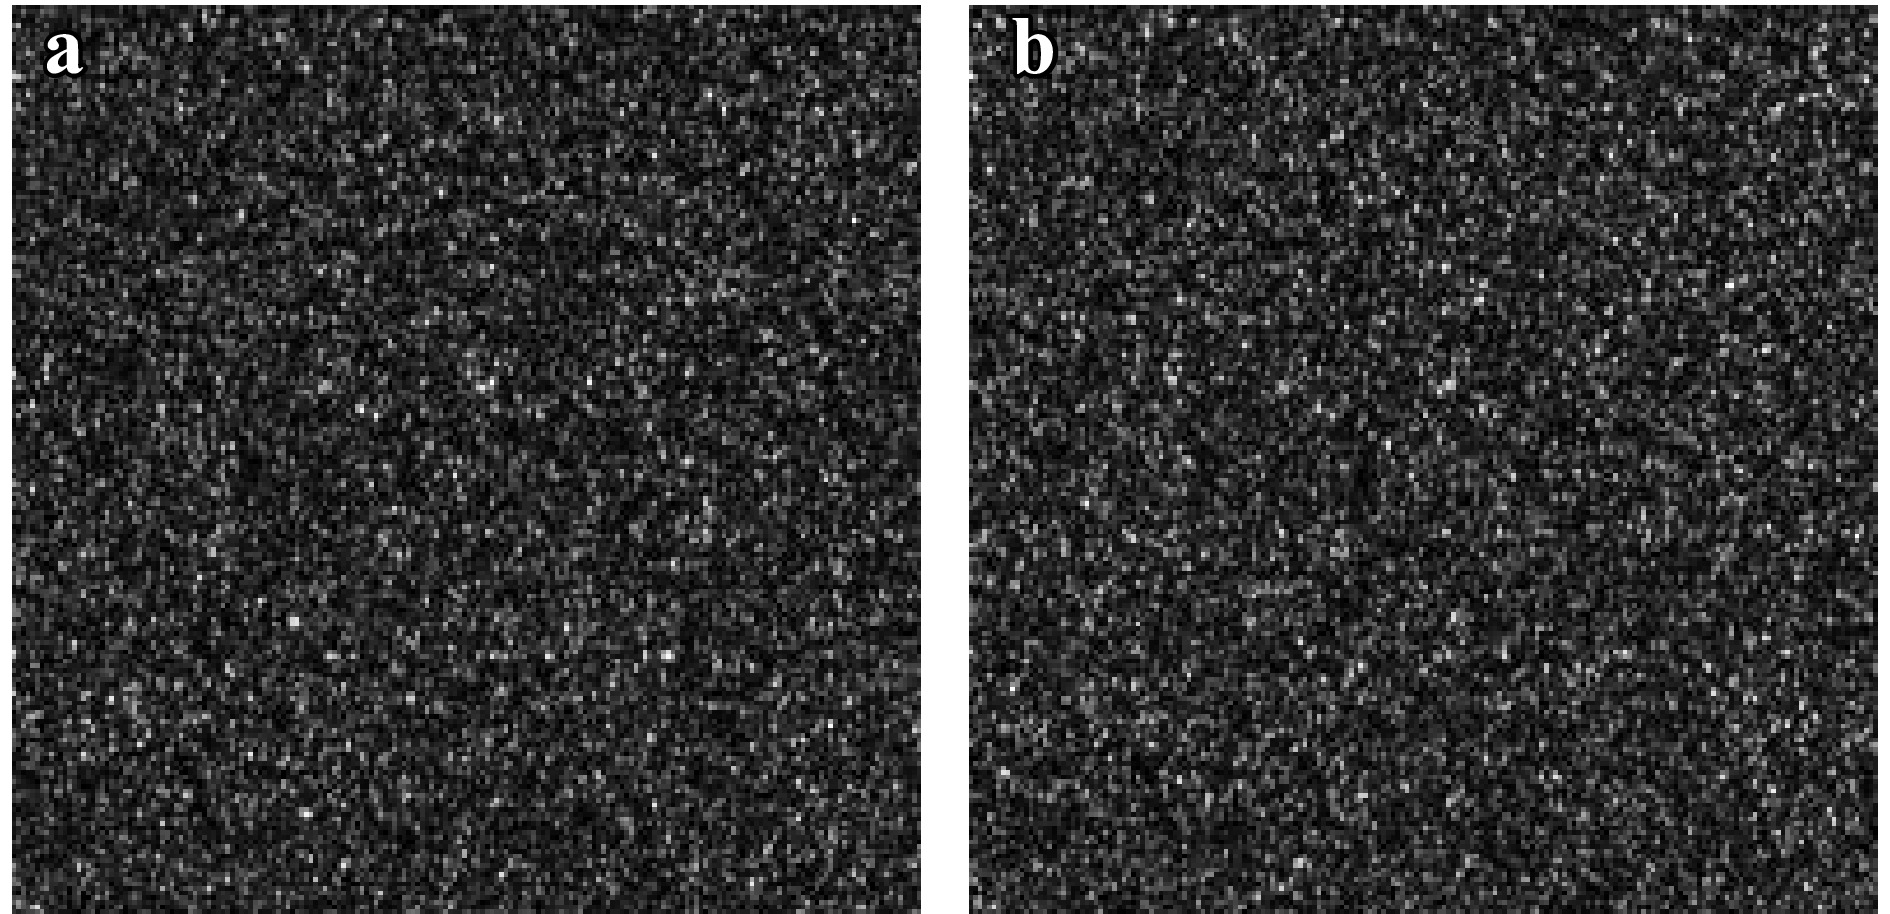
Fig. 5 Speckle patterns a before deformation and b after deformation.
To evaluate the proposed method against conventional methods, this study also adopted the traditional bandpass filtering method for phase extraction of simulated speckle patterns. Two filters were selected for the bandpass filtering method: one is the simplest and most commonly used binary mask filter, and the other is the nonlinear filter, whose expressions are shown in the following equations:
$$ h\left( {x,y} \right) = {e^{ - \frac{1}{2}\left( {\frac{{{{\left( {x - u} \right)}^2}}}{{{\sigma _x}}} + \frac{{{{\left( {y - v} \right)}^2}}}{{{\sigma _y}}}} \right)}} $$ (19) where
$u,v$ is the frequency domain coordinate where the nonlinear filter is located, and${\sigma _x},{\sigma _y}$ is the control window size. By comparing the extracted phase quality over several trials, the position and size of the bandpass filter used are shown in Fig. 6.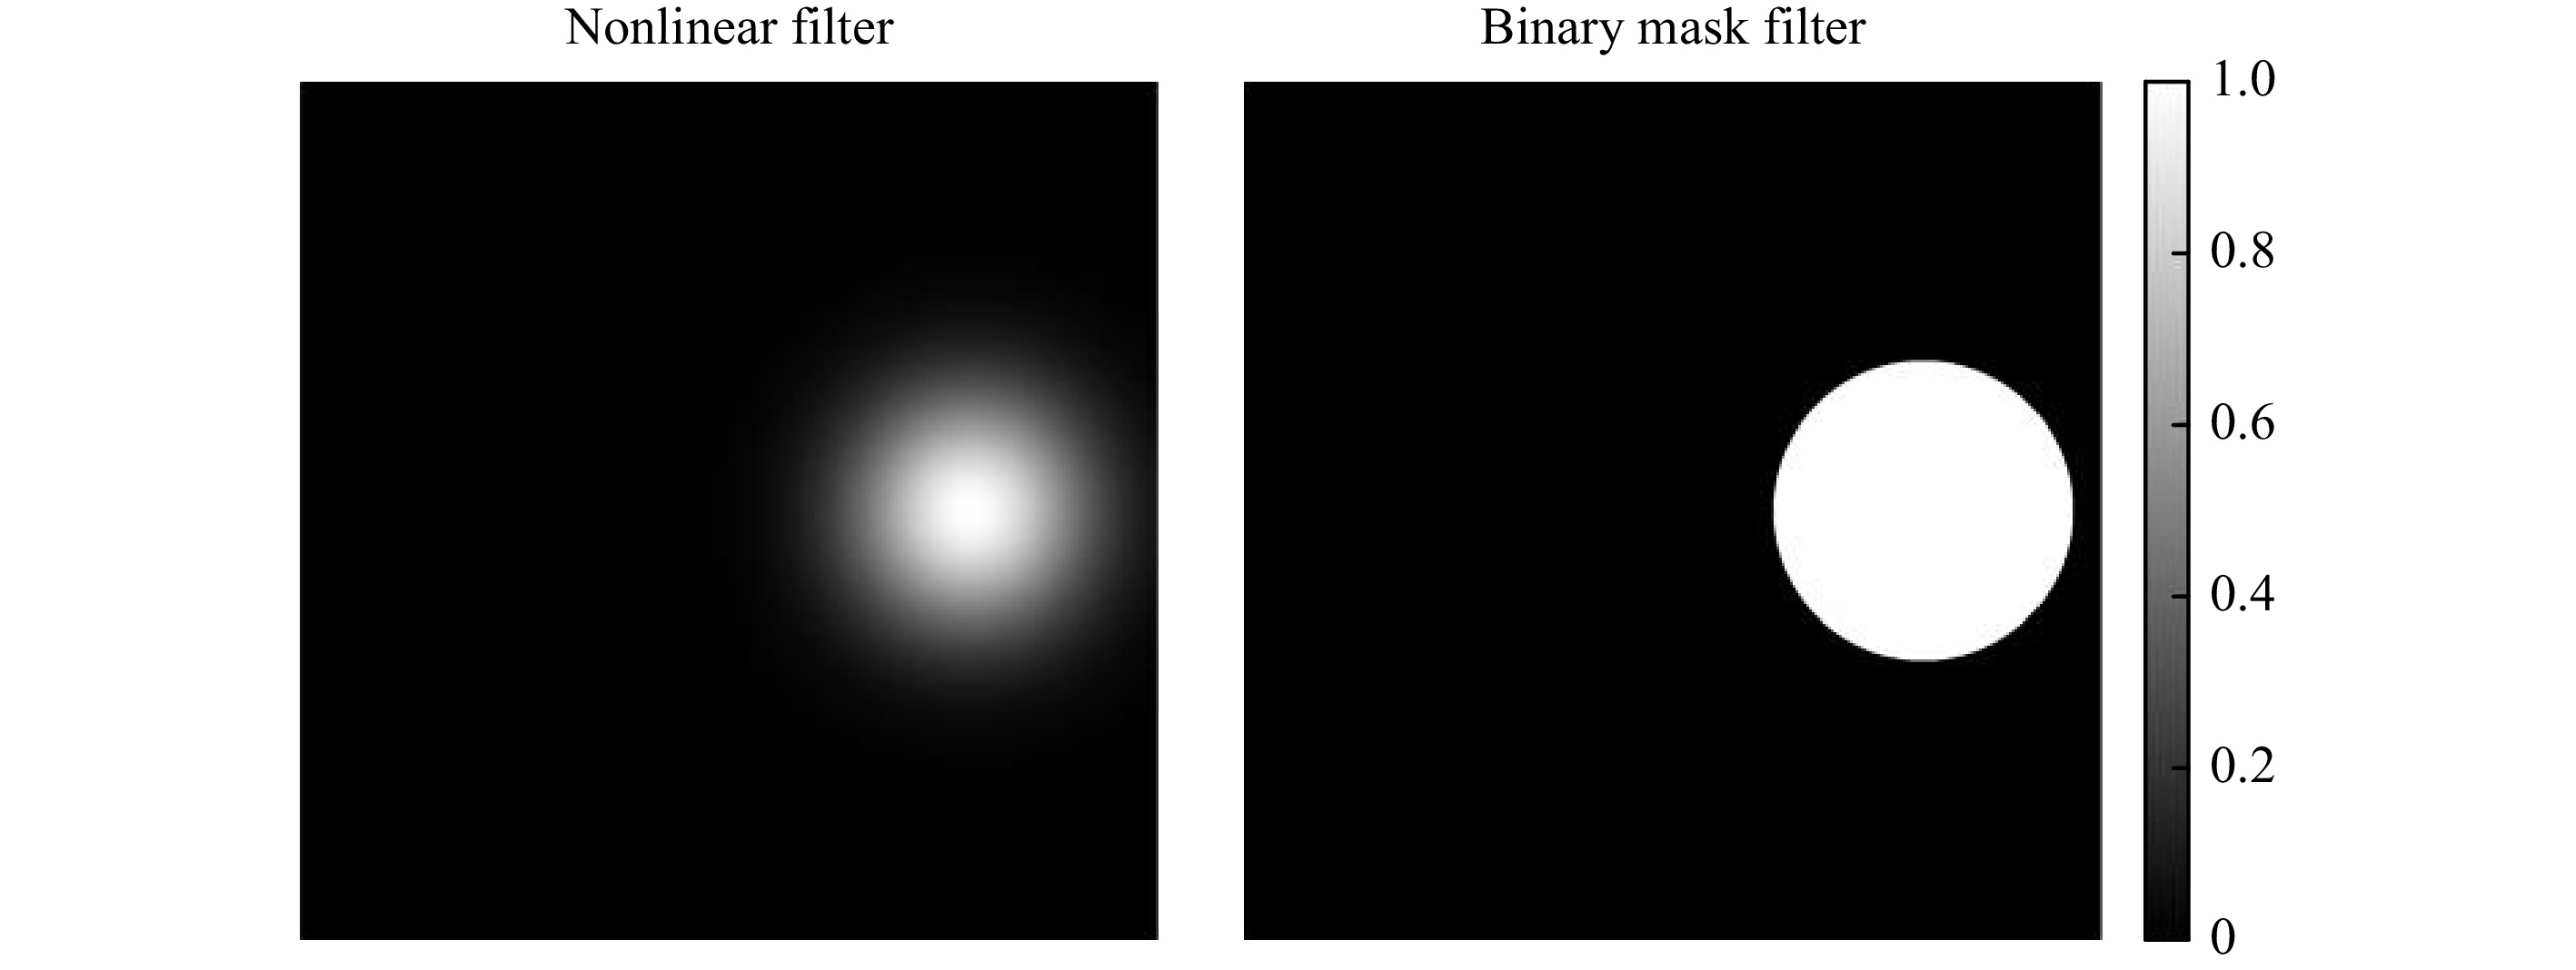
Fig. 6 Schematic of the size and position of the nonlinear filter and binary mask filter.
To verify the effectiveness of the proposed method in extracting the phase at different carrier frequencies, the carrier frequency was set from large to small to obtain multiple pairs of simulated speckle patterns, and then three phase-extraction methods were used for comparison. The most effective filtering method, windowed Fourier filtering (WFF), was used to filter the phase fringe maps22. In this simulation experiment, the speckle pattern size was
$550\, \times\, 550px,\;{\sigma _0}{\text{ = }}1,\;{\sigma _{\max }} = 2,\;dr = 0.6.$ The obtained phase map was filtered using the WFF method with the same parameter setting; the parameter setting was (10, -1, 0.10, 1, 10, -1, 0.10, 1, 8). The parameters mean that, the threshold of WFF is 8, the kernel size is 10, the frequency band is [-1, 1], and the frequency step is 0.1.In order to reflect the general effectiveness of the phase extraction method to cope with different situations, The authors used three pairs of speckle patterns with different deformations for phase extraction. The speckle pattern spectrum and the corresponding filtering results are shown in Fig. 7.
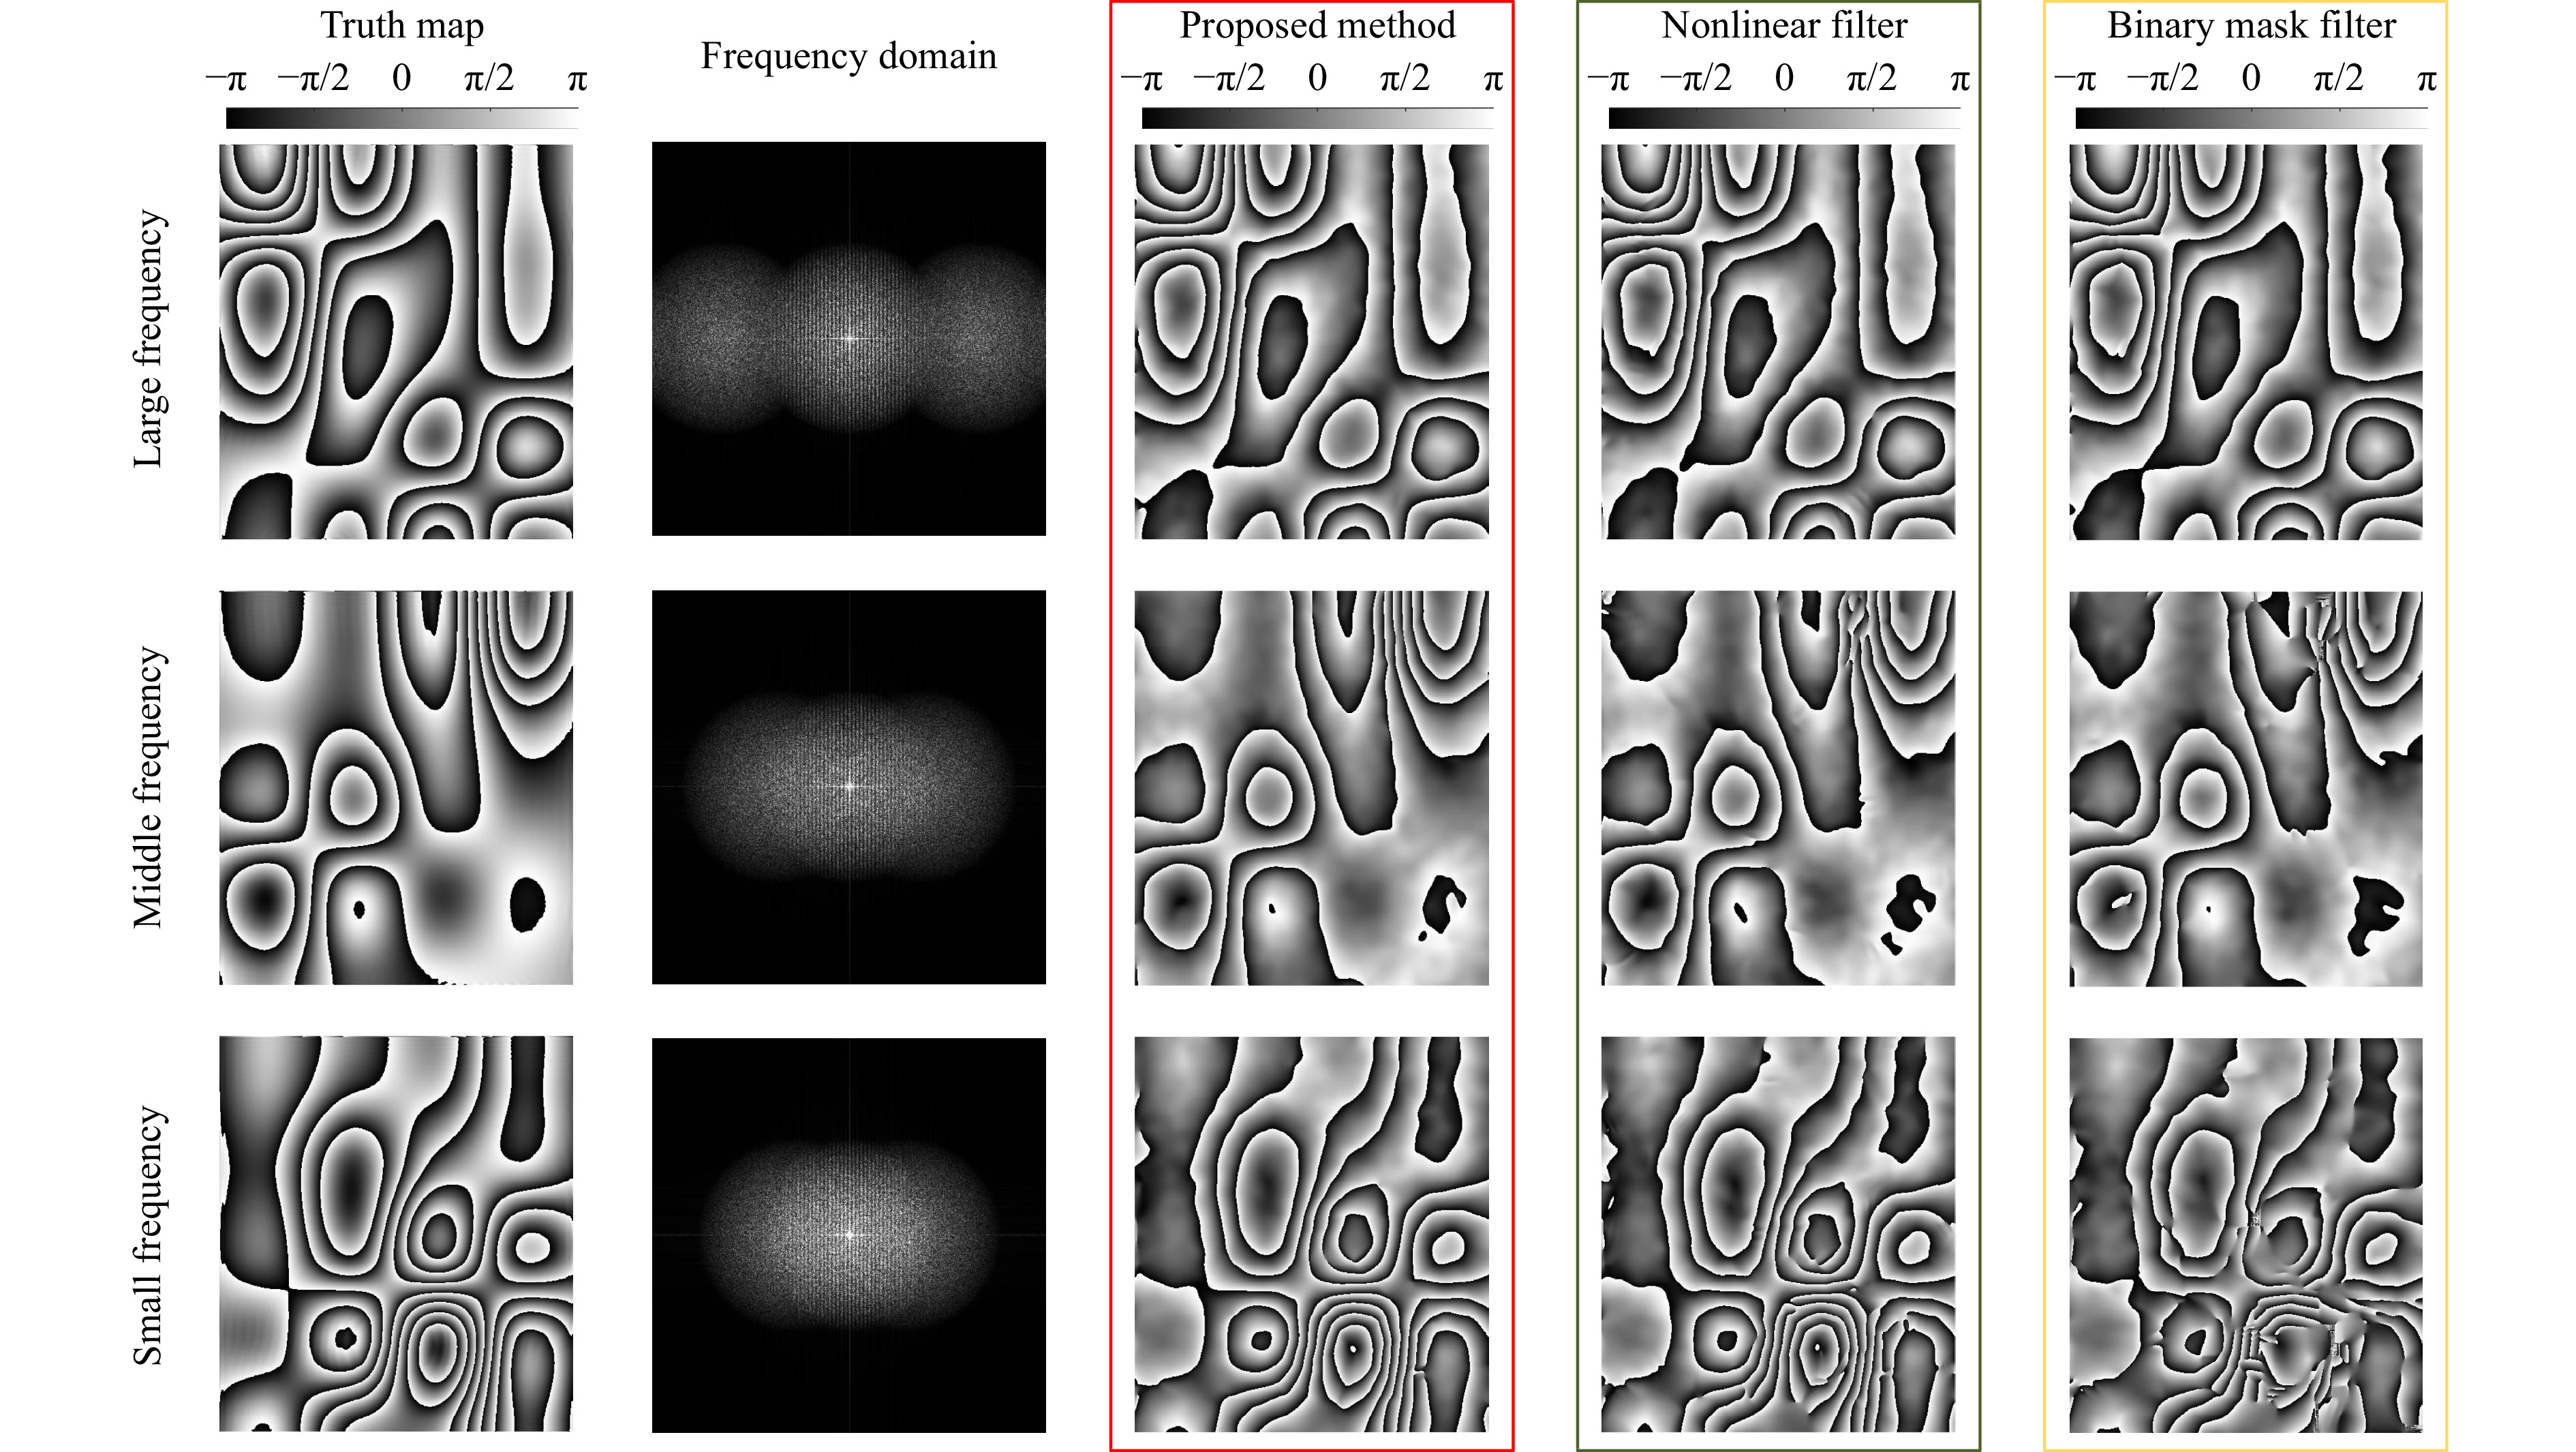
Fig. 7 Comparison of the results of the three phase-extraction methods.
The top row shows almost no overlapping of the spectrum, the middle row shows partial overlapping, and the bottom row shows severe overlapping. The left column is the real image without noise, the frequency domain is the frequency domain of the simulated speckle patterns, the red box contains the phase-extraction results of the method proposed in this study, the green box includes the nonlinear filter phase-extraction results, and the yellow box comprises the phase-extraction results of the binary mask filter.It is observed that in the case of a large carrier frequency and near complete separation of the spectrum, all three methods can extract a high-quality phase fringe map. In the case of partial overlapping of the spectrum, the phase fringe map extracted by the binary mask window phase-extraction method shows clear fringe mixing and local failure, while the nonlinear filter and the proposed method can still extract a relatively high-quality phase. In the case of a small carrier frequency and serious overlapping of the spectrum, the phase fringe map obtained by the nonlinear filter also shows broken fringes, while the proposed method can still obtain a better-quality phase fringe map.
In simulation experiments, because the deformation is known, it is possible to produce a noise-free fringe map, the so-called true map, which enables the objective evaluation of the quality of the phase fringe maps obtained by the aforementioned multiple methods through various evaluation functions. In this study, we used the full-reference evaluation function, the structural similarity index measure (SSIM), which is commonly used in the field of machine vision, with the real image as the reference image and the phase-extraction results as the distortion map27. The SSIM is defined as follows:
$$ SSIM\left( {x,y} \right) = \frac{{\left( {2{\mu _x}{\mu _y} + {C_1}} \right)\left( {2{\sigma _{xy}} + {C_2}} \right)}}{{\left( {\mu _x^2 + \mu _y^2 + {C_1}} \right)\left( {\sigma _x^2 + \sigma _y^2 + {C_2}} \right)}} $$ (20) where
$ {\mu _x} $ ,$ {\mu _y} $ ,$ {\sigma _x} $ ,$ {\sigma _y} $ , and$ {\sigma _{xy}} $ are the local means, standard deviations, and mutual covariances of the$ x,y $ images;$ {C_1},\;{C_2} $ is a non-zero regularization constant. The obtained results matched the trends exhibited by Fig. 7 and are presented in Table 1.SSIM Proposed method Nonlocal method Binary mask method Large frequency 0.8322 0.8135 0.8118 Middle frequency 0.8360 0.8118 0.7858 Small frequency 0.8088 0.7657 0.6703 Table 1. SSIM indices between the results of the three phase-extraction methods and the true map in the case of different spatial carrier frequencies
If the phase-extraction method is not sufficiently strong to resist noise, the larger the deformation of the object, the larger is the obtained phase error. To verify the ability of the proposed method to cope with large-deformation phase extraction, three pairs of speckle patterns with gradually increasing deformation and middle spatial carrier frequency were simulated, and the same methods and settings as above were used to compare the extraction. The results are shown in Fig. 8. From the figure, we can observe that the phase fringe maps obtained by the proposed method still maintain high quality in the process of gradually increasing object deformation, whereas both the nonlinear filter and binary mask filter methods show large-area failure, which will undoubtedly affect the subsequent image processing process, such as unwrapping. The SSIM parameters are compared in Table 2.
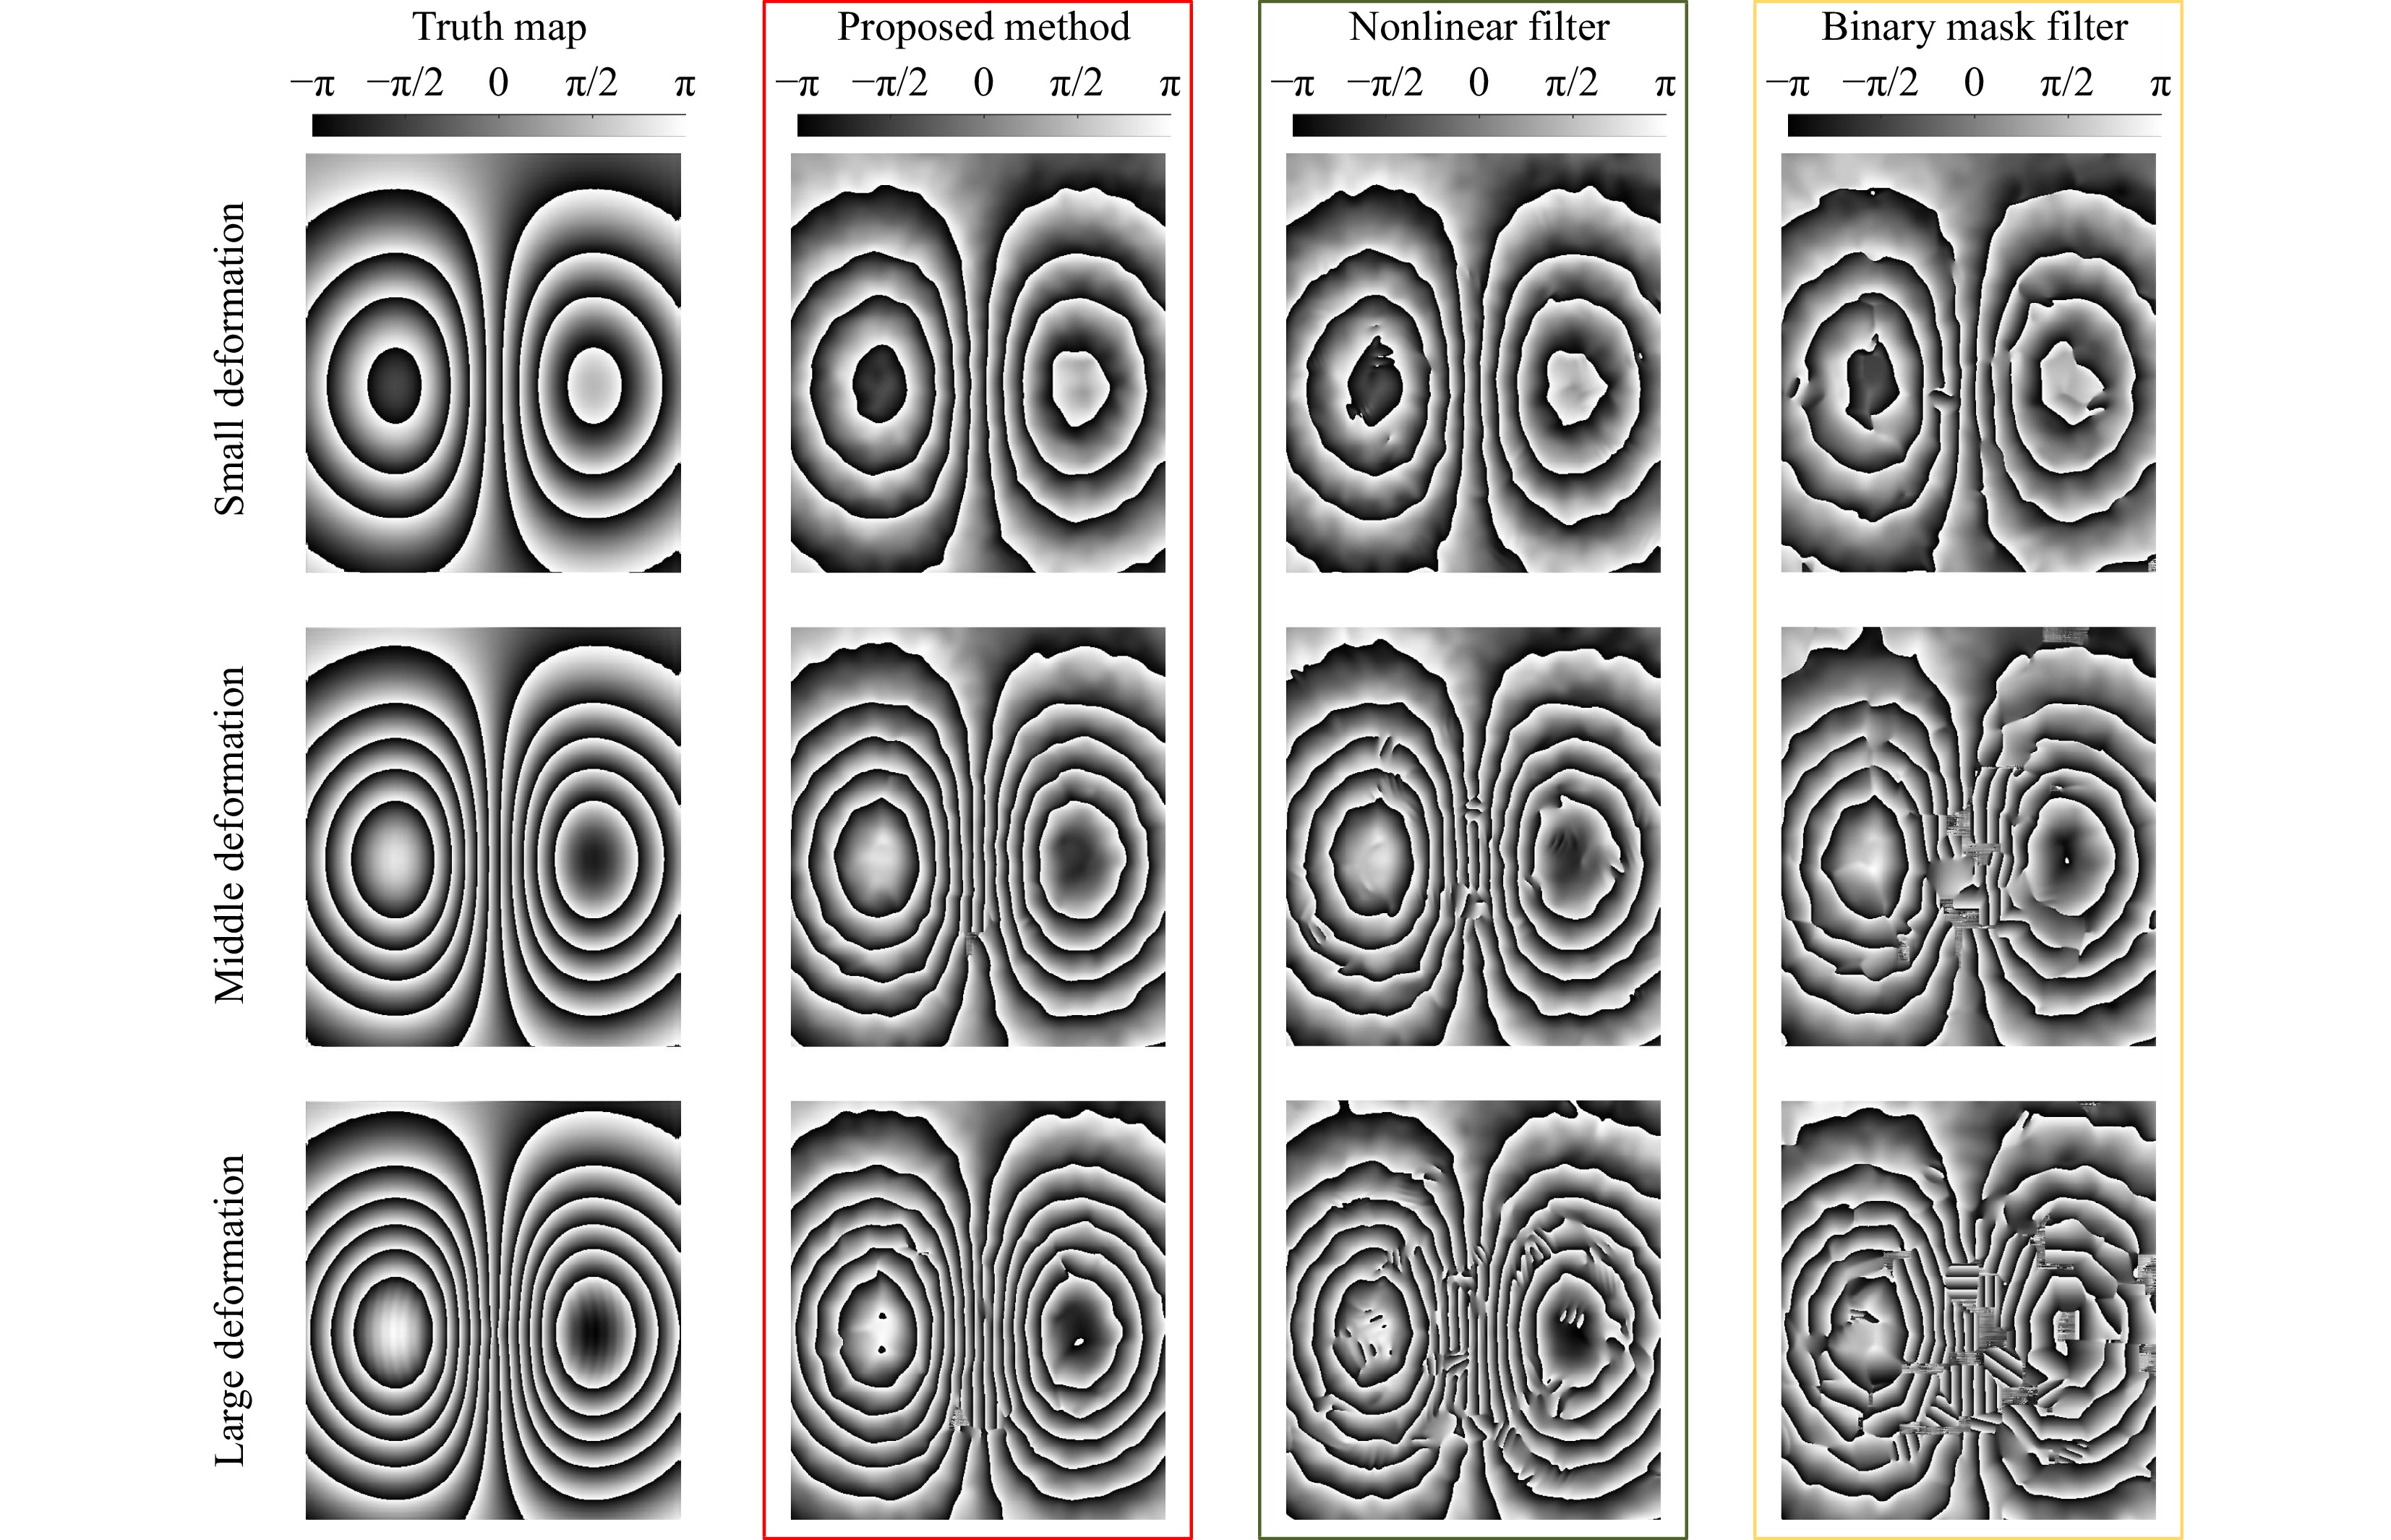
Fig. 8 Comparison of the results of the three phase-extraction methods under different deformation conditions.
The left column is the true image without noise. The red box comprises the phase-extraction results of the method proposed in this paper, the green box includes the nonlinear filter phase-extraction results, and the yellow box contains the binary mask filter phase-extraction results.SSIM Proposed method Nonlocal method Binary mask method Small deformation 0.8491 0.8093 0.7664 Medium deformation 0.8117 0.7621 0.7021 Large deformation 0.7821 0.6968 0.6084 Table 2. SSIM indices between the results of the three phase-extraction methods and the true map in the case of different object deformations
-
To verify the ability of the proposed method to cope with spectrum overlapping phase extraction in a real experimental environment, a spatial carrier shearography system was built for the experiment, the layout of which is shown in Fig. 9.
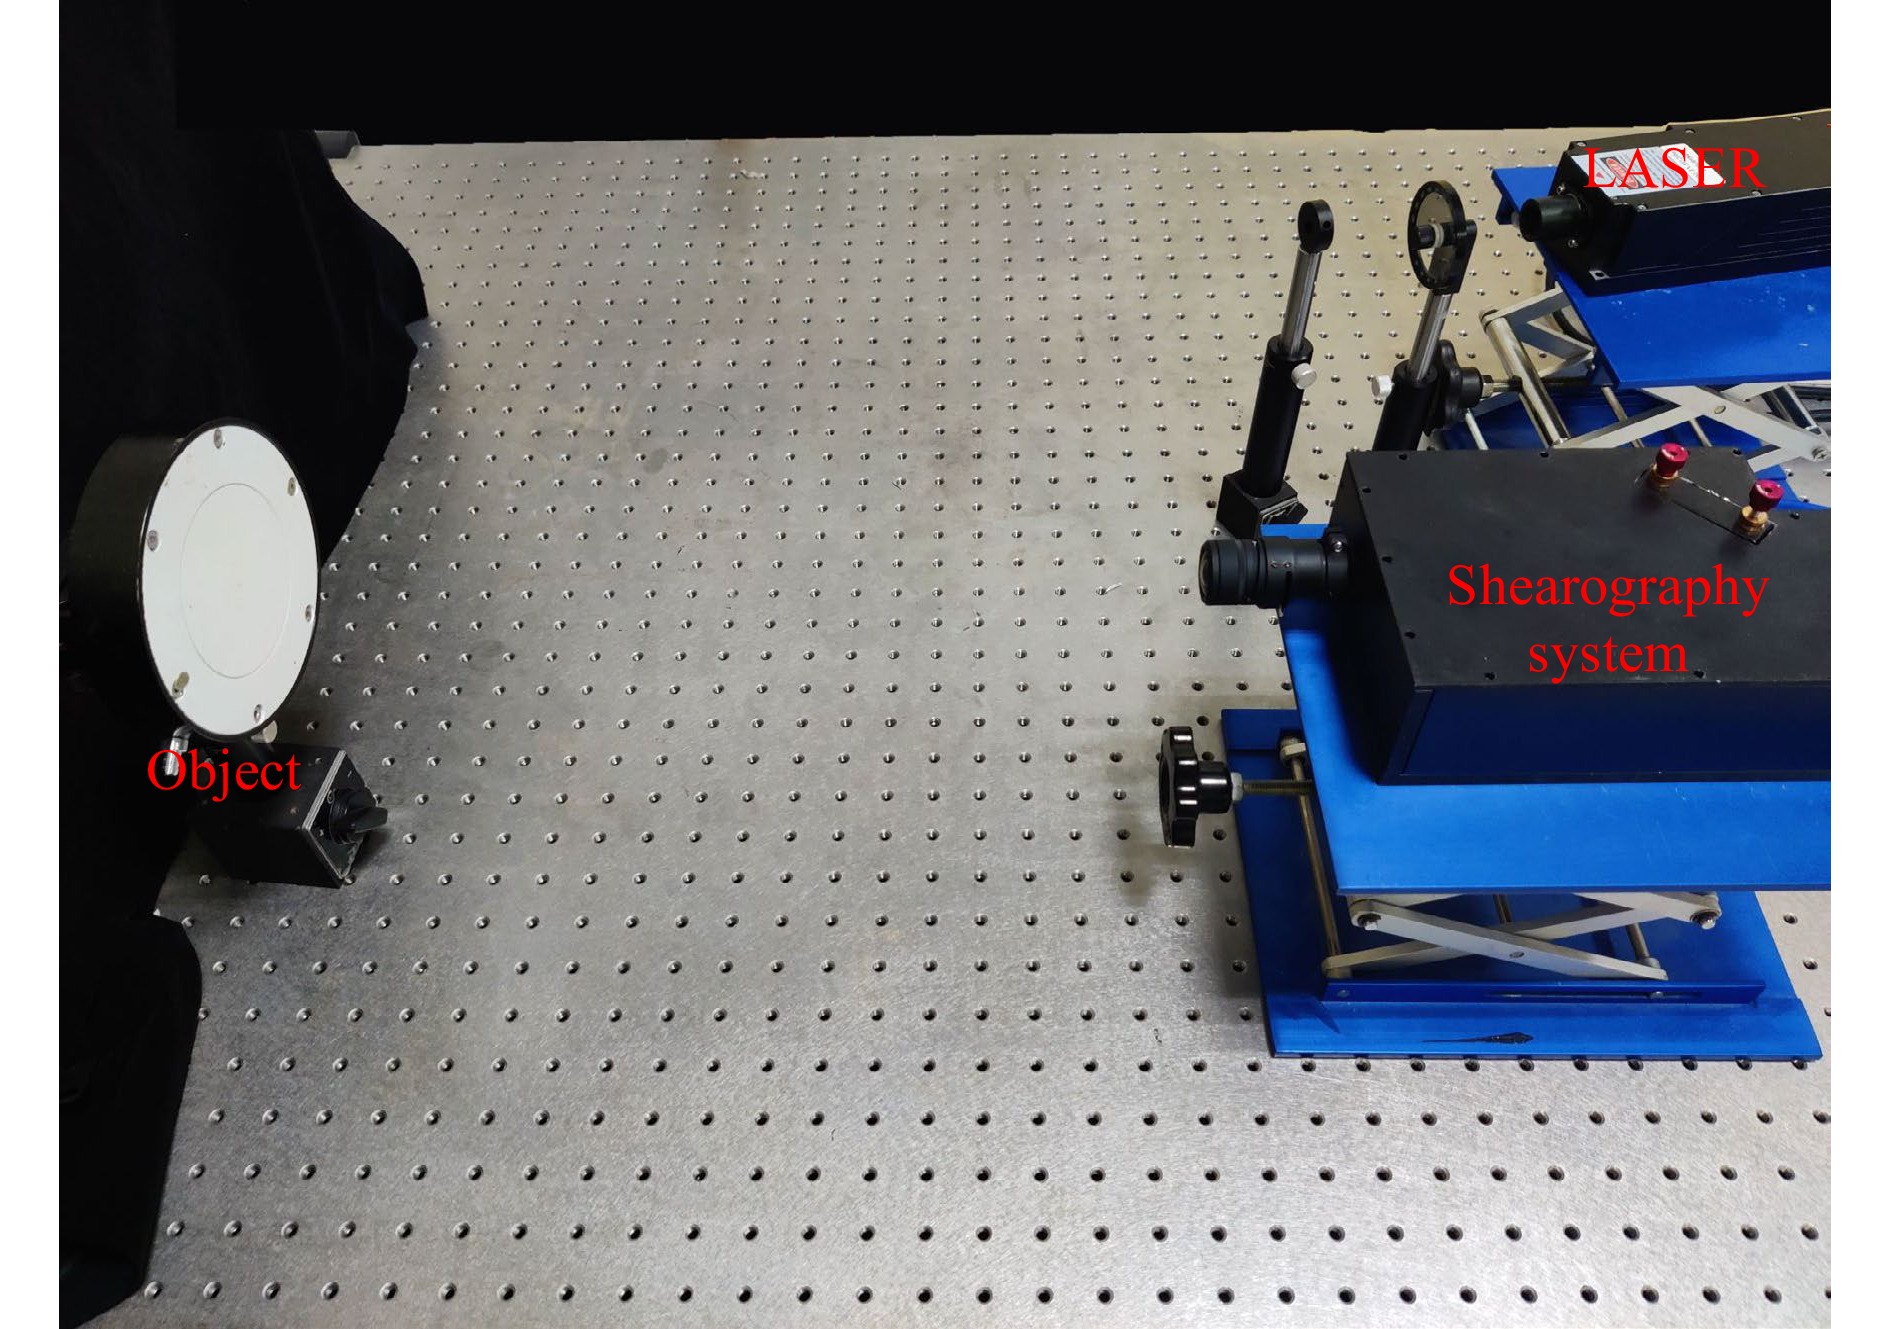
Fig. 9 Layout of the shearography system
The illumination source was a single longitudinal mode solid-state laser with a wavelength of 532 nm and a power of 200 mW. The shearography interferometer structure included a 4-f Mach–Zehnder interferometer, which uses an imaging lens with a focal length of 16 mm, and two Fourier lenses with a focal length of 60 mm. Monochrome camera with resolution of 2048 × 2448 pixels and pixel size of 3.45 × 3.45 µm was used to acquire the speckle patterns, the camera acquires speckle patterns at a fixed rate of 10 frames per second. A metal disk with a fixed edge was selected as the sample object for detecting object deformation, and a spiral micrometre was placed against the centre of the back of the metal disk and caused Gaussian-like deformation by rotating it. Two speckle patterns were acquired before and after object deformation, followed by phase extraction and subtraction using the three methods described above. Here,
${\sigma _0}{\text{ = }}1.2,\;{\sigma _{\max }} = 2.5, dr = 1,$ and the results were similarly WFF-filtered. The phase fringe is shown in Fig. 10.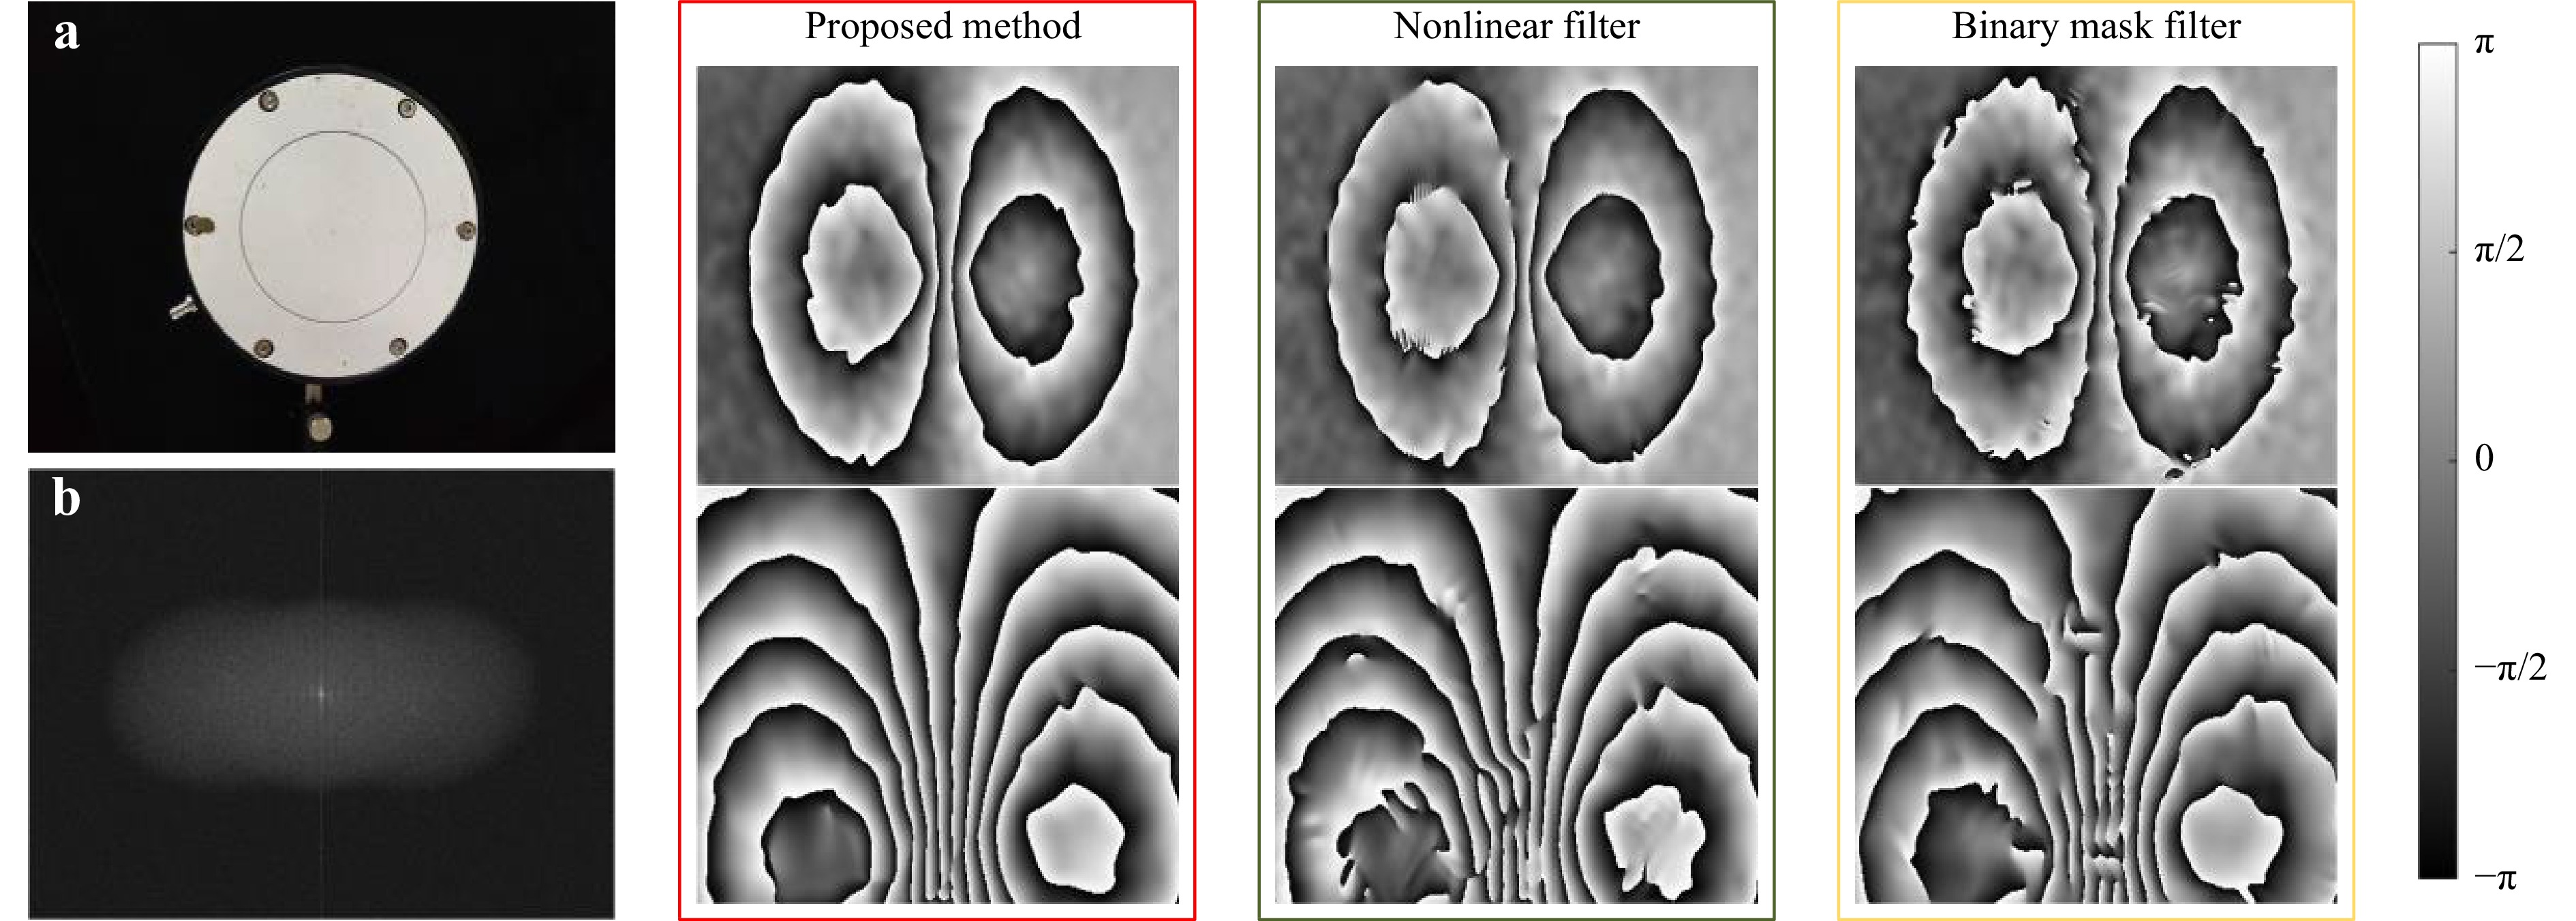
Fig. 10 Comparison of the results of the three phase-extraction methods based on disk samples. a Disk sample and b spectrum of speckle pattern. The red box contains the phase-extraction results of the method proposed in this paper, the green box comprises the nonlinear filter phase-extraction results, and the yellow box includes the binary mask filter phase-extraction results.
As seen in Fig. 10, the top row shows the phase extraction results in the case of small deformation and sparse fringe map, and the bottom row shows the phase extraction results in the case of large deformation and dense fringe map, in the real experimental case of partial overlapping of the spectrum, both the nonlinear filter and the binary mask filter show different levels of fringe blurring and broken lines, while the phase fringe map obtained by the proposed method is very smooth.
To verify the effectiveness of the proposed method in the defect detection application, a standard specimen manufactured by Dantec Corp. with air pressure loading was used as the test object, which contained several defects at different depths, as shown in Fig. 11. A closed cavity at the rear of the specimen was connected to an external air pump. The air pump caused a change in the air pressure inside the cavity and deformed the surface of the object corresponding to the internal defects, in contrast to the rest of the specimen.
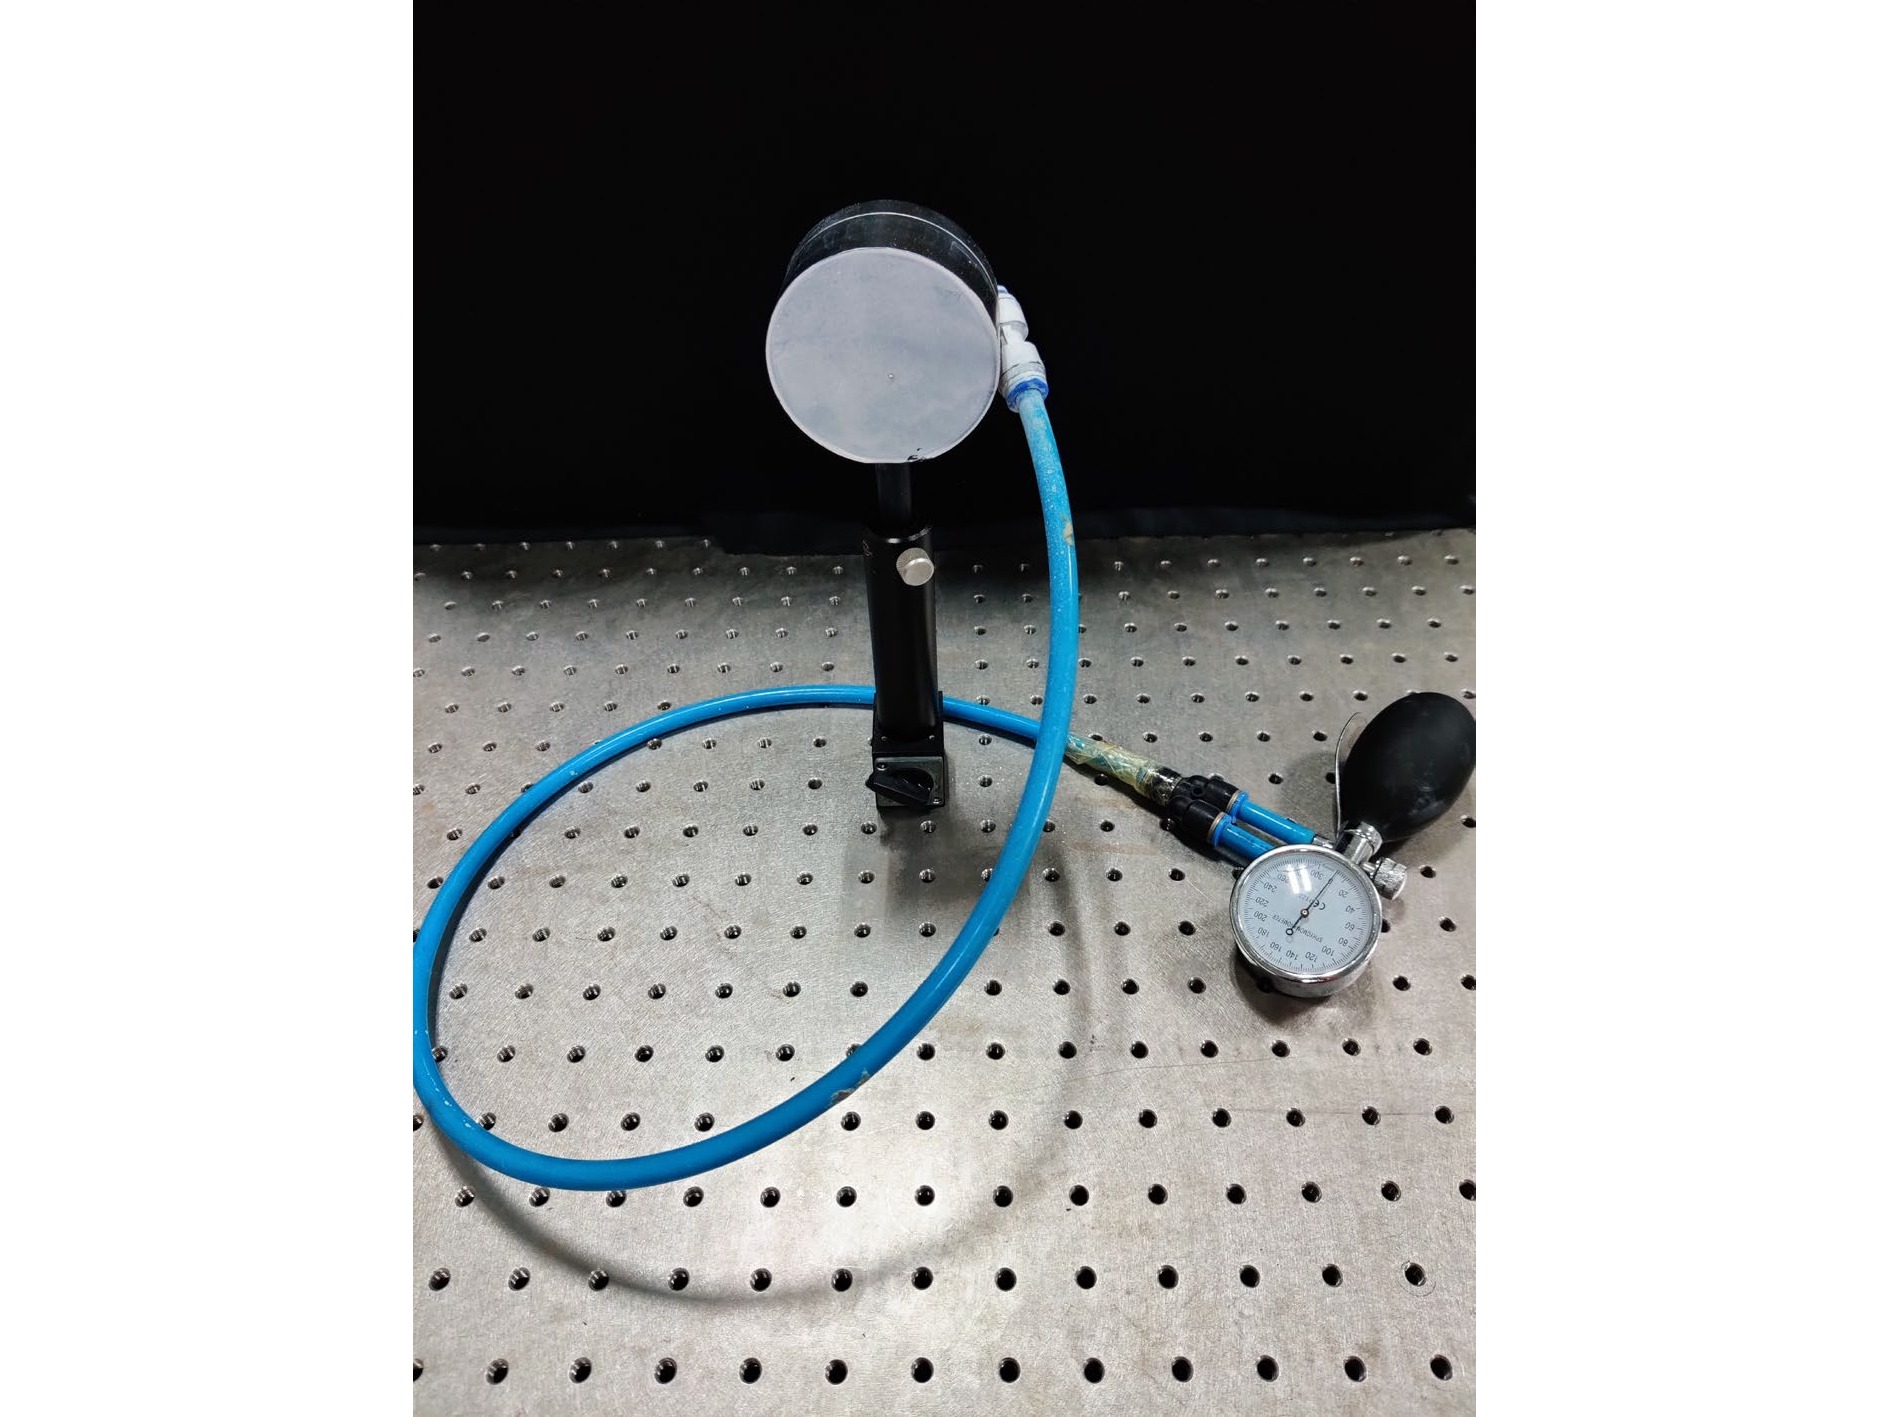
Fig. 11 Pressure-loaded specimens.
The air pressure in the cavity was loaded to 10.64 kPa (80 mmHg) using the air pump and then uniformly released to 2.66 kPa (20 mmHg). During this process, the camera acquired a total of 90 images at a fixed frame rate. Because the object deformation between adjacent moments was very small and the phase change was not clear, three nodes of the 4th, 50th, and 90th speckle patterns were selected for phase calculation, with the 4th shearogram as the phase map before deformation. The 50th and 90th shearograms were used to calculate the phase change, and the results are shown in Fig. 12.
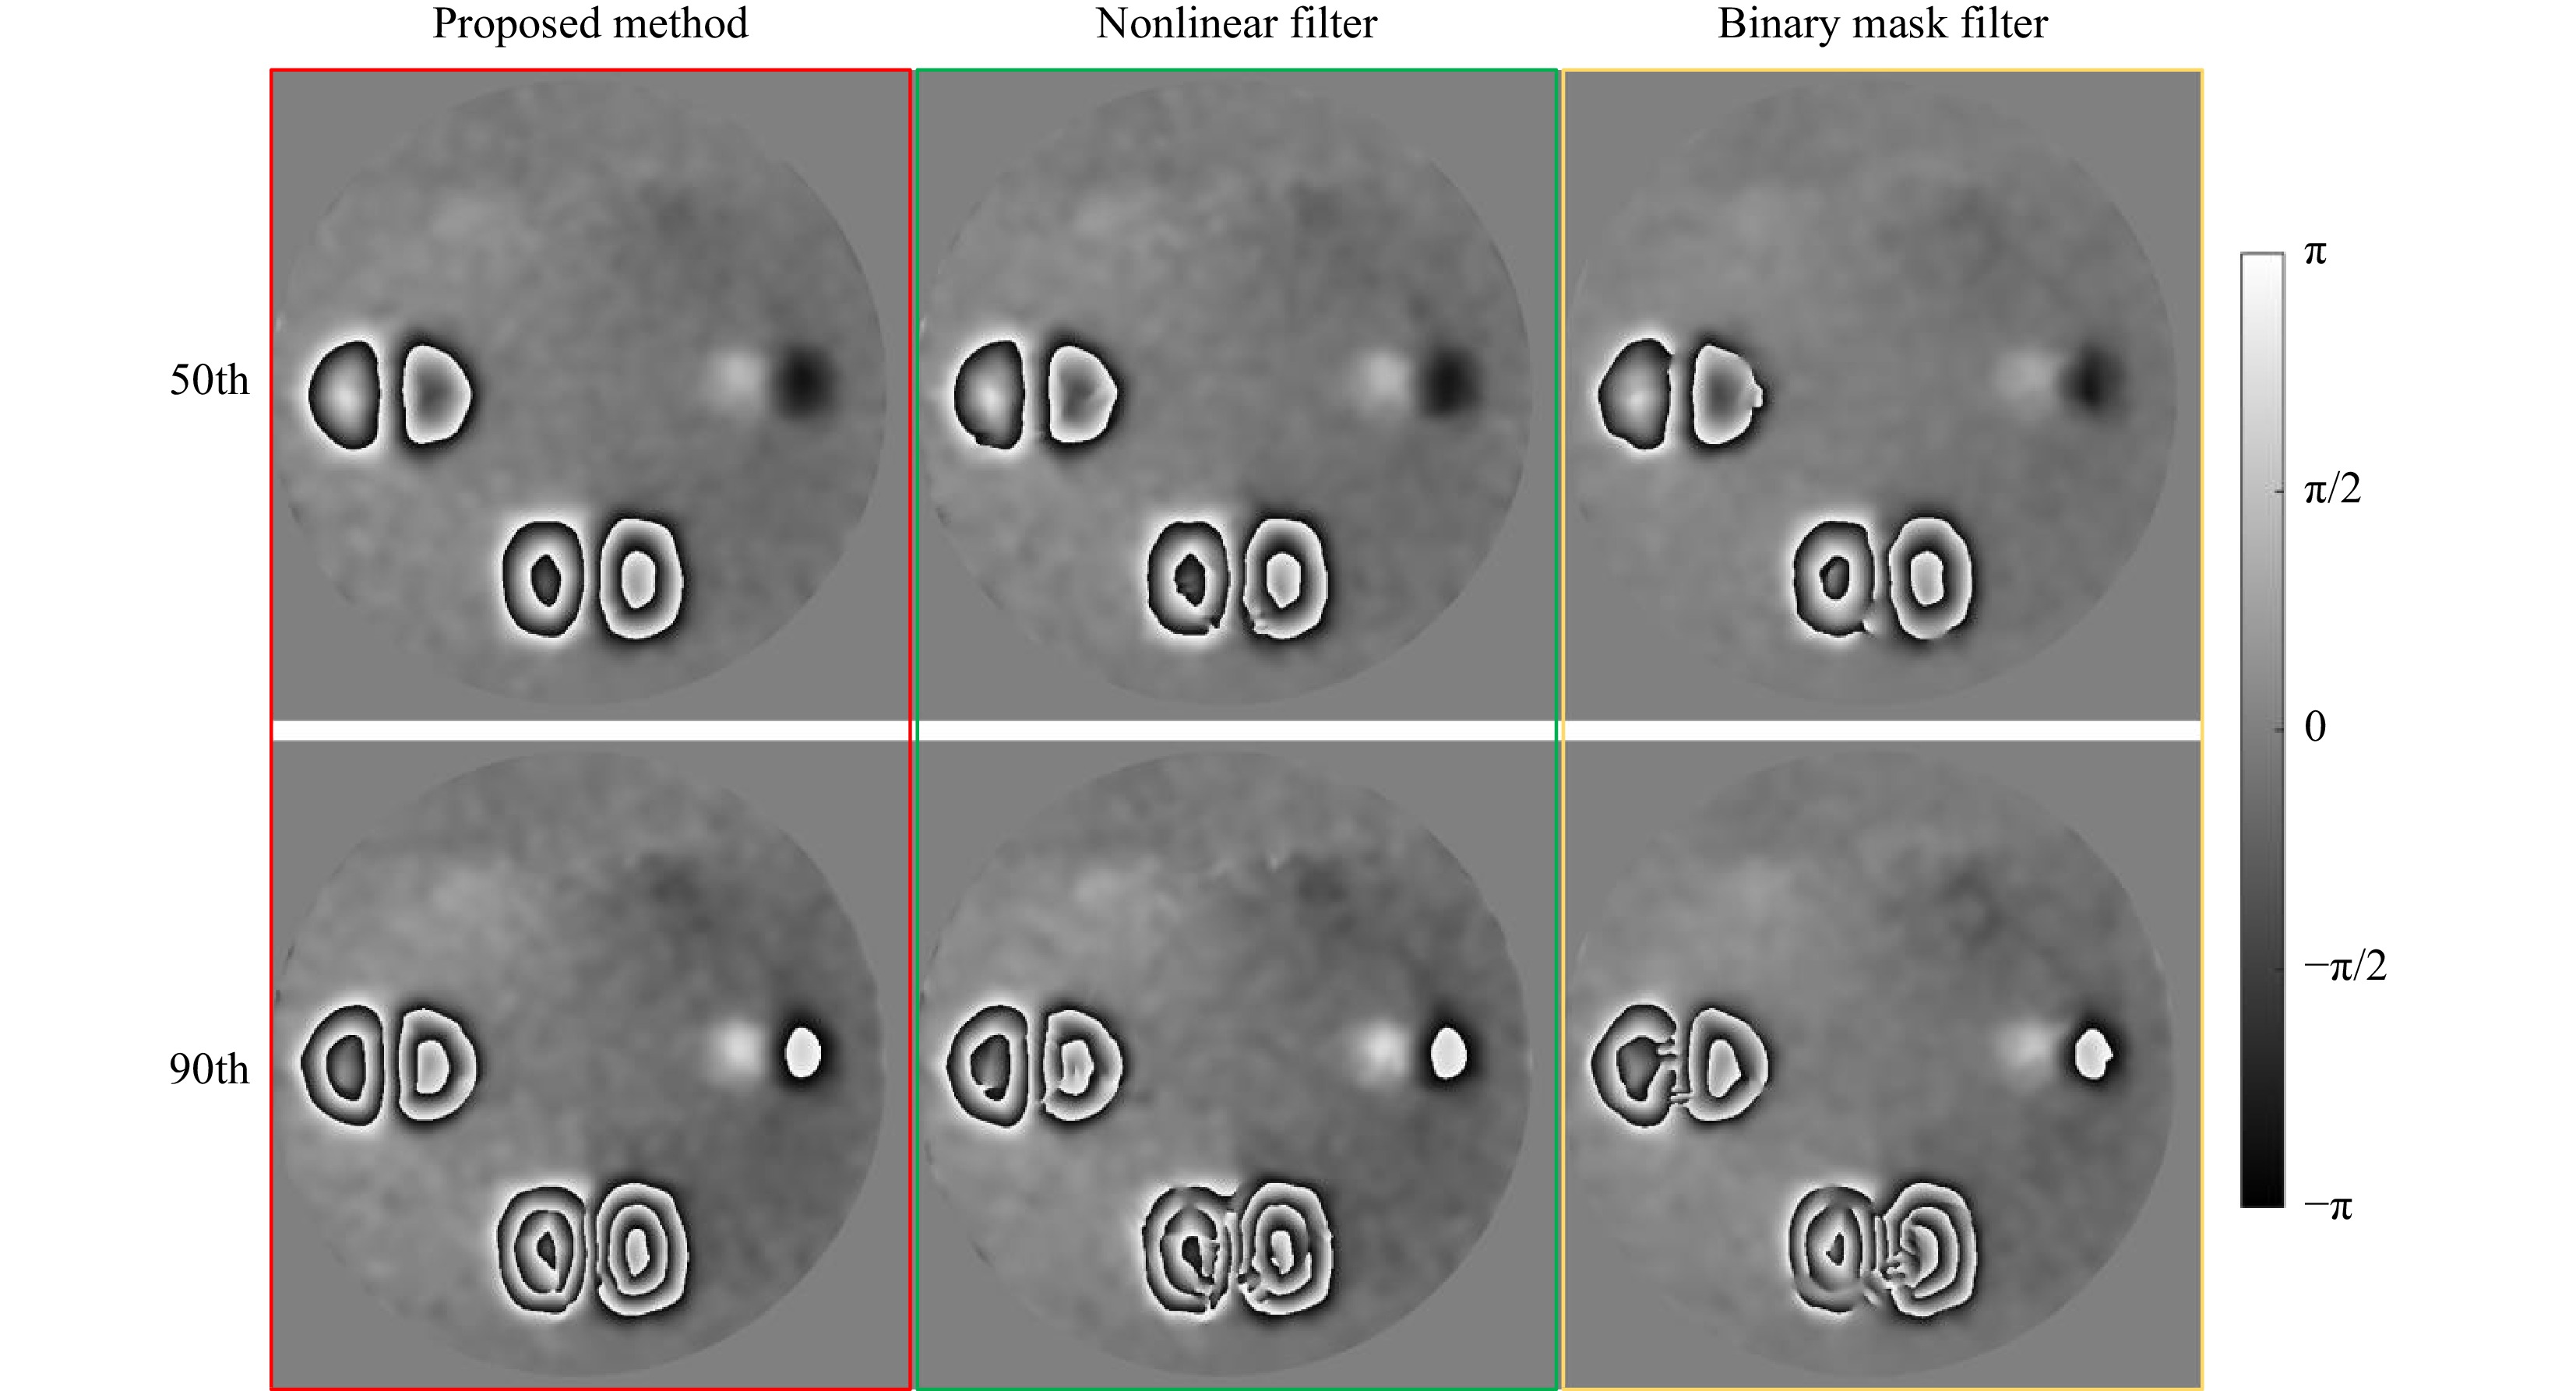
Fig. 12 Comparison of defect detection experimental results.
The upper row corresponds to the deformation of the 50th shearogram, and the lower row corresponds to the deformation of the 90th shearogram. The left column presents the phase fringe pattern extracted by the method described in this paper, the middle column presents the nonlinear filter results, and the right column includes the binary mask filter results.It is observed that when calculating the 50th shearogram, all three methods can extract the phase information well, although the out-of-line binary mask filter stripe is partially blurred. When the 90th shearogram was calculated, the measured phase was still accurately extracted by the proposed method in the case of dense deformation, whereas both filter extraction methods had significant phase errors. After unwrapping the 90th fringe map using the path-independent phase unwrapping method, the obtained unwrapped phase map clearly shows the difference in the accuracy of the three methods of extracting the phase, as shown in Fig. 1328.
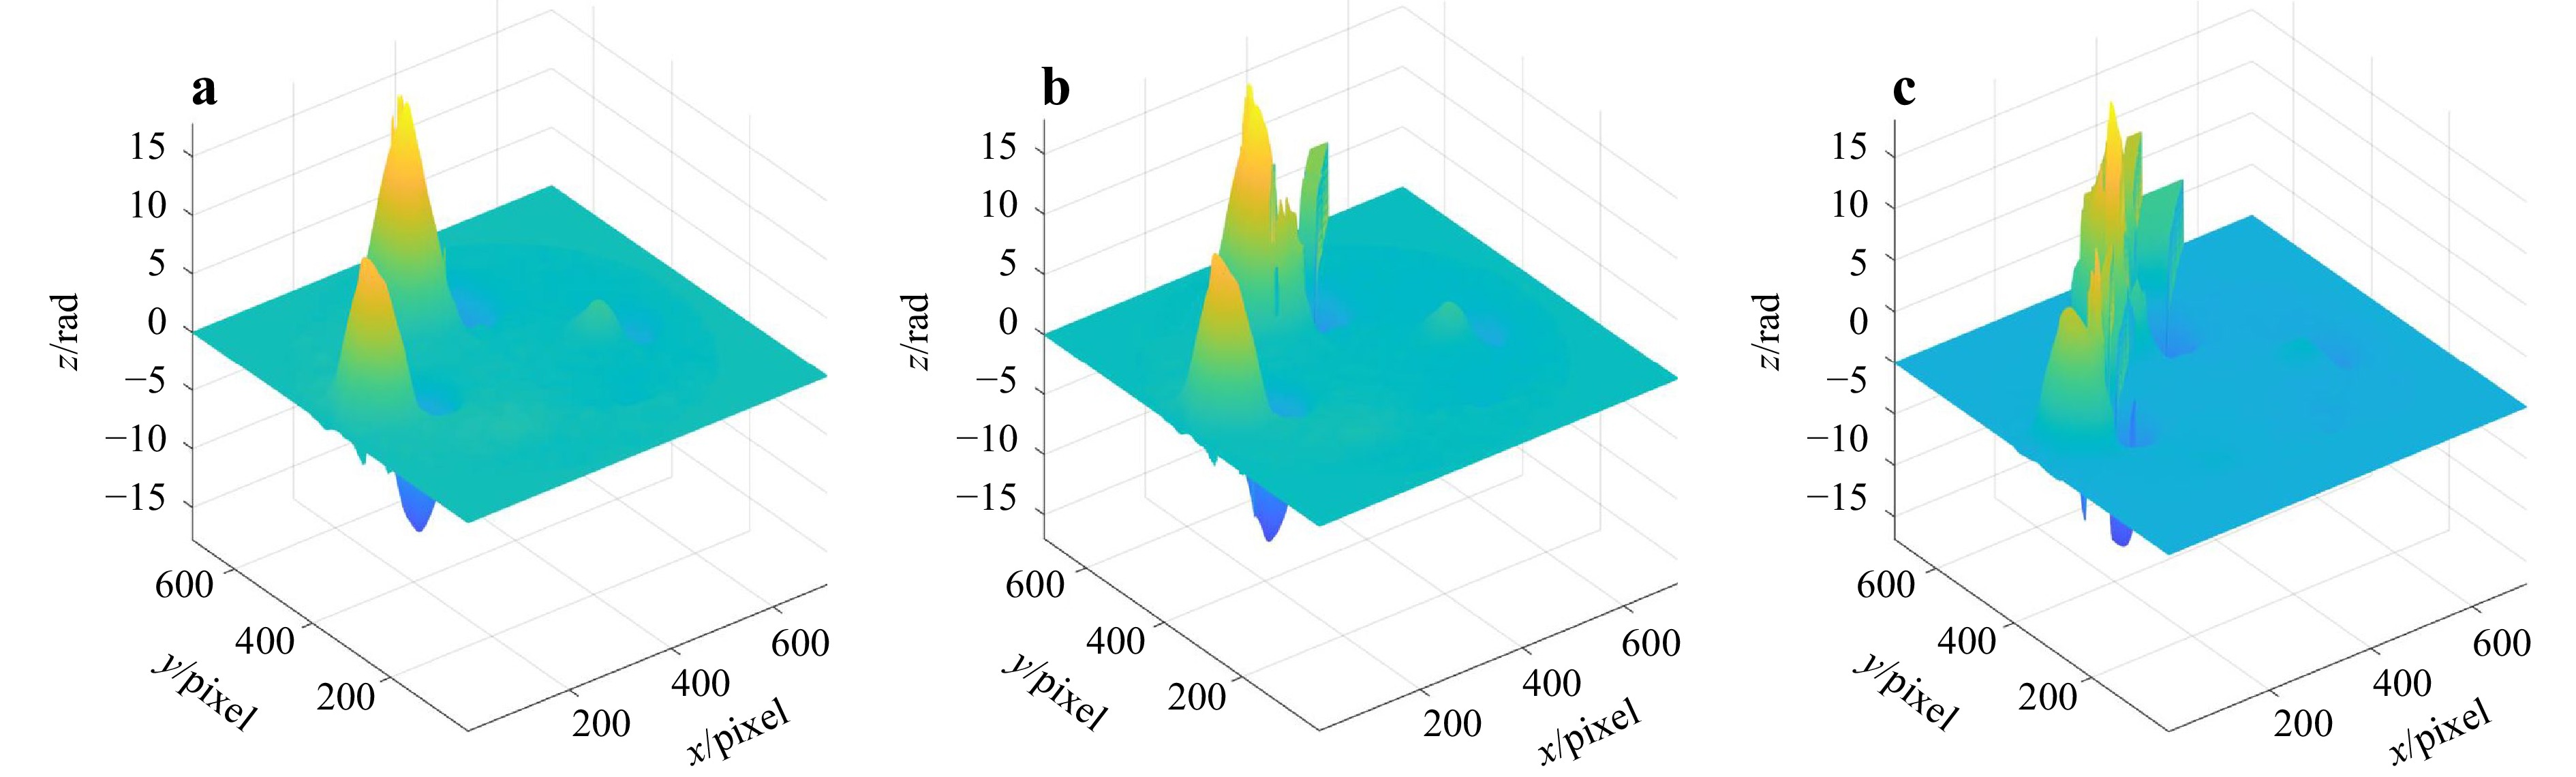
Fig. 13 Comparison chart of unwrapping results of the three phase-extraction methods. a Unwrapped phase map of the method proposed in this paper, b unwrapped phase map of the nonlinear filter, and c unwrapped phase map of the binary mask filter.
-
After numerical simulations and experiments, it is verified that the proposed phase extraction method is robust enough to cope with the spectrum overlapping situation, and the effect is improved compared with the phase extracted by the bandpass filter. The time required to compute 8-bit speckle patterns size of 550 × 550 pixel for the three phase extraction methods is shown in the Table 3 below, and the CPU used is i5-12600k.
Proposed method Nonlocal method Binary mask method Time(s) 20.938773 0.578554 0.461822 Table 3. Time comparison of three algorithms
The precise determination of frequency band can improve the speed of algorithm operation, but it is difficult to improve the phase extraction effect again. Because the proposed method scans within a certain interval, a good phase-extraction effect can be achieved by approximately determining the frequency band. Further artificially adjusting the frequency band would not significantly improve the effectiveness of the algorithm. Meanwhile, the parameters that have a significant impact on the phase-extraction results are dr and
$ {\sigma }_{0} $ . When the radius of the objective spectrum is large and the spectrum overlapping is not particularly serious, increasing dr and decreasing$ {\sigma }_{0} $ will improve the phase-extraction results. When the radius of the object spectrum is small, regardless of whether the overlap is significant, the adoption of a smaller dr will yield better results. -
In this paper, we review the causes of spectrum overlapping in spatial phase-shifting shearography and propose a phase-extraction method that can extract high-quality phase maps when spectrum overlapping occur. Owing to the ability of the WFR to seek optimisation, the method can theoretically extract a high-quality phase, which cannot be achieved by previous methods. By analysing the frequency domain of the speckle patterns, the proposed method can quickly and effectively determine the parameters of the WFR and make adaptive adjustments during WFR traversal. This shortens the algorithm running time to a certain extent, avoids the situation of falling into local maxima, and improves the WFR algorithm performance.
The effectiveness of the proposed method was validated using both numerical simulations and experiments. Simulated speckle patterns with different deformations and spatial carrier frequencies were produced, and two bandpass filter phase-extraction methods were used for comparison. The obtained results verified the robustness of the proposed method in the case of severe spectrum overlapping and large deformations. Subsequently, a spatial carrier shearography system was set up and two different specimens were selected to examine the accuracy of the proposed method. The experimentally obtained phase fringe map and its unwrapped results verified the advantages of the proposed method over traditional methods. The application of spatial carrier shearography is limited by the coupling of shearing amount and spatial carrier frequency and the adoption of this method can, to a certain extent, ignore the coupling. This is conducive to expanding the application range of shearography and improving its applicability so that it can be used in a wider range of industrial inspection scenarios.
-
This work was supported by the National Key Research and Development Program of China (No. 2016YFF0101803) and Hefei Municipal Natural Science Foundation (No. 2021017).
A robust phase extraction method for overcoming spectrum overlapping in shearography
- Light: Advanced Manufacturing 4, Article number: 7 (2023)
- Received: 14 October 2022
- Revised: 15 February 2023
- Accepted: 15 February 2023 Published online: 20 March 2023
doi: https://doi.org/10.37188/lam.2023.007
Abstract: The advantage of spatial phase-shifting shearography is its ability to extract the phase from a single speckle pattern; however, it often faces spectrum overlapping, which seriously affects phase quality. In this paper, we propose a shearography phase-extraction method based on windowed Fourier ridges, which can effectively extract phase information even in the presence of severe spectrum overlapping. A simple and efficient method was applied to determine the parameters of the windowed Fourier ridges, and a linear variation window was used to match the phase-extraction requirements for different frequency coordinates. A numerical simulation was quantitatively conducted to compare the phase-extraction results of the proposed method with those of the conventional method for various cases, and a shearography system was built with two types of objects to demonstrate the feasibility of the proposed method.
Research Summary
Phase extraction with spectrum overlapping in shearography
Due to the coupling relationship between shearing amount and spatial carrier frequency, the spatial carrier shearography often suffers from spectrum overlapping, which seriously affects the quality of extracted phase.
Recently, Prof. Yonghong Wang and his team from Hefei University of Technology, published a research paper on Light: Advanced Manufacturing, entitled A robust phase extraction method for overcoming spectrum overlapping in shearography. The method proposed by the study is based on an improved windowed Fourier ridge algorithm to achieve high quality phase extraction in spectrum overlapping. Simulations and real experiments are conducted to verify the effectiveness of the proposed method for various cases.


Rights and permissions
Open Access This article is licensed under a Creative Commons Attribution 4.0 International License, which permits use, sharing, adaptation, distribution and reproduction in any medium or format, as long as you give appropriate credit to the original author(s) and the source, provide a link to the Creative Commons license, and indicate if changes were made. The images or other third party material in this article are included in the article′s Creative Commons license, unless indicated otherwise in a credit line to the material. If material is not included in the article′s Creative Commons license and your intended use is not permitted by statutory regulation or exceeds the permitted use, you will need to obtain permission directly from the copyright holder. To view a copy of this license, visit http://creativecommons.org/licenses/by/4.0/.

 DownLoad: