


HTML
-
A line-shaped beam formed by a cylindrical lens and diffractive optical elements (DOEs) has been employed for increasing the processing speed in laser grooving of silicon wafers1, laser scribing of indium tin oxide (ITO) films2 and thin-film solar cells3, and laser cleaving of glass substrates4. In laser grooving and scribing using a conventional Gaussian beam, undesired melting of the material due to thermal conduction, called the heat-affected zone (HAZ), occurs around the processed area if the intensity at both ends of the Gaussian profile is below the ablation threshold of the substrate material. This becomes more remarkable when nanosecond and picosecond pulses are employed. Also, the center peak intensity of the Gaussian beam may cause serious damage to the substrate. A line-shaped beam is useful for reducing the HAZ and suppressing damage to the substrate because of its uniform intensity profile.
In laser grooving and scribing, control of the structural depth is important for performing precise processing. To obtain the desired depth of the processed structure, optimal processing parameters (e.g., wavelength, pulse energy, pulse duration, pulse repetition rate, beam spot size and its focal position, and scanning speed) should be explored according to the target material. Due to the lack of a general theoretical framework for the physical phenomena involved in laser processing, a complex set of parameters is usually explored experimentally. Verification in post-processing using scanning electron microscopy (SEM) and atomic force microscopy (AFM) provides a wealth of information to optimize the set of parameters based on a high-resolution image of the processed structure. The post-processing is iteratively performed until the desired structure is obtained. Accordingly, significant time and production costs are required. Also, the post-processing yields only a static image of the processed structure and does not provide access to dynamic processes during laser processing.
To overcome these issues, in-process monitoring of the depth of the processed structure in laser drilling of silicon with picosecond pulses has been demonstrated5. The laser processing system was combined with a transmission optical microscope to obtain a side view image of the processed structure. There are some potential advantages to in-process monitoring. The first advantage is that monitoring the advance of the ablation front enables appropriate real-time feedback control of the processing parameters. Therefore, the processing of unknown materials could be done without a priori knowledge related to optimal processing parameters. Another advantage is the ability to directly observe the processed structure without complex sample preparation such as cut-and-polish post-processing. However, with in-process monitoring using an optical microscope, the target samples are limited to materials that are transparent to the illumination light of the microscope. Also, in observing using a microscope, processing is limited to drilling close to the side surface of the sample to prevent diffraction from the edge of the sample6.
Other methods for measuring the depth of the processed structure are laser-scanning confocal microscopy (LCM), white-light interferometry (WLI)7, optical coherence tomography (OCT)8, ultrasound and X-ray tomography, and magnetic resonance imaging (MRI). The spatial resolution of ultrasound and X-ray tomography and MRI as medical imaging techniques is from sub-millimeter to a few millimeters. On the other hand, LCM, WLI and OCT, with a resolution from sub-micron to a few microns, are suitable for laser microfabrication. An advantage of OCT compared with LCM and WLI is the ability to perform non-mechanical depth scanning (A-scan) and single-shot measurement. Accordingly, it is possible to perform laser processing while simultaneously measuring the depth of the processed structure. Another advantage is the measurement speed and the measurable range of a few millimeters. Recently, OCT with an A-scan rate of a few megahertz has been demonstrated for clinical applications9. Therefore, OCT is superior for in-process monitoring of laser processing. Previously, in-process monitoring of the depth of the processed structure in laser processing of stainless10,11, glass12, acrylic13 and ABS resins14, and biomaterials15−17 has been demonstrated using OCT. In particular, the improvement of hole depth accuracy in laser processing using OCT has been reported18.
In this paper, we demonstrated, for the first time, in-process monitoring of structures processed with line-shaped femtosecond pulses generated by a computer-generated hologram (CGH) displayed on a spatial light modulator (SLM)19−21. The in-process monitoring was performed using swept-source OCT (SS-OCT)22. The proposed method is suitable for in-process OCT measurement during femtosecond laser processing because the shaped beam processes a large area at high speed as shown in the processing results using the line-shaped beam. In addition, the variability of the CGH by the SLM is useful for feedback control of the intensity distribution of the shaped beam based on the in-process OCT measurement. The spatial resolution of laser processing using ordinary focused femtosecond pulses is generally higher than the lateral measurement resolution of the OCT. Therefore, the OCT may not provide valid measurement result depending on the relationship between the resolution of laser processing and OCT measurement.
In the Principle section, the advantage and basis of SS-OCT and the calibration process of the signal obtained by OCT are described. In the Experimental Setup section, the optical system used for the experiments is shown. In the Experimental Results section, to evaluate the performance of the SS-OCT system, the depth resolution, measurement accuracy, and measurable range were estimated. Furthermore, to verify the feasibility of SS-OCT for in-process monitoring of the depth of the processed structure in femtosecond laser processing, multi-ring drilling was performed using a conventional Gaussian beam. Finally, in-process monitoring of the depth of the processed structure in laser grooving with line-shaped femtosecond pulses was performed. To our knowledge, this is the first demonstration of its kind. From the results, not only the depth of the processed structure but also the shape of the structure and the distribution of deposited debris in the processed groove were simultaneously monitored. The measured depth agreed well with the results obtained using LCM. In the Conclusion section, we summarize our paper.
-
OCT is classified into time-domain OCT (TD-OCT)8 and frequency-domain OCT (FD-OCT)23. FD-OCT is characterized by relatively faster and higher signal-to-noise ratio (SNR) measurement compared to TD-OCT. FD-OCT is further classified into spectral-domain OCT (SD-OCT) and SS-OCT. In SD-OCT, a broadband source with a center wavelength of approximately 840 nm is often used for the measurement, where the light reflected from the sample is detected by a spectrometer. The spectrometer usually employs a silicon-based line sensor because the other compound semiconductor sensors have practical difficulties in terms of cost and sensitivity. Therefore, the wavelength range, which is easily applicable to SD-OCT, is less than about 1 μm. In SS-OCT, a broadband wavelength swept source with a center wavelength of approximately 1.06 or 1.30 μm is often employed, where the light is detected by a point photodetector. Currently, photodetectors with sensitivity to a variety of wavelengths are available, so there is a high degree of freedom in selecting the wavelength of the light source.
In this experiment, SS-OCT with a center wavelength of 1.30 μm was employed because SS-OCT has several advantages over SD-OCT. The first advantage is a simple optical system with a photodetector. In particular, the use of a balanced photodetector allows high-SNR measurement. The second advantage is that since a 1.3 μm light has been widely used in optical communications, many fiber components are available at a relatively low cost. In addition, since the group velocity dispersion of the fiber components is zero at a wavelength of 1.3 μm, the interferometer can be constructed simply. The third advantage is that the wavelength for the measurement can be easily separated from the wavelength for ultrashort pulsed laser processing using broadband light sources (e.g., Ti:sapphire, 800 nm; Nd:YAG, 1064 nm; and Yb:silica fiber, 1030 nm). Therefore, since the two beams for processing and the measurement are coaxially radiated onto the sample, in-process monitoring of the depth of the processed structure during laser processing is possible. Another advantage is less impact on the measurement by debris generated by laser processing because the wavelength of SS-OCT is longer than that of SD-OCT.
-
The beam emitted from a swept-light source in SS-OCT is split by a beam splitter (BS) into object and reference light beams, as shown in Fig. 1. The signal detected by the photodetector,
$ {s} $ ($ {k} $ ), is based on interference between the object and reference beams and is described as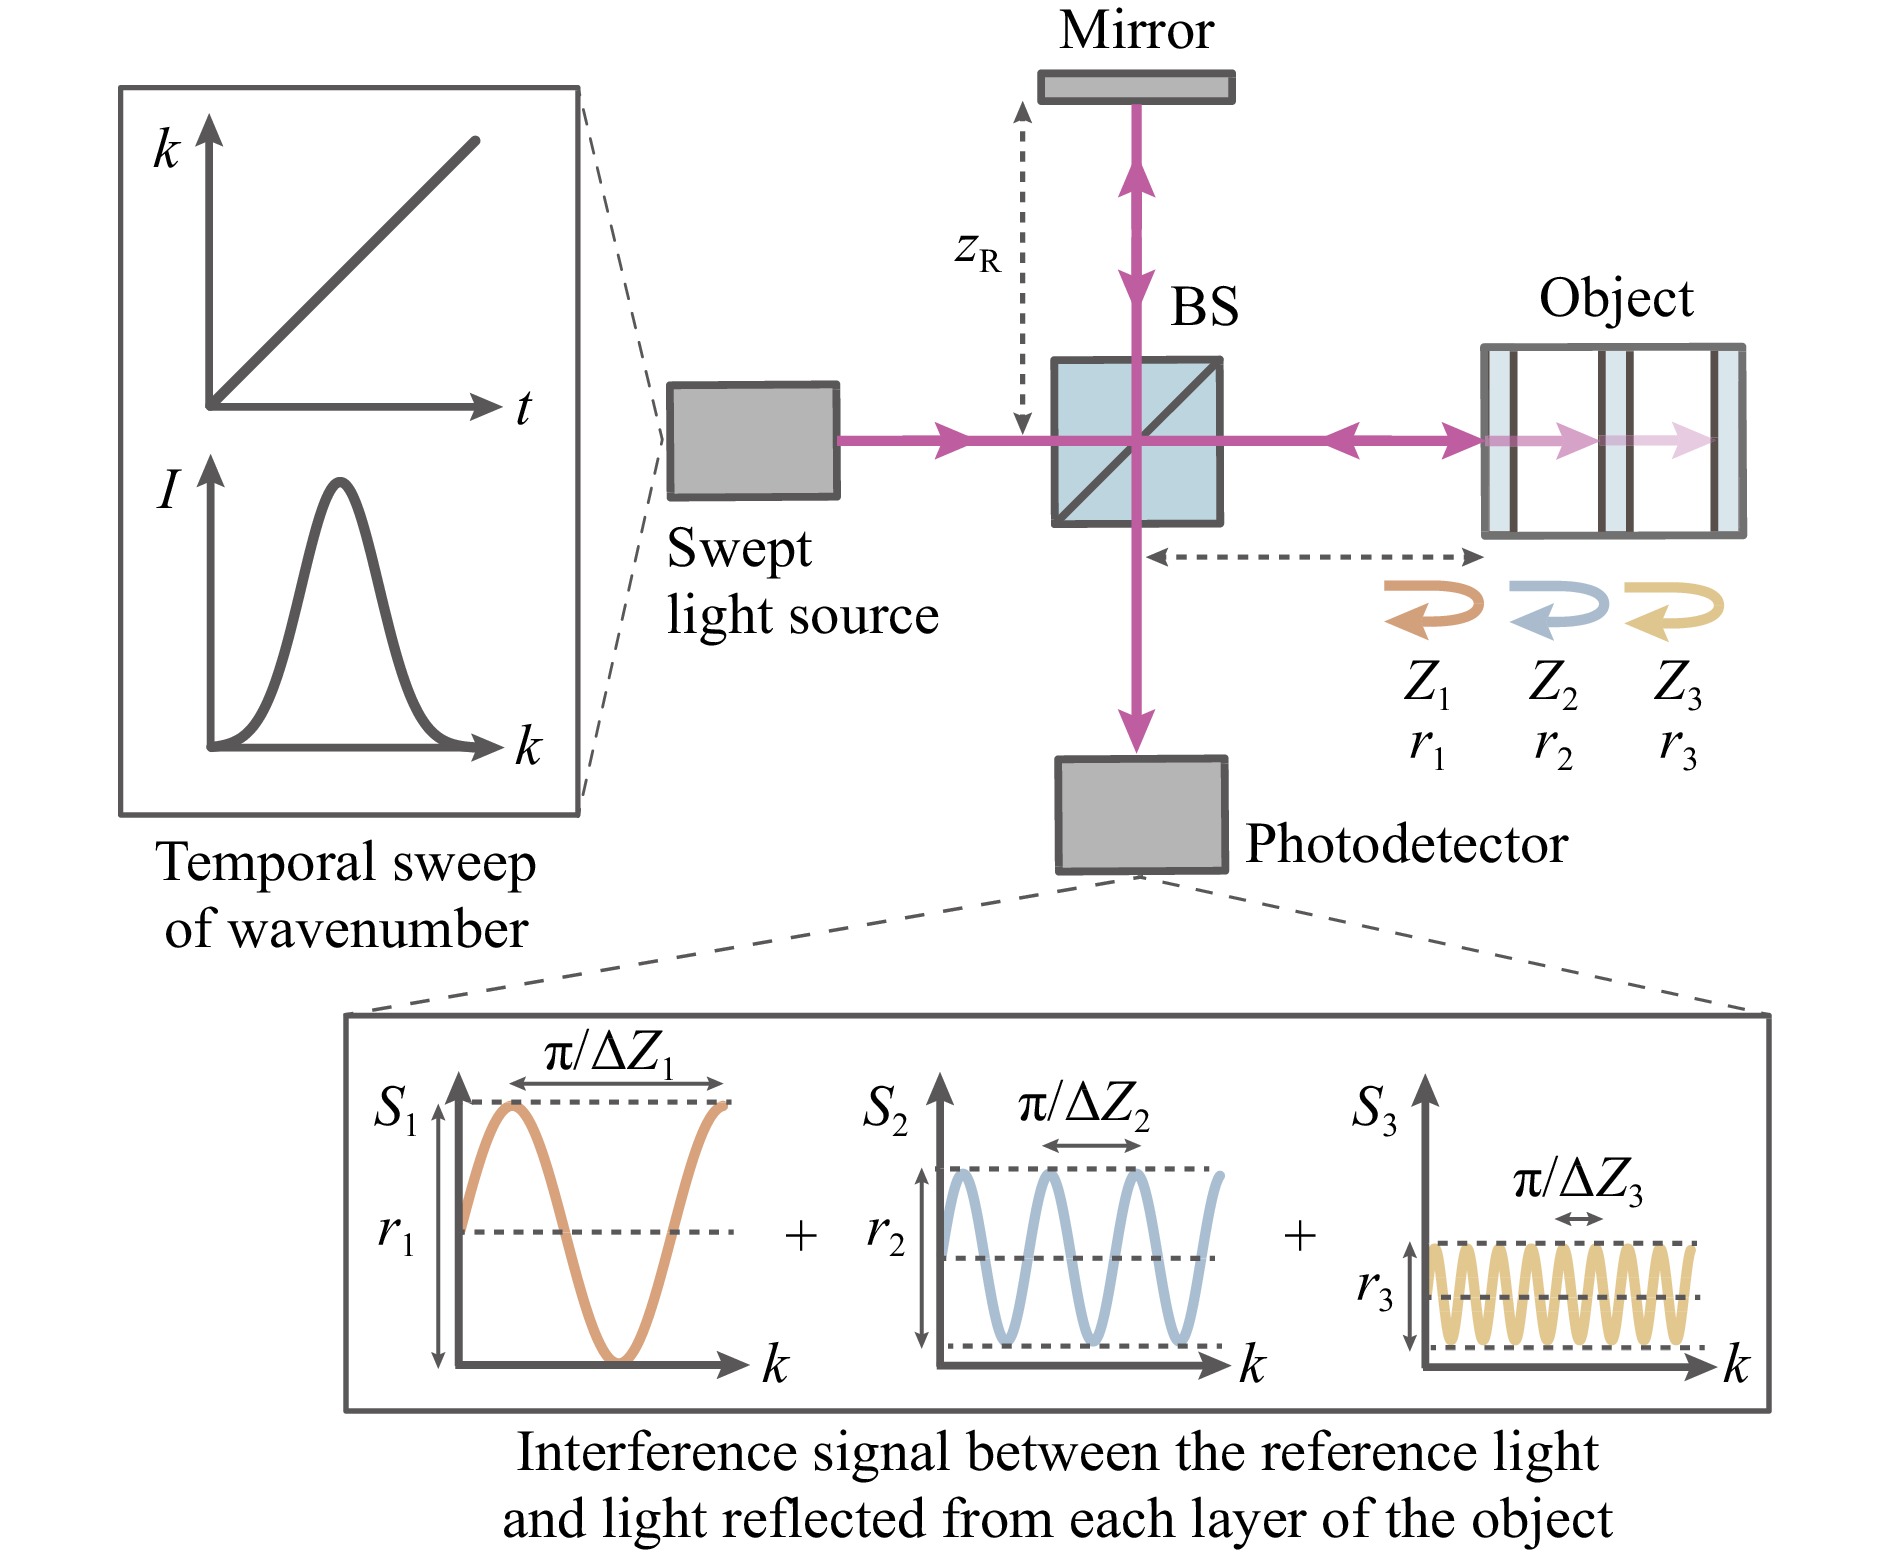
Fig. 1 Optical setup of SS-OCT.
$$ \begin{split} s(k) =& |r_{{\rm{R}}}a(k){{\rm{exp}}}(ik\cdot2Z_{{\rm{R}}})+\sum\limits_{{\rm{n}}=1}r_{{\rm{n}}}a(k){{\rm{exp}}}(ik\cdot2Z_{{\rm{n}}})|^{2}\\ =& |r_{{\rm{R}}}a(k)|^{2} + \left|\sum\limits_{{\rm{n}}=1}r_{{\rm{n}}}a(k)\right|^{2}\\ & + r_{{\rm{R}}}a^{2}(k)\sum\limits_{{\rm{n}}=1}r_{{\rm{n}}}{{\rm{exp}}}\{ik\cdot2(Z_{{\rm{R}}}-Z_{{\rm{n}}})\} + c.c.\\ =& (r_{{\rm{R}}}^{2}+\sum\limits_{{\rm{n}}=1}r_{{\rm{n}}}^{2})I(k)+2r_{{\rm{R}}}I(k)\sum\limits_{{\rm{n}}=1}r_{{\rm{n}}}{{\rm{cos}}}(k\cdot2{\Delta}Z_{{\rm{n}}}) \end{split} $$ (1) where the indexes R and n indicate light reflected from the reference mirror and each reflection layer into the object, respectively; k = 2
$\pi$ /$\lambda$ is the wavenumber;${a}$ is the amplitude; r is the amplitude reflectivity, which is assumed to be real for simplicity; Z is the optical path length from the beam splitter to the reference mirror and each reflection layer into the object;${c.c.}$ indicates complex conjugation; and I (k) =${a}^2({k})$ is the power spectrum. The contribution due to interference between object beams is ignored when${r}_{{\rm{n}}}$ is sufficiently small. In the second term of the equation, the frequency of the cosine wave is proportional to the optical path difference$\Delta{Z}_{\rm{n}} = {Z}_{\rm{R}}-{Z}_{\rm{n}}$ , which is related to the depth of the structure. To determine$\Delta{Z}_{\rm{n}}$ , the detected signal s(k) is analyzed by inverse Fourier transformation$\mathcal{F}^{-1}$ with the following equation$$ \begin{split} S(Z) =& \mathcal{F}^{-1}\{s(k)\} = (r_{{\rm{R}}}^{2}+\sum\limits_{{\rm{n}}=1}r_{{\rm{n}}}^{2})C(Z)\\ & + \sum\limits_{{\rm{n}}=1}r_{{\rm{R}}}r_{{\rm{n}}}\{C(Z)\circledast\delta(Z\pm2{\Delta}Z_{{\rm{n}}})\} \end{split} $$ (2) where C(Z) =
$ \mathcal{F}^{-1}\{{{I}}({{k}})\} $ is an autocorrelation function;$ \delta $ is the delta function; and$ \circledast $ indicates a convolution operation. In the equation, the first term means the DC component (0th order signal). The second term (n-th order signal) includes information regarding$ \Delta{Z}_{\rm{n}} $ . According to the equation, the width of the peak spectrum in the n-th order signal is a function of C(Z) appearing as a point spread function (PSF). Therefore, the measurement resolution of the depth of the structure is limited by the spectral width of the light source. -
The wavenumber
$ {k} $ should ideally be proportional to the sweep time$ {t} $ of the light source, as shown in Fig. 1. However, in an actual light source, the relationship between$ {k} $ and$ {t} $ is nonlinear. This nonlinearity causes a decrease in measurement resolution. Therefore, calibration of the relationship is essential to perform accurate measurement. Fig. 2 shows the calibration process based on the Fourier transform method24,25. In the process, a gold mirror was used as an object, and$ \Delta{Z}_{{\rm{1}}} = {Z}_{{\rm{R}}} - \it Z_{{\rm{1}}} $ was set to 481 μm. Fig. 2a, b show the optical interference signal$ {s} $ ($ {k} $ ) and its Fourier spectrum S(Z) before the calibration, respectively. In Fig. 2b, a blue line indicates the 1st-order spectrum of the interference signal, corresponding to the optical path difference between object and reference arms. The spectrum was broadband because$ {s}({k}) $ had distortion due to the nonlinear relationship between$ {k} $ and$ {t} $ . Fig. 2c, d indicate the intensity and phase of the interference signal obtained by Fourier transformation of the 1st-order spectrum, respectively. In Fig. 2d, the relationship between the phase, namely$ {k} $ , and time$ {t} $ is nonlinear. The sampling time interval for obtaining$ {s}({k}) $ is normally set to be constant for$ {t} $ . In the experiment, the time interval was calibrated to be an equal interval for the phase, as shown in the inset. Then,$ {s}({k}) $ for the calibrated time interval is newly obtained by linear interpolation. Fig. 2e, f show$ {s}({k}) $ and S(Z) after the calibration, respectively. With this calibration process, the peak of the Fourier spectrum was sharper than that before the calibration (Fig. 2b).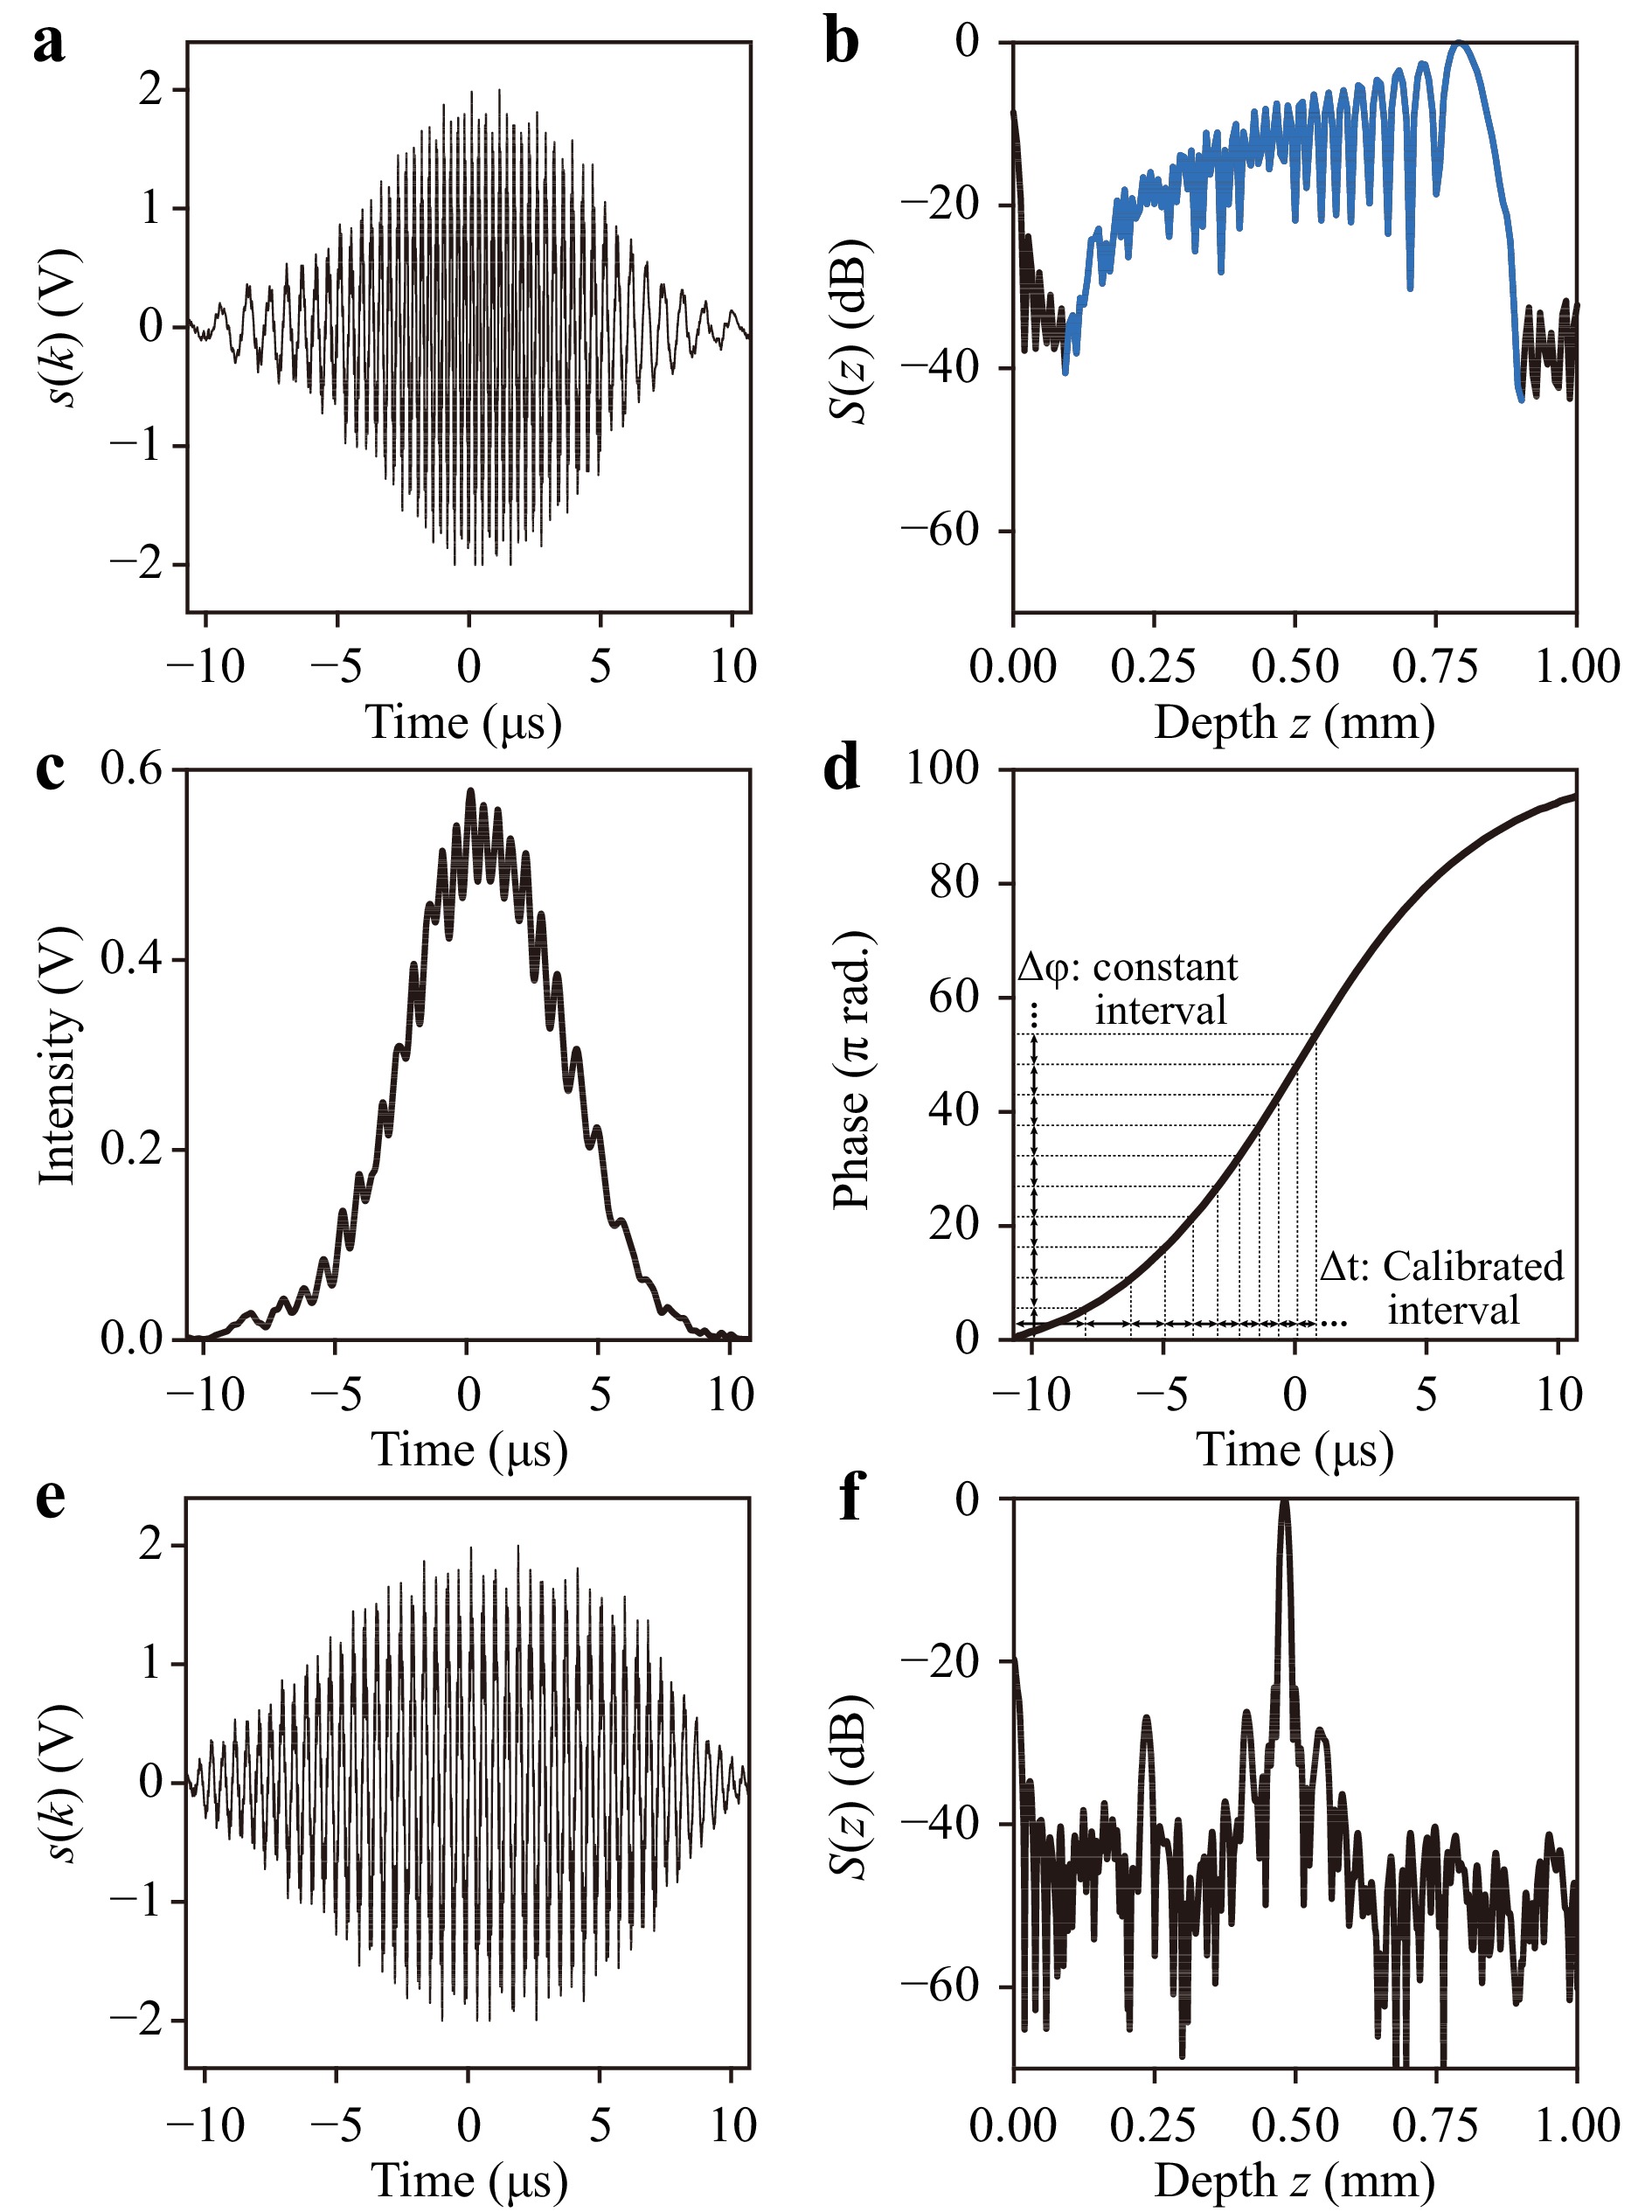
Fig. 2 a Optical interference signal
$ {s} $ ($ {k} $ ) and b its Fourier spectrum S(Z) before calibration. A blue line corresponds to the 1st-order spectrum of$ {s} $ ($ {k} $ ). c The intensity and d phase obtained by Fourier transformation of the 1st-order spectrum. e$ {s} $ ($ {k} $ ) and f S(Z) after calibration. -
Fig. 3 shows the experimental setup. The setup was mainly composed of a femtosecond (fs) laser processing system, an OCT system, and an optical microscope. Femtosecond pulses emitted from an amplified Ti:sapphire femtosecond laser system (COHERENT, Micra and Legend Elite) had a center wavelength of 800 nm, a spectral width of 30 nm (full width at half-maximum (FWHM)), a pulse duration of 50 fs, and a repetition frequency of 1 kHz, and were radiated onto the LCOS-SLM (Hamamatsu Photonics, X10468-02) through a pulse energy controller composed of a half-wave plate (HWP) and a polarizing beam splitter (PBS), and 2× beam expanding optics. The pulse was diffracted by a CGH displayed on the SLM and was transformed to a line-shaped beam which was introduced to laser processing optics. The plane of the SLM was imaged onto a galvanometer mirror (GM) (Thorlabs, GVS212) and the pupil plane of an objective lens (OL, ×5, NA = 0.13) (Sigma, EPL-5) using a 4f imaging system. A white-light-emitting diode (LED), an infrared (IR) cut filter, and a complementary metal-oxide-semiconductor (CMOS) image sensor (The Imaging Source, DMK33UP2000) were used to obtain the image of the processed structure. The OCT system, composed of fiber optics, was used to measure the depth of the processed structure in laser processing. The beam from a swept-light source (SLS)25 with a center wavelength of 1.3 μm, a spectral width of 80 nm, and a repetition frequency of 20 kHz in frequency scanning was split into the object and reference arms by a single-mode fiber (SMF) coupler (Thorlabs, TW1300R2A1) with a coupling ratio of 9:1. Since the light source employs an electro-optic crystal of potassium tantalate niobate (KTa
$ _{1-x} $ Nb$ _{x} $ O$ _{3} $ , KTN) as a driver for sweeping the output wavelength, it has no mechanically moving components and can stably be used in industrial applications that require quantitative analyses. The object beam was radiated onto the sample coaxially with the fs laser beam through a dichroic mirror (DM) via an SMF circulator (Thorlabs, CIR1310-APC) with a core diameter of 8.2 μm. The reference beam also illuminated the reference mirror. A polarization converter (PC) (Thorlabs, CPC900) was used to regulate the polarization of the beam. An optical interference signal between the reflected object and reference beams was detected by a balanced detector (BD) (Hamamatsu, C12668-02) with an SMF coupler (Thorlabs, TW1300R5A1) with a coupling ratio of 5:5. The interference signal was transferred to a computer (Intel Core i7-10700, 2.9 GHz, 8 core, Main memory: 32 GB, GPU: GeForce GTX1660Ti 6 GB) via a data acquisition device (DAQ) (Pico Technology, picoscope3205A) with an electric high-pass filter (Thorlabs, EF517) synchronized by a trigger signal from the SLS. The depth of the processed structure was quantitatively evaluated by performing an inverse Fourier transform of the interference signal. The times required to capture the optical interference signal and to calculate the Fourier spectrum (A-scan profile) were 3 and 10 ms, respectively. A fused silica substrate (thickness of 2 mm) was mounted on a three-axis translation motor stage (Thorlabs, ZFS13B) as a sample. A laser confocal microscope (Olympus, OLS4000) was used to observe the processed structure in detail.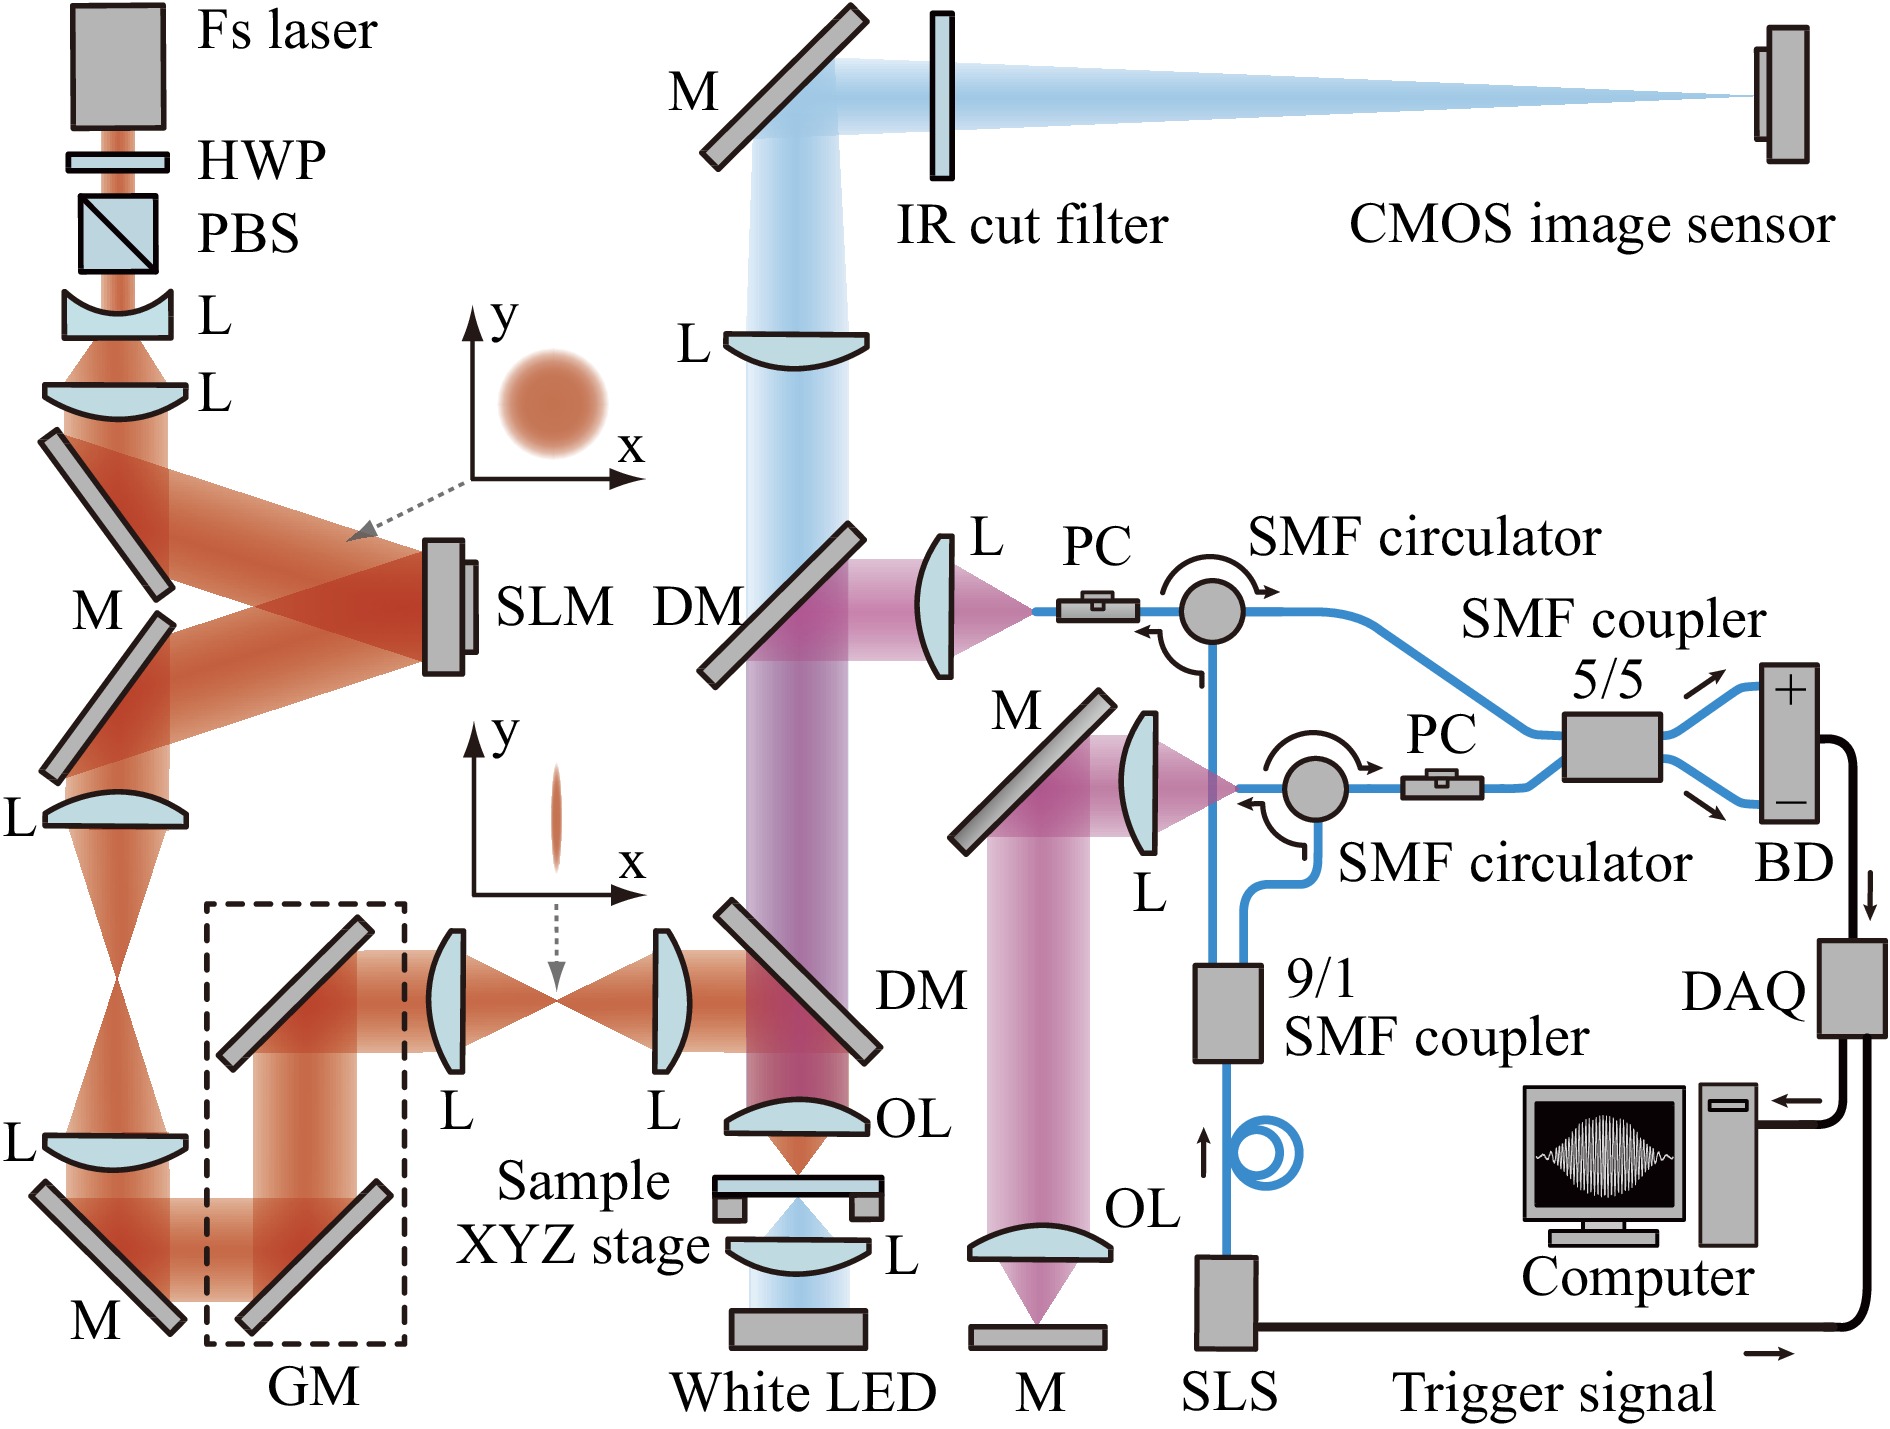
Fig. 3 Experimental setup: L, lens; M, mirror; HWP, half-wave plate; PBS, polarizing beam splitter; GM, galvanometer mirror; DM, dichroic mirror; OL, objective lens; SLS, swept-light source; SMF, single-mode fiber; PC, polarization converter; BD, balanced detector; DAQ, data acquisition device.
-
The depth resolution, measurement accuracy, and measurable range in the OCT system were evaluated. Unprocessed glass was used as the sample. Fig. 4a, b show a typical
$ {s} $ ($ {k} $ ) with a Hanning window and S(Z), respectively. The window function was used to remove unnecessary high-frequency components generated by the Fourier transform. In Fig. 4b, the peak spectrum corresponded to the light reflected from the glass surface. The depth Z of the peak spectrum was defined as position zero. The full width at half maximum (FWHM) of the peak spectrum, namely, the depth resolution$ {Z}_{{\rm{r}}} $ , was estimated to be 15.8 μm. If the spectrum of the light source is an ideal Gaussian distribution, a theoretical$ {Z}_{{\rm{r}}} $ is defined with the following equation: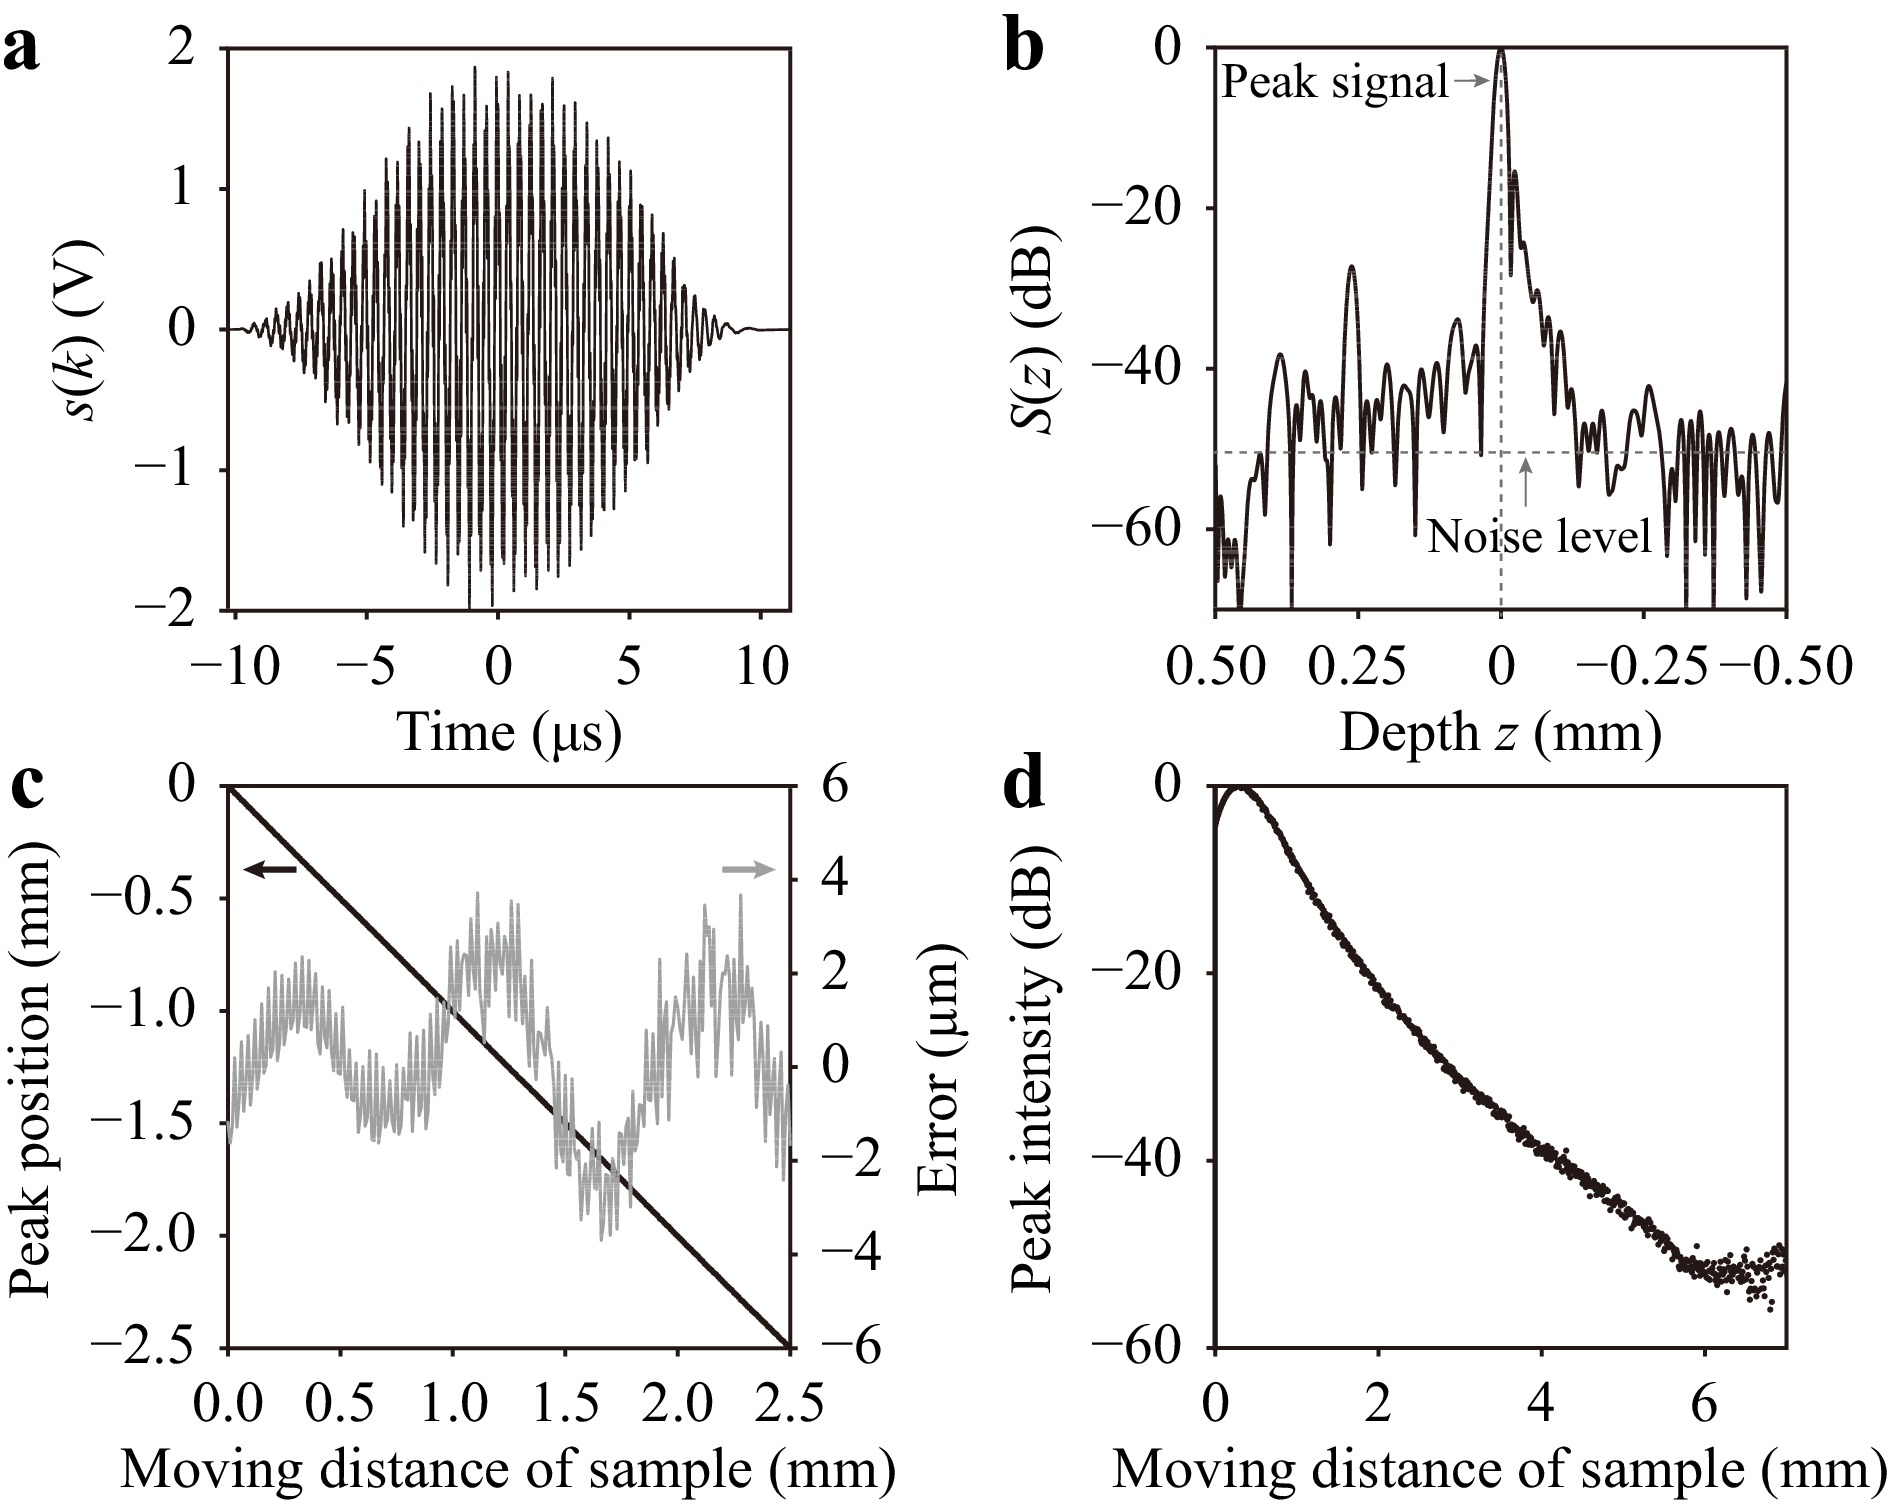
Fig. 4 a
$ {s} $ ($ {k} $ ) with Hanning window and b S(Z). c Change in peak position of the Fourier spectrum and measurement error versus moving distance of the sample in the axial direction. d Change in peak intensity of the Fourier spectrum versus moving distance of the sample.$${Z}_{{\rm{r}}} = \frac{2\ln{2}}{\pi}\frac{\lambda_{{\rm{c}}}^2}{n\Delta\lambda} $$ (3) where
$ \lambda_{{\rm{c}}} $ and$ \Delta\lambda $ are the center wavelength and the spectral width of the light at FWHM, respectively; and$ {n} $ is the refractive index of the sample. By using Eq.3, the theoretical$ {Z}_{{\rm{r}}} $ was calculated to be 10 μm. The lower actual depth resolution compared with the theoretical one is mainly due to applying the window function to$ {s} $ ($ {k} $ ). The SNR of the peak spectrum was 50 dB. In Fig. 4c, the black line indicates the change of the peak position of the spectrum versus the moving distance of the glass sample. The sample was moved along the optical axial direction with a velocity of 1 mm/s and a step interval of 10 μm while measuring the peak position of the spectrum. The gray line indicates the difference between the moving distance and the measured peak position, that is, the measurement error. Two types of frequency components were observed. One was a high-frequency component, which might be derived from the positioning accuracy of the motor stage. The other was a low-frequency component, which might be derived from the vibration of the interference optical setup. The peak-to-valley (PV) heights in the high- and low-frequency components were about ±1 μm and ±2.5 μm, respectively. These values were relatively smaller compared with the depth resolution$ {Z}_{{\rm{r}}} $ of 15.8 μm. Fig. 4d shows the change of the peak intensity of the spectrum versus the moving distance. The distance from the peak to the intensity of −50 dB was 5.3 mm. From the result, the axial measurable range was estimated to be 5.3 mm. The measurable range is related to the coherence length of the light source and a confocal effect depending on the relationship between the NA of the objective lens and the core diameter of the circulator. The coherence length was 3 mm at FWHM, corresponding to −6 dB in the specifications of the light source. Therefore, the measurable range was mainly limited to the confocal effect. -
At first, to verify the feasibility of the proposed method, in-process monitoring of the depth of the processed structure in multi-ring drilling was performed using a Gaussian beam. Figs. 5a−c show the depth of the structure in multi-ring drilling when the pulse energy E was set to 4.3, 10 and 43 μJ, respectively. The focused fs beam was circularly scanned by the galvanometer mirror, as shown in the inset. In the beam scanning, eight rings with a radius interval of 6.25 μm were sequentially drawn from the inside to the outside. One beam scan was defined as drawing eight rings. The time required for each beam scan
$ {S}_{{\rm{n}}} $ was 900 ms. The measurement position for OCT was set to the center of the processed structure (single-point measurement). The graphs corresponding to each optical microscope image indicate S(Z) (A-scan profile) obtained by OCT. The dashed line indicates the depth position of the glass surface. The arrow indicates the depth position of the peak spectrum. The depth position of the peak spectrum was defined as the maximum value of S(Z) in the depth range from the glass surface (Z = 0 mm) to Z = −0.5 mm. From the results, the depth position of the peak spectrum was shifted to the deeper side with increasing$ {S}_{{\rm{n}}} $ . In Fig. 5a with near threshold pulse energy, the shift of the peak spectrum was small. In a comparison between Fig. 5b, c, a difference in the intensity of the peak spectrum was observed. The difference originated from the decrease of the backscattering light due to debris deposited on the bottom of the structure in multi-ring drilling. In Fig. 5c with larger pulse energy, the intensity of the peak spectrum was one order of magnitude larger than that in Fig. 5b because the deposited debris was blown away by the shockwave generated by the fs laser irradiation26,27.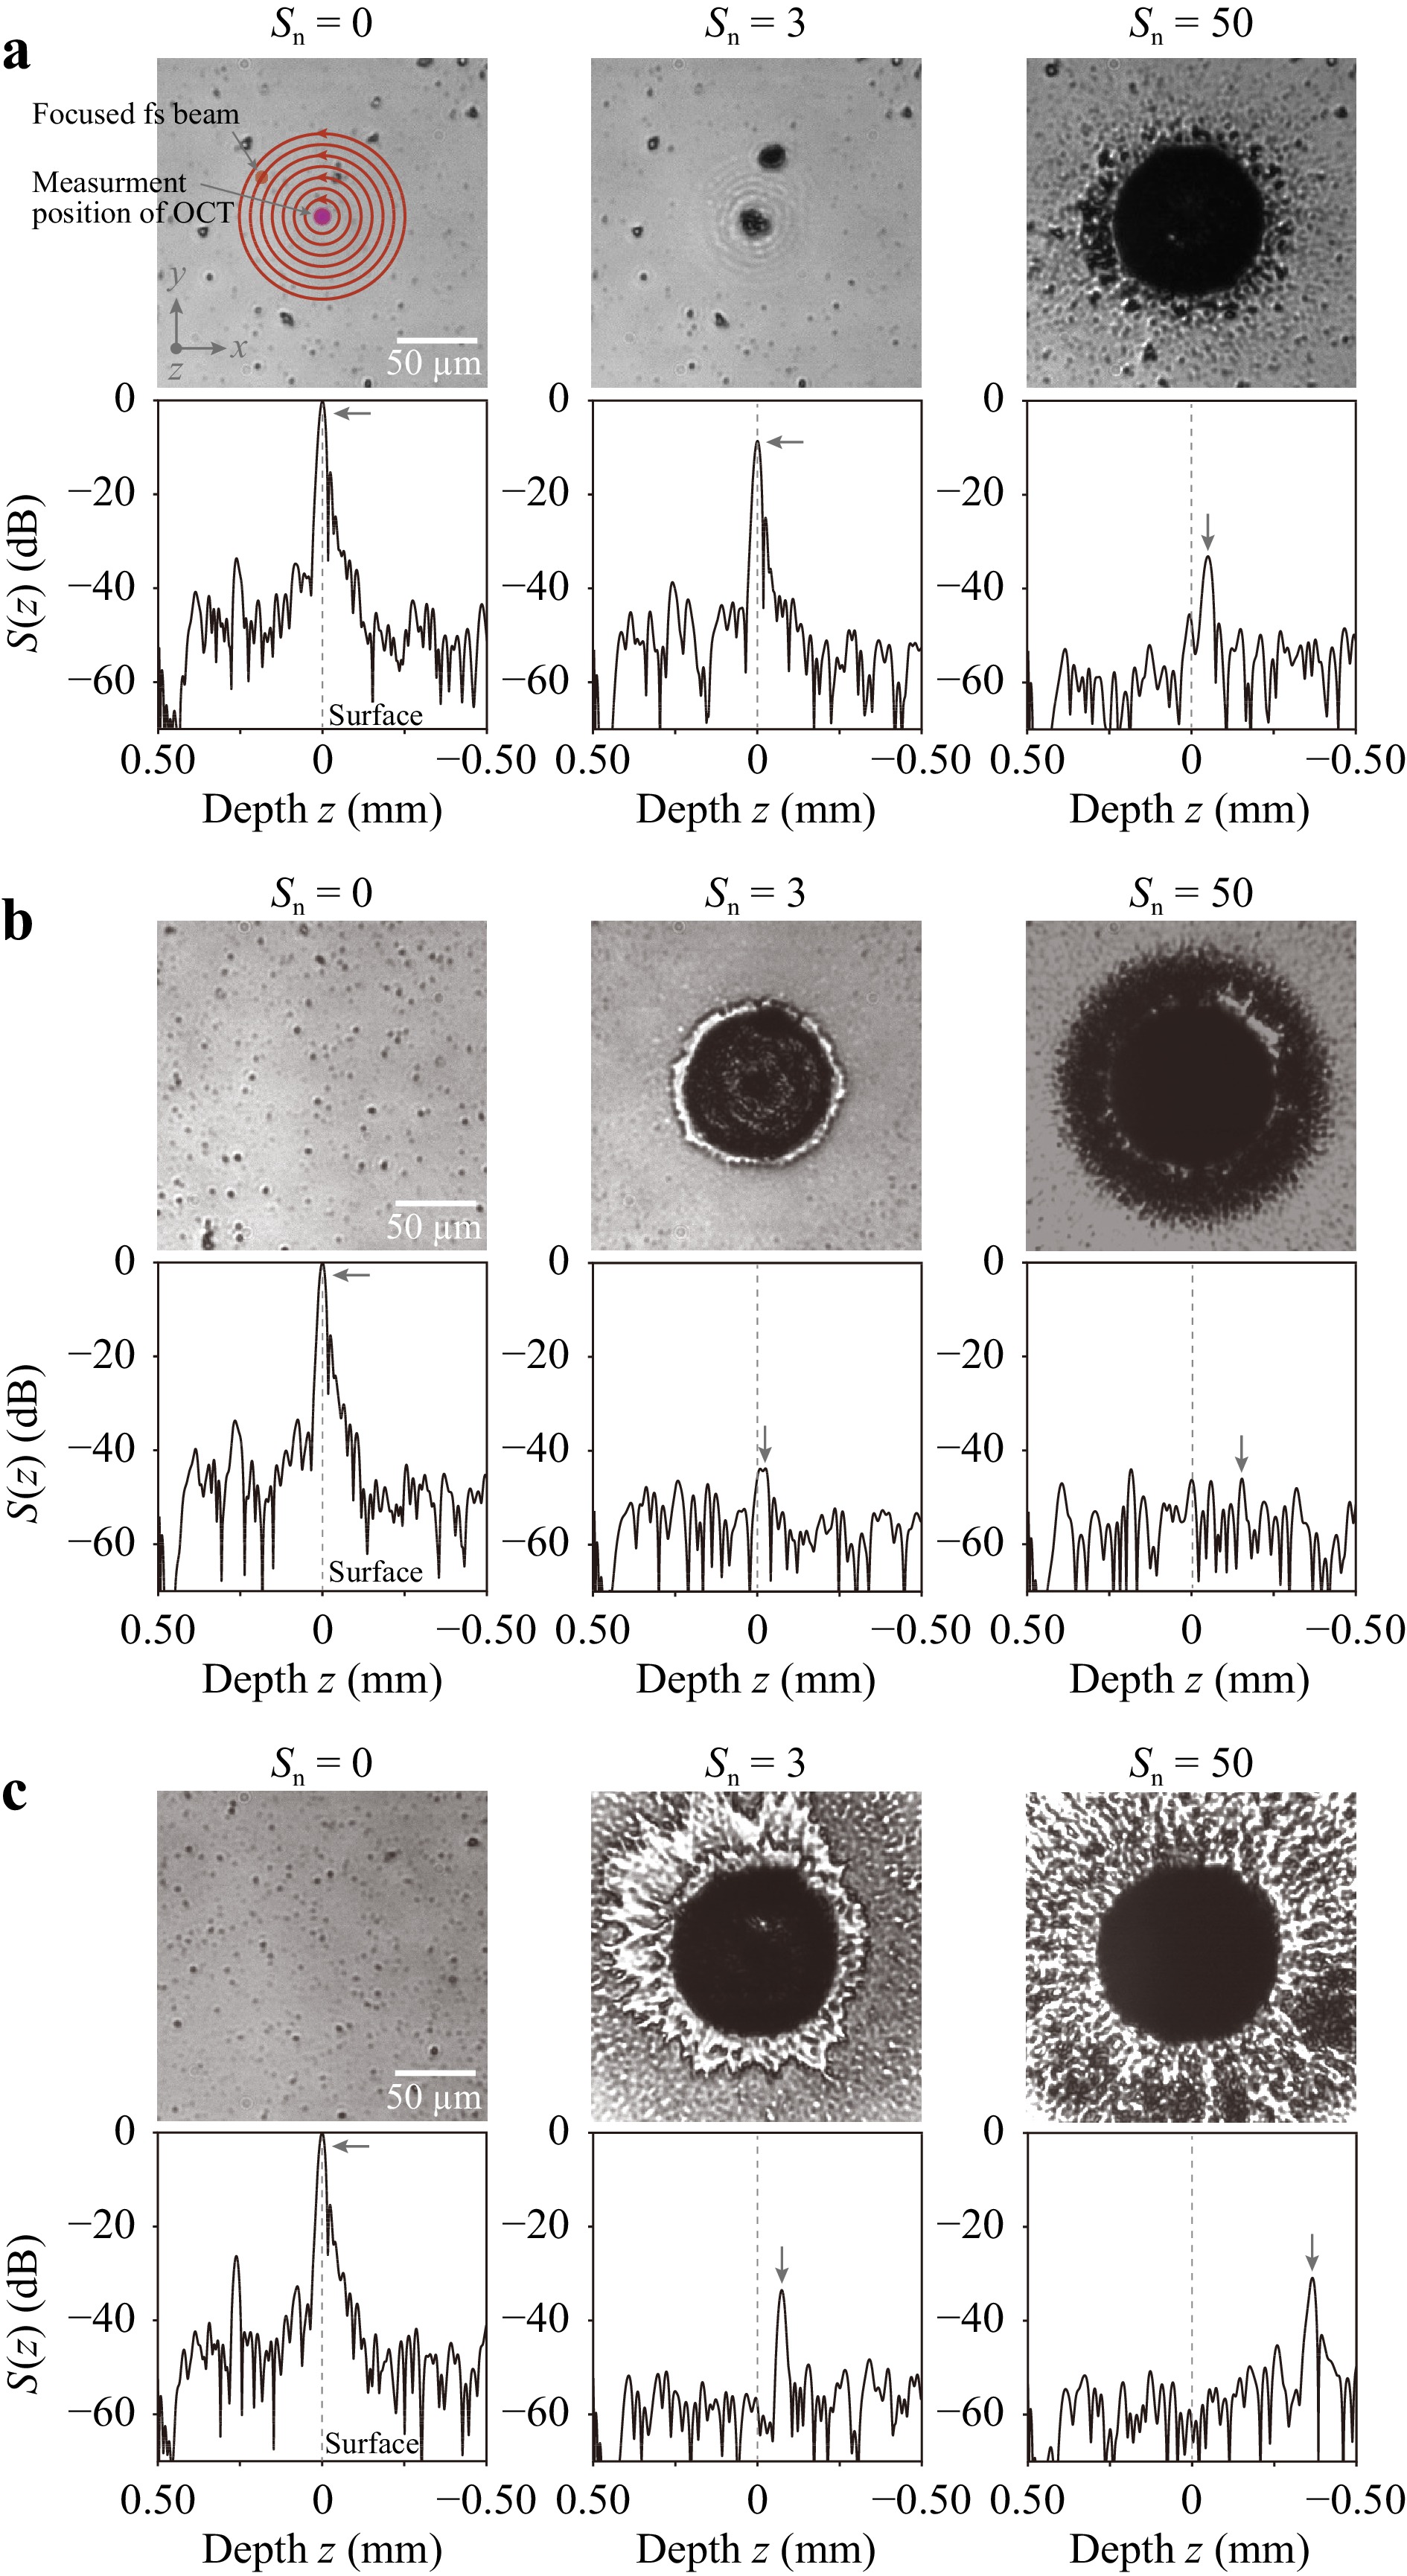
Fig. 5 In-process monitoring of depth of processed structure in multi-ring drilling. Optical microscope image of the processed structure and S(Z) obtained by OCT versus number of scans
$ {S}_{{\rm{n}}} $ when E was set to a 4.3, b 10, and c 43 μJ, respectively. Arrows indicate the peak spectrum.Figs. 6a−c show the change of the A-scan profile of the processed structure in multi-ring drilling versus
$ {S}_{{\rm{n}}} $ and the cross-sectional depth profile of the final structure when E was set to 4.3, 10, and 43 μJ, respectively. In the change of the A-scan profile, the white dashed line indicates the surface position of the glass sample. In the cross-sectional profile, the black dot and the gray dashed line indicate the depth measured by LCM and OCT, respectively. From the result, the depth obtained by OCT agreed well with the maximum depth obtained by LCM. In Fig. 6b, the intensity of the peak spectrum was gradually decreased with the increase of$ {S}_{{\rm{n}}} $ because accumulated debris continuously pooled at the bottom of the structure. Therefore, the SNR was decreased due to the decrease of the backscattering light; however, in-process monitoring of the depth of the processed structure was successfully performed. On the other hand, in Fig. 6c, the intensity of the peak spectrum rapidly increased when$ {S}_{{\rm{n}}} $ was larger than 10. The increase in SNR was related to the effect of the debris removal by the shockwave.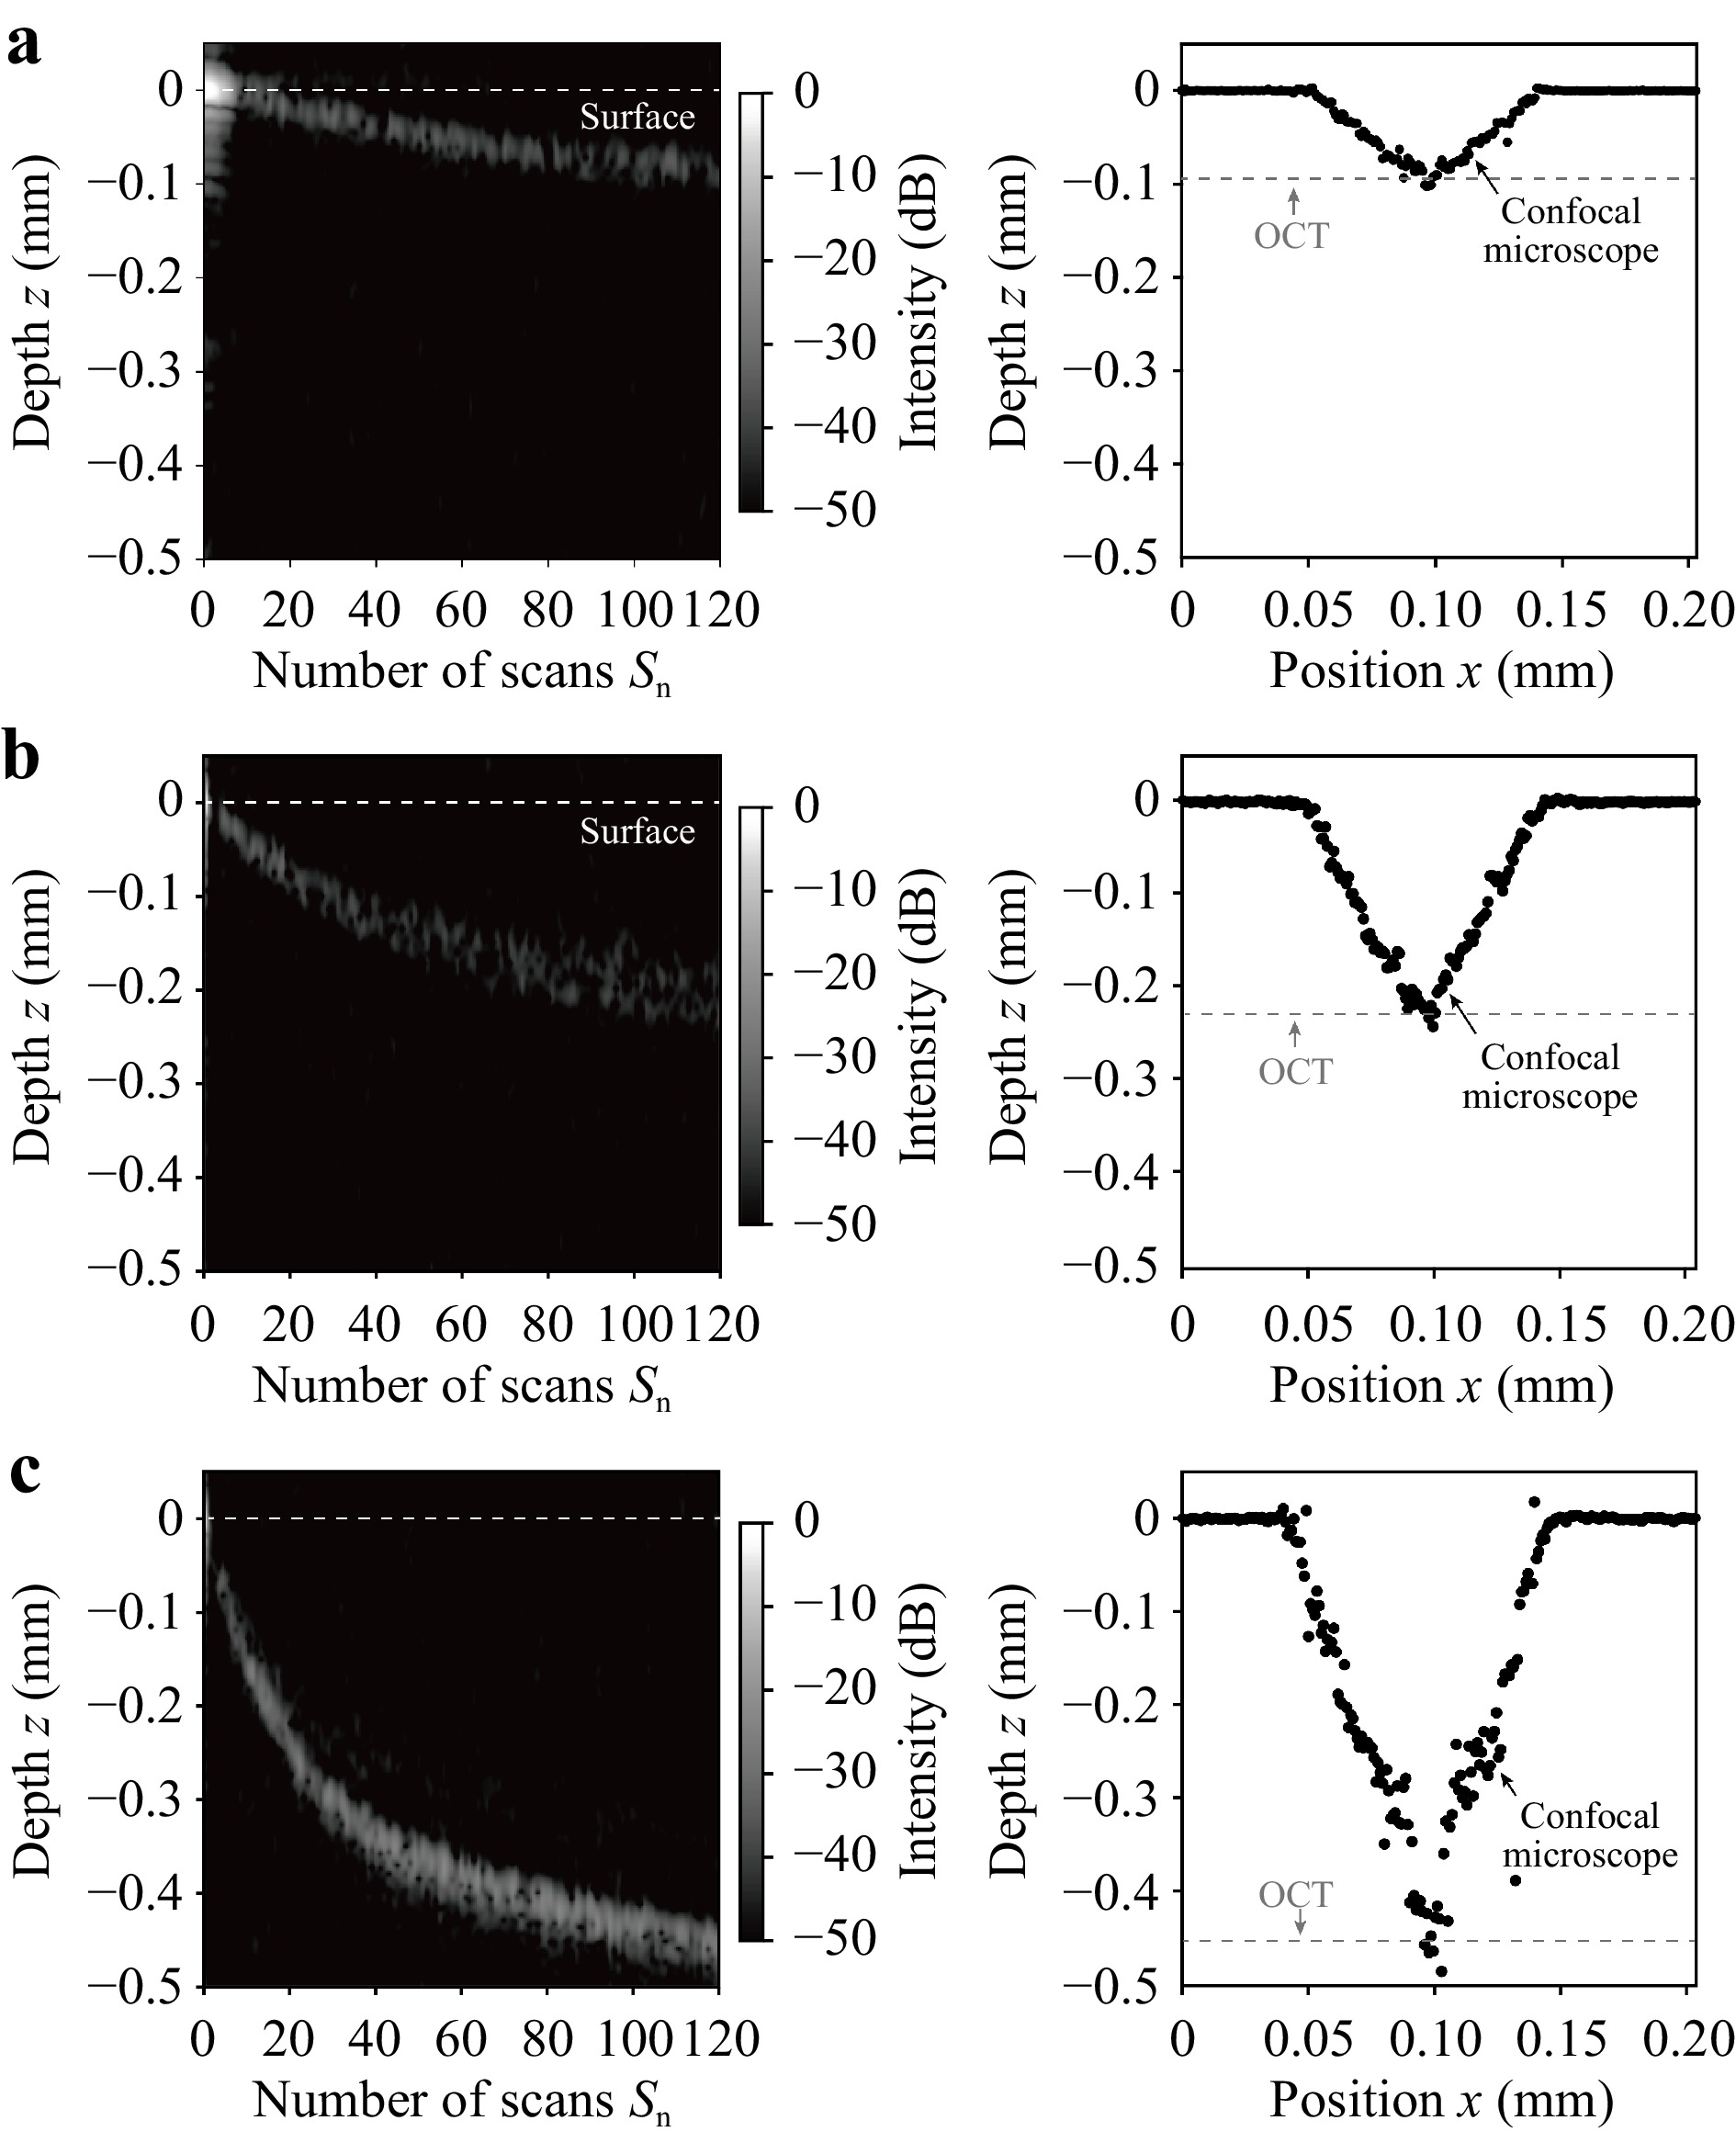
Fig. 6 Change of A-scan profile of the processed structure in multi-ring drilling versus
$ {S}_{{\rm{n}}} $ and cross-sectional depth profile of the final structure when E was set to a 4.3, b 10 and c 43 μJ. White dashed lines indicate the surface position of the sample. Black dots indicate the depth profiles measured by LCM. Gray dashed lines indicate the depth measured by OCT.Fig. 7 shows the change of the depth of the structure processed by multi-ring drilling versus E as
$ {S}_{{\rm{n}}} $ was changed. The dashed line indicates the depth of focus of the fs laser beam, which is determined by the NA of the objective lens. When E was less than 8 μJ, there was no significant change in the difference between the depths of the structures as a function of$ {S}_{{\rm{n}}} $ because E was near the threshold. When E was around 10 μJ, the depth of the structure approximately linearly increased with the increase of$ {S}_{{\rm{n}}} $ . On the other hand, when E was larger than 30 μJ, the increase in the depth of the structure showed nonlinearity as$ {S}_{{\rm{n}}} $ was increased. In particular, in the early stages of multi-ring drilling ($ {S}_{{\rm{n}}} $ < 10), the depth of the structure rapidly increased because the depth of focus of the beam was close to the depth of the structure. However, after the intermediate stage of multi-ring drilling (50$ \leqslant {S}_{{\rm{n}}} $ ), the depth of the structure approximately saturated. Therefore, a focus shift of the fs laser beam according to the depth of the structure will be necessary from the viewpoint of improving the efficiency of multi-ring drilling.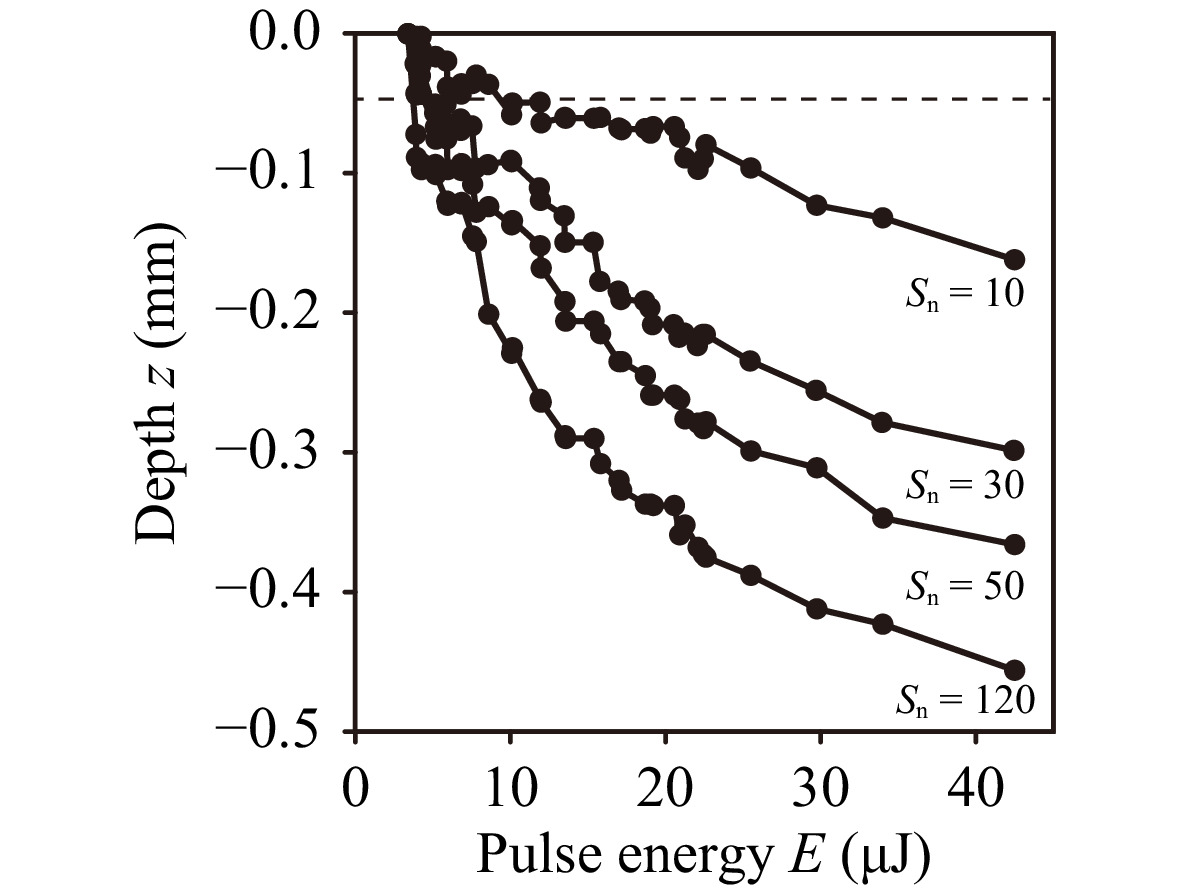
Fig. 7 Change of the depth of processed structure in multi-ring drilling versus E as a function of
$ {S}_{{\rm{n}}} $ . Dashed line indicates the depth of focus of the fs laser beam. -
In-process monitoring of the depth of the processed structure in laser grooving with a line-shaped beam was demonstrated. Fig. 8a shows the CGH used to generate the line-shaped beam and its computer reconstruction. Fig. 8b shows an optical microscope image of the structure processed by the line-shaped beam with E = 206 μJ. The glass sample was repeatedly scanned along the positive and negative directions on the x-axis with a constant velocity of 50 μm/s while being irradiated with the line-shaped beam. The number of scans
$ {S}_{{\rm{n}}} $ was set to 10. Fig. 8b corresponds to the optical microscope image of the structure when$ {S}_{{\rm{n}}} $ = 2. When each scan$ {S}_{{\rm{n}}} $ was finished, the glass sample was scanned again along the x-direction with a velocity of 1 mm/s without irradiation with the line-shaped beam to measure the depth of the structure by OCT. The measurement position for OCT was set to the center of the structure shown as a dashed line in the figure. The measurement interval of the x-axis in the OCT was 5 μm.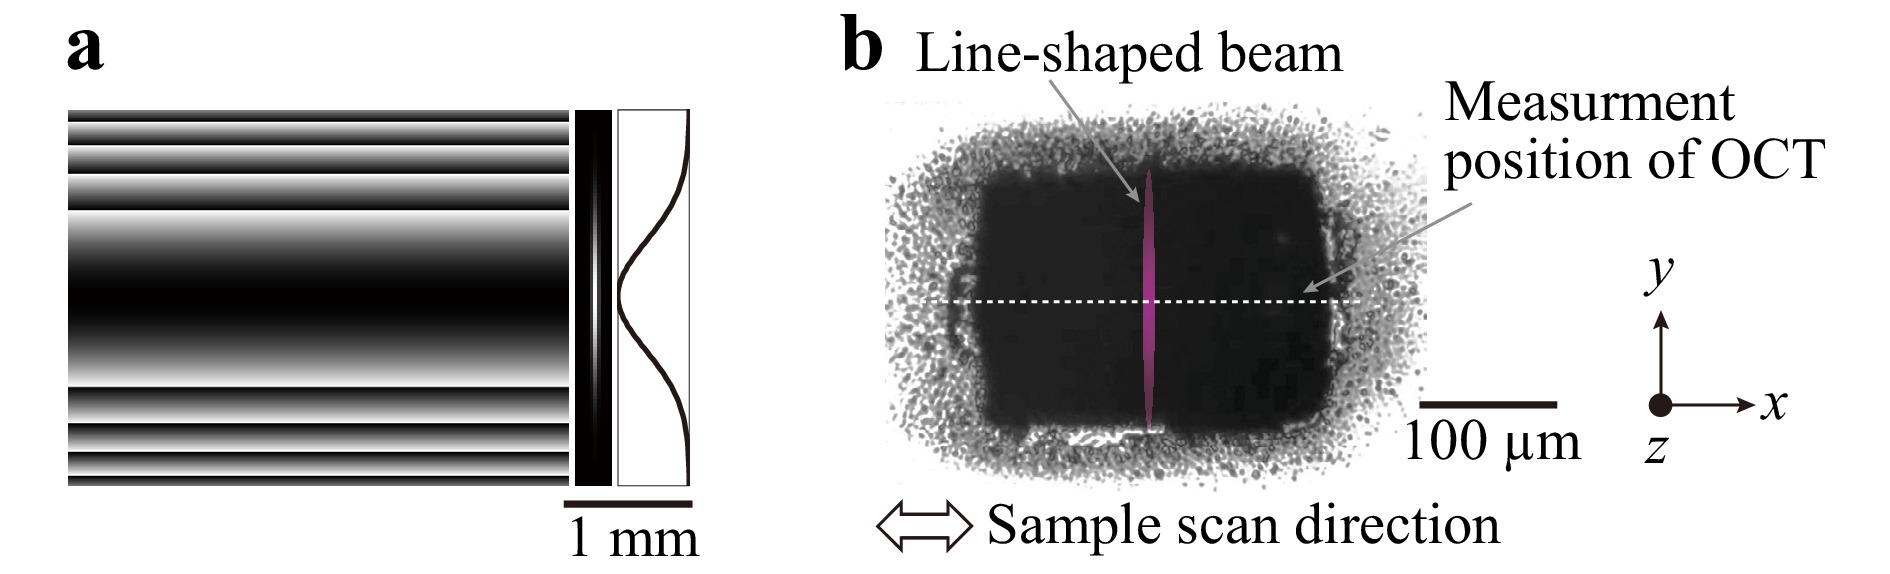
Fig. 8 a CGH used to generate the line-shaped beam and its computer reconstruction. b Optical microscope image of the structure processed by the line-shaped beam.
Figs. 9a−c show the cross-sectional depth profile (B-scan image) of the structure processed by the line-shaped beam versus
$ {S}_{{\rm{n}}} $ when E was set to 32, 74 and 206 μJ, respectively. The B-scan image was generated from a series of the A-scan profiles measured at different x positions. Arrows indicate the scanning direction of the sample. Red points indicate the position of the fs laser beam at the end of the scanning. In the case of low E (Fig. 9a), debris was deposited at both ends of the structure (the area shown in the dashed circle) as$ {S}_{{\rm{n}}} $ was increased. After$ {S}_{{\rm{n}}} $ = 8, deposited debris was not observed. The absence of debris is expected to be related to the shockwave caused by the laser irradiation and the decrease in debris production by the saturation of the depth of the processed structure. In the case of middle E (Fig. 9b), the depth became deeper with increasing$ {S}_{{\rm{n}}} $ . In the case of high E (Fig. 9c), debris deposited in the processed structure was obviously moved according to the scanning direction due to the shockwave caused by the laser irradiation. In particular, the processed structure was deeper at the end position of the scanning because the debris was blown away by the shockwave. On the inside of the processed structure, the A-scan profile was observed to become elongated along the axial direction. The elongation is due to the multiple reflections of backscattered light by the debris because the multiple reflections resulted in the optical path difference longer compared with the reflection from the surface structure. In comparison to the elongation in Fig. 9a, the elongation in Fig. 9c was clearly observed. From the results, in-process monitoring of the depth and shape of the processed structure and the distribution of deposited debris was successfully performed.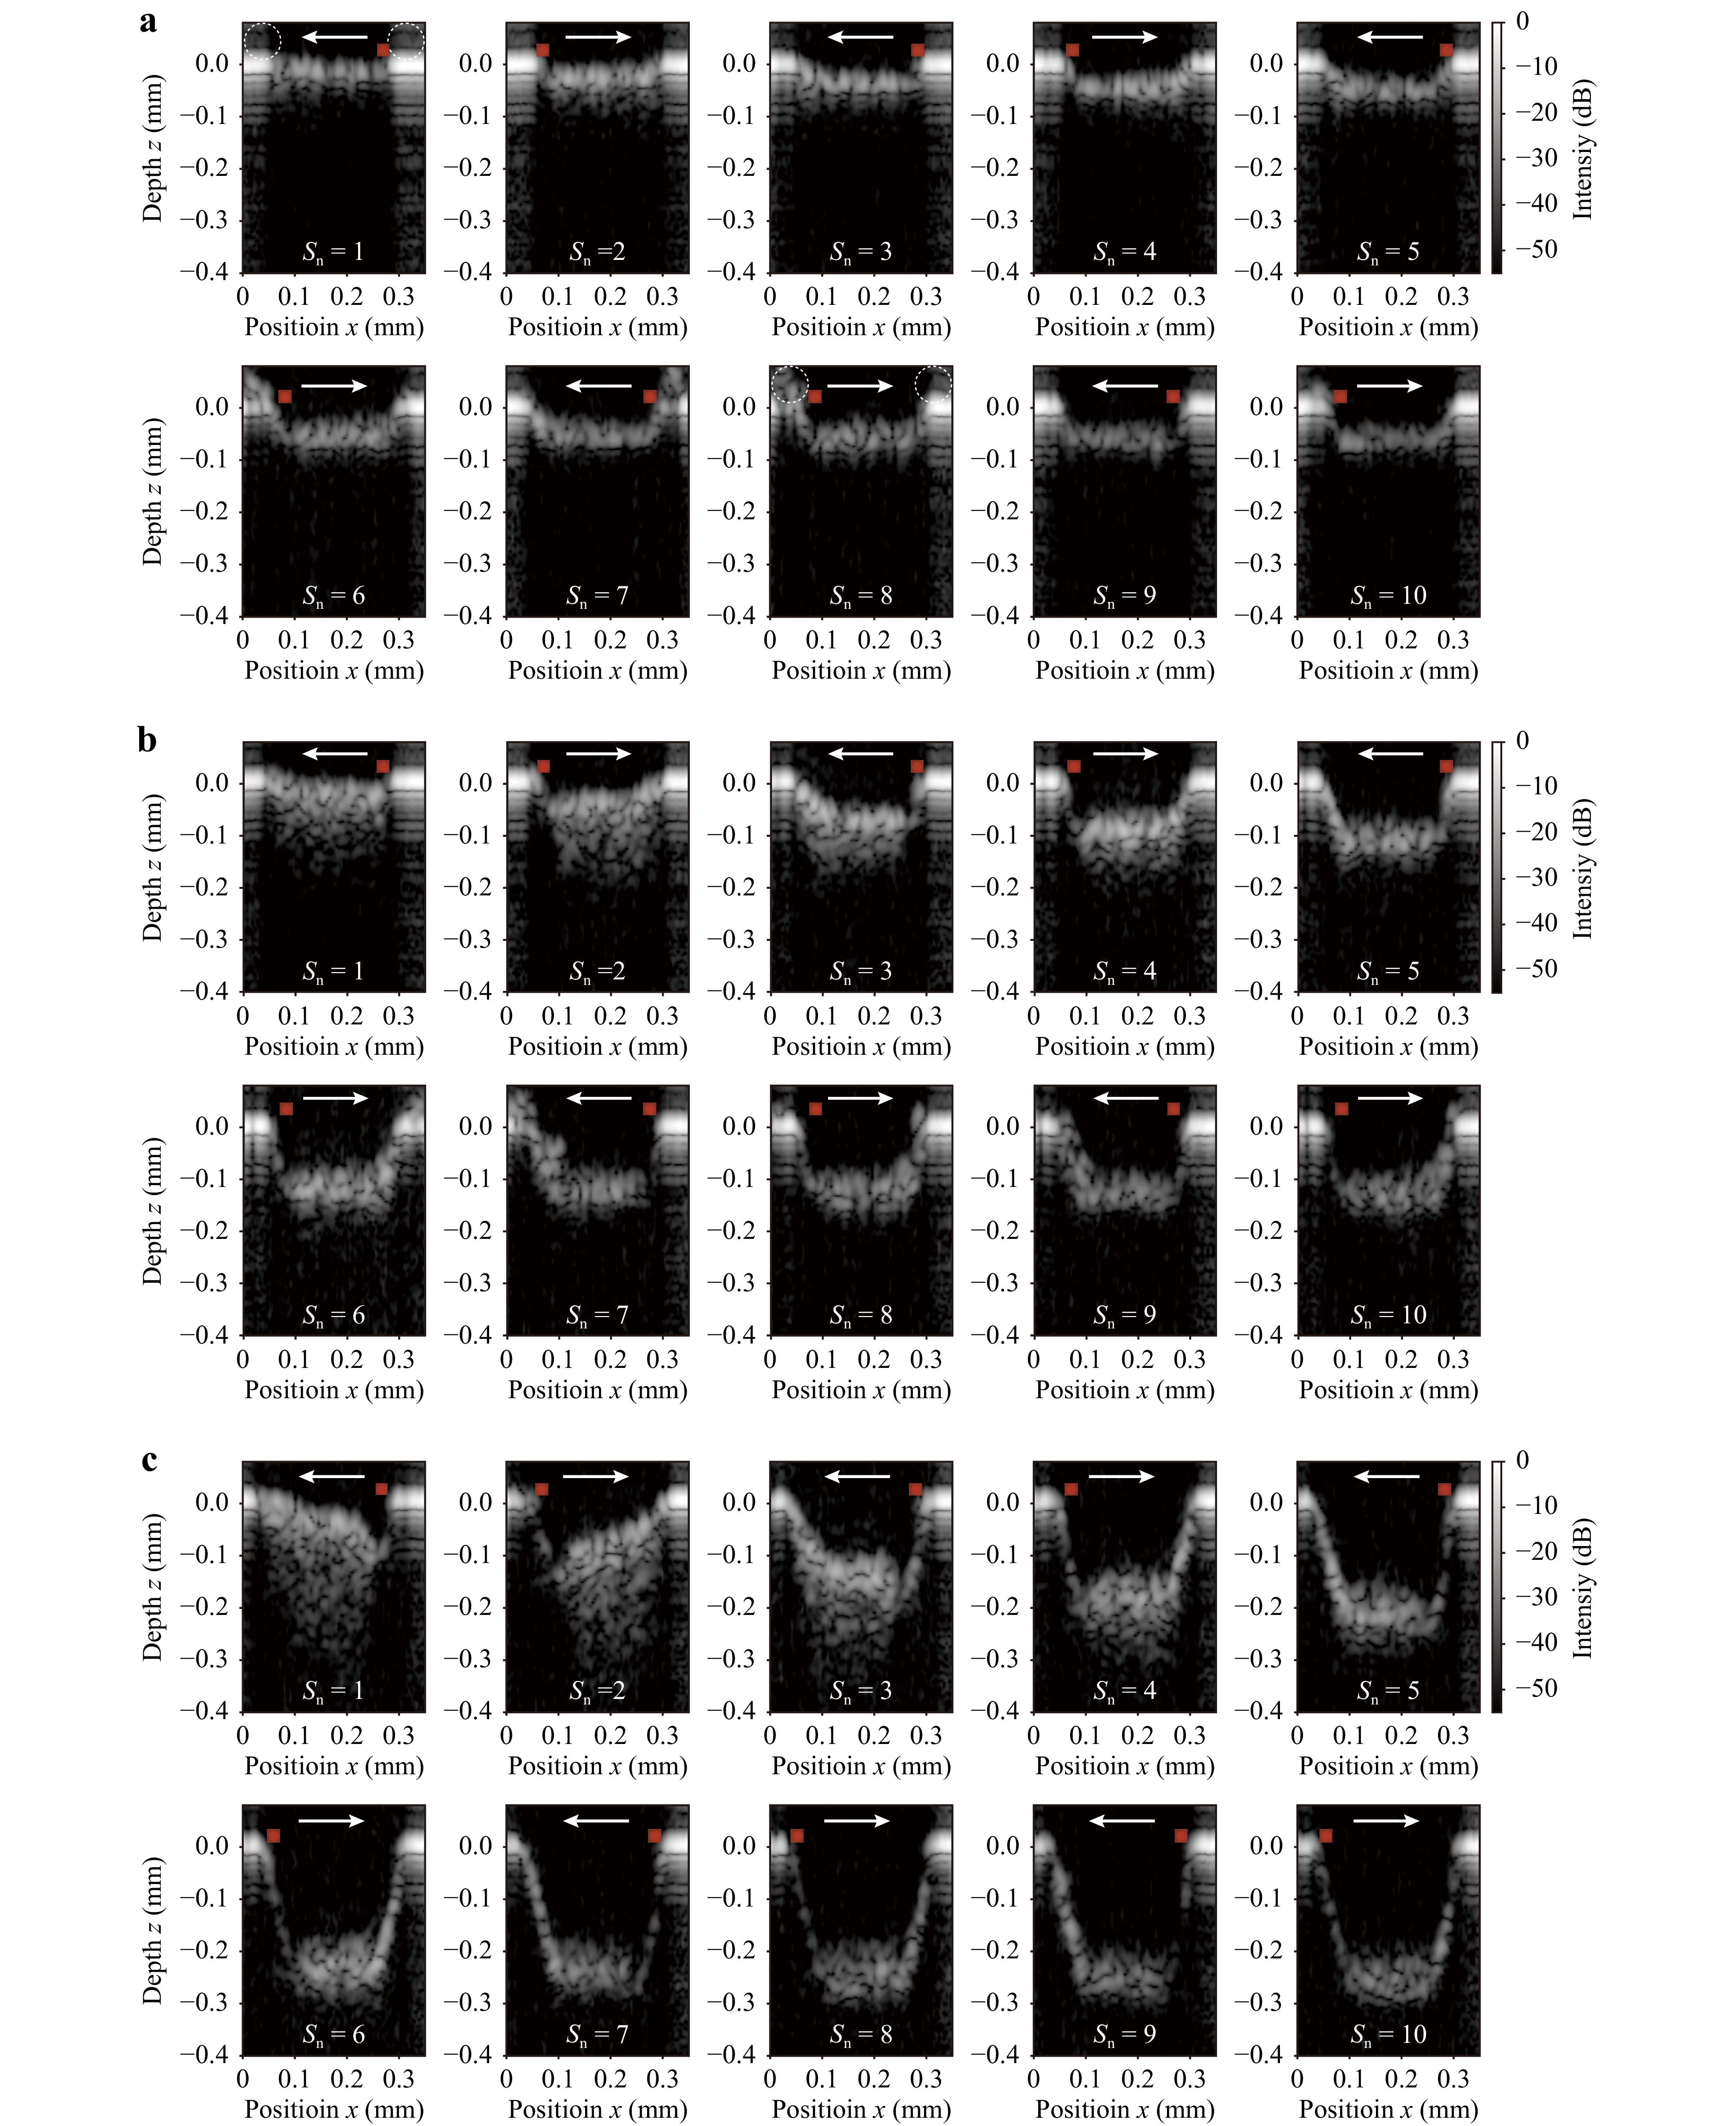
Fig. 9 Crossectional depth profile (B-scan image) of the structure processed by the line-shaped beam versus
$ {S}_{{\rm{n}}} $ when E was set to a 32, b 74 and c 206 μJ. Arrows indicate the scanning direction of the glass sample. Red points indicate the position of the fs laser beam at the end of the scanning.Fig. 10a shows the change in the depth of the groove processed by the line-shaped beam versus
$ {S}_{{\rm{n}}} $ when E was set to 32, 74, and 206 μJ. The depth was defined as the deepest position of the peak spectrum in the B-scan image. The dashed line indicates the depth of focus of the fs laser beam. When 4$ \leqslant {S}_{{\rm{n}}} $ , the structural depth was almost saturated with the increase of$ {S}_{{\rm{n}}} $ . Fig. 10b shows the cross-sectional depth profile of the processed structure in$ {S}_{{\rm{n}}} $ = 10 when E was set to 32, 74 and 206 μJ. Black dots and gray lines indicate the depth profiles measured by OCT and LCM, respectively. In OCT, the position of the peak spectrum of each A-scan profile was plotted. From the result, both profiles agreed well. On the bottom of the structure, a relatively flat surface was successfully obtained.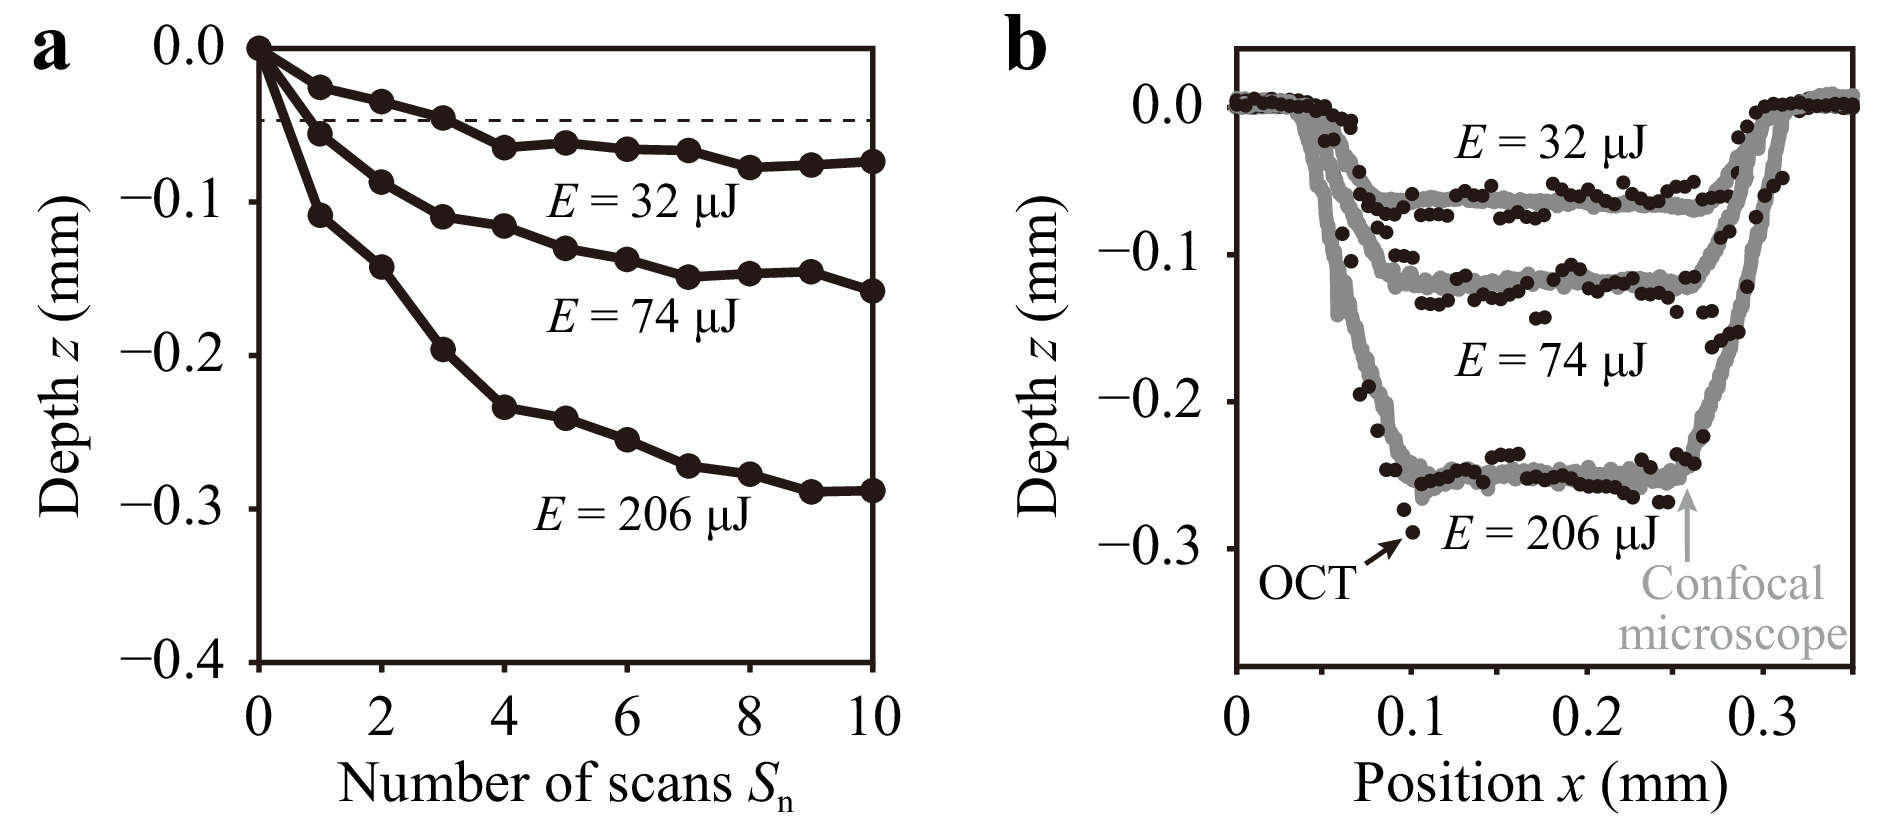
Fig. 10 a Change of the structural depth in laser grooving with the line-shaped beam versus
$ {S}_{{\rm{n}}} $ . Dashed line indicates the depth of focus of the fs laser beam. b Cross-sectional depth profile of the processed structure when$ {S}_{{\rm{n}}} $ = 10. Black dots and gray lines indicate the depth profiles measured by OCT and LCM, respectively.Fig. 11 shows the change of the depth of the structure processed by the line-shaped beam versus E as
$ {S}_{{\rm{n}}} $ was varied. The dashed line indicates the depth of focus of the fs laser beam. When E was less than 30 μJ, there was no significant change in the difference between the depths of the structures as a function of$ {S}_{{\rm{n}}} $ because E was near the threshold. When E was larger than 30 μJ, the increase in the depth of the structure showed nonlinearity with the increase of$ {S}_{{\rm{n}}} $ . In particular, in the early stages of laser grooving ($ {S}_{{\rm{n}}} $ < 3), the depth of the structure rapidly increased. On the other hand, after the intermediate stage of laser grooving (5$ \leqslant {S}_{{\rm{n}}} $ ), the depth of the structure approximately saturated. As in the case of laser grooving with line-shaped, a focus shift of the beam according to the structural depth will also be effective for improving the efficiency of laser grooving.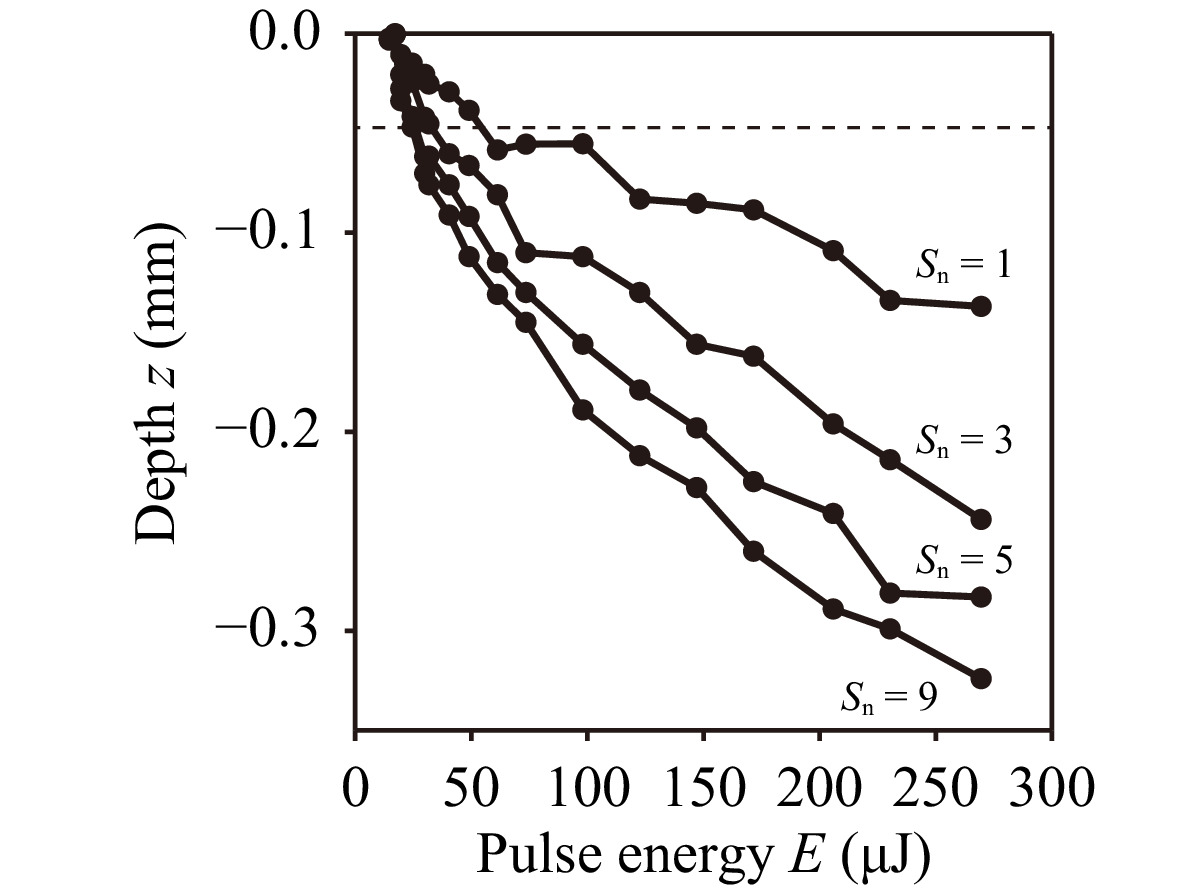
Fig. 11 Change of the depth of the processed structure in laser grooving with the line-shaped beam versus E as a function of
$ {S}_{{\rm{n}}} $ . Dashed line indicates the depth of focus of the fs laser beam. -
In-process monitoring of the depth of a processed structure in laser grooving with a line-shaped fs laser beam was demonstrated by using SS-OCT. To evaluate the performance of the OCT system, the depth resolution, measurement accuracy, and measurable range were estimated to be 15.8 μm, ±2.5 μm, and 5.3 mm, respectively. In addition, to verify the feasibility of OCT for in-process monitoring of the depth of processed structures in laser processing, multi-ring drilling was performed. In the case of drilling with low pulse energy, the SNR of the A-scan profile was significantly decreased by the debris deposited on the bottom of the structure; however, in-process monitoring of the depth of the processed structure was successfully performed. On the other hand, in the case of drilling with high pulse energy, the SNR was rapidly increased with the increase of
$ {S}_{{\rm{n}}} $ . The reason for this originated from the effect of the debris removal due to the shockwave generated by the fs laser irradiation. Finally, in-process monitoring of the depth of a processed structure in laser grooving with a line-shaped beam was performed. From the results, not only the depth of the structure but also the shape of the structure and the distribution of deposited debris in the processed groove were successfully monitored. The measured depth agreed well with the result obtained using LCM. The proposed method will be useful for precise laser processing with feedback control of the laser parameters based on in-process monitoring of the structure. -
This work was supported by JSPS KAKENHI Grant Number JP18K14142 and was performed for the Council for Science, Technology and Innovation (CSTI), Cross-ministerial Strategic Innovation Promotion Program (SIP), “Photonics and Quantum Technology for Society 5.0” (Funding agency: QST).


 DownLoad: