


HTML
-
The transport of light through strongly scattering media is complex. Local refractive index distributions and structural inhomogenities inside the medium induce multiple scattering events that prohibit the imaging of objects or the targeted light transport through the sample. Consequently, a focused wave of monochromatic light sent into the medium will appear as a speckled output. However, the seemingly random speckle pattern is deterministic, which opens the possibility for addressing the scattering effect by adequately shaping the wavefront by employing a spatial light modulator (SLM).
The huge technological and methodological progress of wavefront shaping (WS) approaches1,2 allows today to deliver light or transport information into or through thick biological tissues in real-time and with high spatial resolution. However, the precondition is that the mask displayed on the SLM fits to the desired task.
Most WS techniques have in common that digital holography is the fundamental key for both extracting the amplitude and phase information of the light field that interacted with the sample and for tailoring the holographic amplitude or phase mask displayed on the SLM. Although in general there are various techniques to measure the phase information of light3–5, most of them cannot deal with the phase of speckled light fields or suffer of too low spatial or temporal resolution, which means in practice that digital holography is the working horse in this field.
Knowledge on the desired phase mask can be gained in various ways. The fastest method which requires only one measurement is digital optical phase conjugation (DOPC), which is a digital implementation of optical phase conjugation known from analogue holography6. It was proven that by using DOPC, light can be focused through scattering tissue of about 100 transport mean free path, which corresponds to
$ {9.6}~~{\rm{cm}} $ tissue thickness7. However, DOPC requires that a guide star is introduced into the scattering sample, which emits a known wavefront. In contrast to iterative WS techniques using, for example, photoacoustic guide star signals8, DOPC enables to create a focus at the guide star position in single-shot. In this way, focusing through polystyrene9, mouse skull10, chicken breast7,11 or multimode optical fibres (MMF)12–14 was demonstrated. WS especially revolutionised the applicability of MMF, as they enabled remotely controlling the light propagation through the waveguide. MMFs in principle behave comparable as biological samples, which is why they can be regarded as the waveguide equivalent to bulk random media13. MMFs have the advantage that the number of free modes is known from scratch15 and that the medium is designed for transporting light, which makes it a light efficient scattering sample. Full information on the scattering medium can be obtained by determining the input-output relation, the so-called transmission matrix ($ T_M $ ), which links an orthonormal set of inputs to those at the output. Knowledge of the$ T_M $ enables to control light propagation through the scattering medium and to form a desired light field at the output16,17. Besides applications in light delivery, the$ T_M $ allows to use the scattering medium as imaging optics18. Different approaches to measuring a$ T_M $ have been presented and tested predominantly at MMFs in the past decade19–34. There are only few examples where the$ T_M $ was exploited to study scattering samples. One first example was reported by Popoff et al. at ZnO deposit35. In other work, it was shown that by employing the$ T_M $ , for example, transmission eigenchannels can be identified to optimise the intensity transport through the medium under test36–39. Furthermore, the$ T_M $ bares information of scattering properties, like the optical memory effect40.In this paper, we present first
$ T_M $ measurements on human retinal organoids. The retina is a tissue at the back of our eye providing vision by sensing light, and it is easily monitored live in patients. The retina has several unique optical properties with reflecting and scattering structures41–44, and its physiological functions and changes upon pathology are incompletely understood. Various inherited and acquired retinal degenerative diseases cause changes and loss of tissue structure and cells which may result in vision loss. Degeneration of the light detecting cells, photoreceptors, is commonly mediated by cell death. To study this, several animal models and experimental approaches have been developed. Recently, 3D retina organ-like systems, retinal organoids, have been developed that could serve as a human system for fundamental and preclinical translational research45–47. Multimodal imaging technologies are routinely applied to clinically assess the structure and function of the retina in human patients48,49. However, there are still many challenges in detecting early and distinct cellular changes in retinal diseases by imaging. For example, high resolution imaging, and analysis in 3D across all five major retinal tissue layers is currently still limited, and it is still difficult to obtain contrast on various specific tissue structures. Organoids provide a preclinical human ex vivo system that might help advancing imaging technologies45,50,51, i.e. to experimentally study the underlying physiologic and pathologic tissue properties that correlate with distinct imaging signals and its changes thereof in patients by ex vivo and in vivo correlations52.In this paper, we analyze the capabilities of
$ T_M $ to distinguish different tissue samples. The approach is established at phantom tissues, and applied for the analysis of human tissue. Specifically, we investigate whether differences in tissue properties can be distinguished in human retinal organoids with and without experimentally induced pathology. -
The transmission matrix
$ T_M $ fully describes the propagation of an input light field$ E_{\mathrm{in}} $ (in amplitude, phase and polarisation) through a complex scattering medium for a given wavelength. The entries of the matrix are occupied by coefficients$ t_{mn} $ characterizing the light transmission between the$ m $ th output free mode and the$ n $ th free mode at the input. Therefore, the outgoing light field$ E_{\mathrm{out}}^m $ on the$ m $ th mode can be described by$ E_{\mathrm{out}}^m=\sum_n\left(t_{mn} E_{\mathrm{in}}^n \right) $ , which is a linear superposition of$ n $ modes represented by incoming light fields$ E_{\mathrm{in}}^n $ .In this work, the objective is to investigate the light transmission properties of retinal organoids in a defined sample region. It is reasonable to choose scanning focal points as input modes inspired by Refs. 53, 54. By appropriate shifting of the focal points, an orthogonal basis can be guaranteed. Within our investigations, pixels of holographically captured complex light fields inside the selected observation window are chosen as output modes. In this configuration, it is relatively easy to control light transport into each output mode when using scanning foci at the input. To ensure a pixel-to-pixel projection, and especially to create a simple model for
$ T_M $ inversion, the scanning foci are treated as shifting Fourier pixels of the spatial domain. Foci, i.e. Fourier pixels are generated with the help of digital tilts, which are displayed on the SLM. The required phase masks are calculated using simply a Fourier transform. Experimentally, focal scanning is performed by propagation through a microscope objective. The resulting scan width depends on the optical system and the displayed tilt angle, i.e. location of the Fourier pixel. After hologram reconstruction, complex values inside the selected observation window are reshaped to column vectors, which are normalised by their Euclidean norm, filling the transmission matrix. In Fig. 1, the$ T_M $ measurement procedure is illustrated.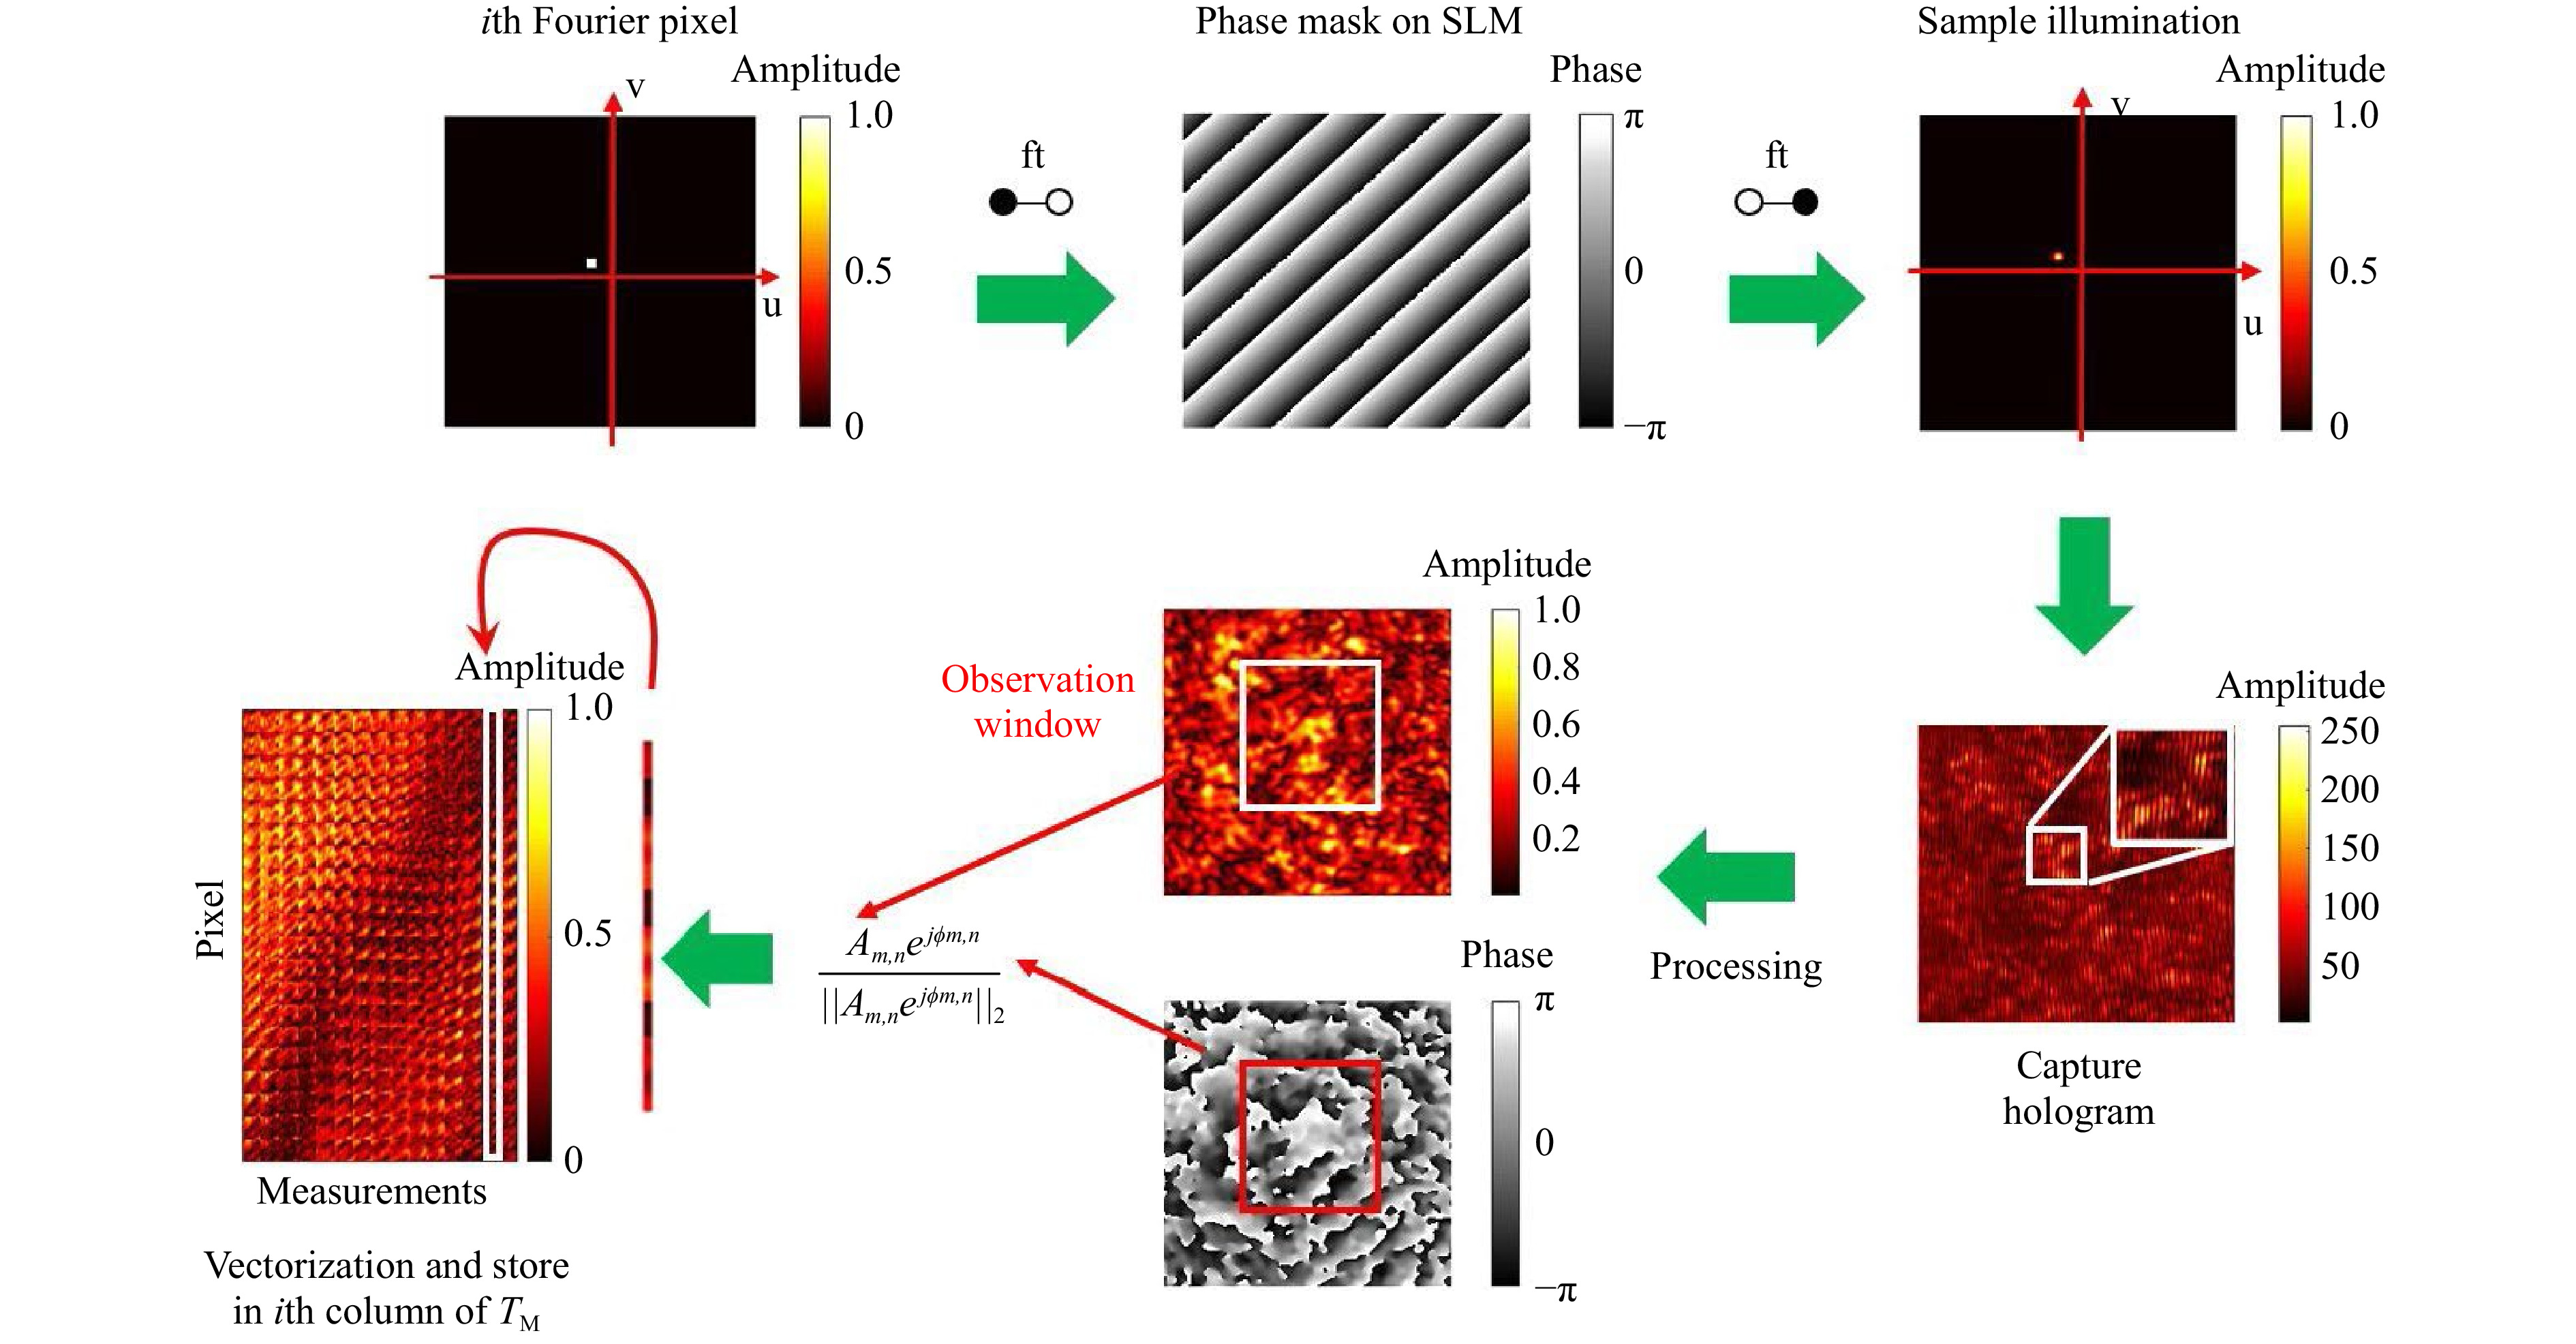
Fig. 1 Procedure of the transmission matrix measurement. Scanning foci are used to measure the TM. A focus is created by a microscope objective. The scan is accomplished by displaying tilts on the SLM. As the SLM is located in the Fourier plane, each tilt corresponds to a certain shift in the image plane. The focus is scattered by the sample and for each shift-position the output speckle pattern is captured holographically. After reconstruction, the 2D amplitude and phase values are shaped to a normalised vector and positioned as a column in the
$ T_M $ . -
The experimental realization of the holographic setup is displayed in Fig. 2. A single-mode laser emitting at
$ {532}~~{\rm{nm}} $ wavelength (Laser Quantum Torus) is used as a light source. Polarization optics are employed to control the intensity in both object and reference beams. One beam is directed towards an SLM (HoloEye Gaea, 10 mega pixel), which is used as a simple scanner during measurement of the$ T_M $ . A 4f-geometry is used to relay the image of the SLM, which is Fourier transformed by a further lens. This Fourier plane coincides with the image plane of the exit port of a commercial inverted microscope, with a custom-built transmission detection path. Displaying a plain phase on the SLM results in a simple on-axis focusing with a microscope objective onto the sample. The light which propagates through the scattering sample is collected by a second microscope objective and is imaged onto a digital camera. On the camera sensor, the object beam interferes with the reference beam recording an off-axis hologram.The hologram is Fourier transformed to get the spatial frequency spectrum. Due to the off-axis configuration the DC and the twin-image components are well-separated. Filtering of the sample spectrum and performing an inverse Fourier transform yields the light-field information. Hence, the amplitude and phase can be measured with single shot55,56. Adding a tilt on the phase displayed on the SLM results in a lateral shift of the focus. For each shifted focus-position the output light-field is measured and stored as described in the previous section.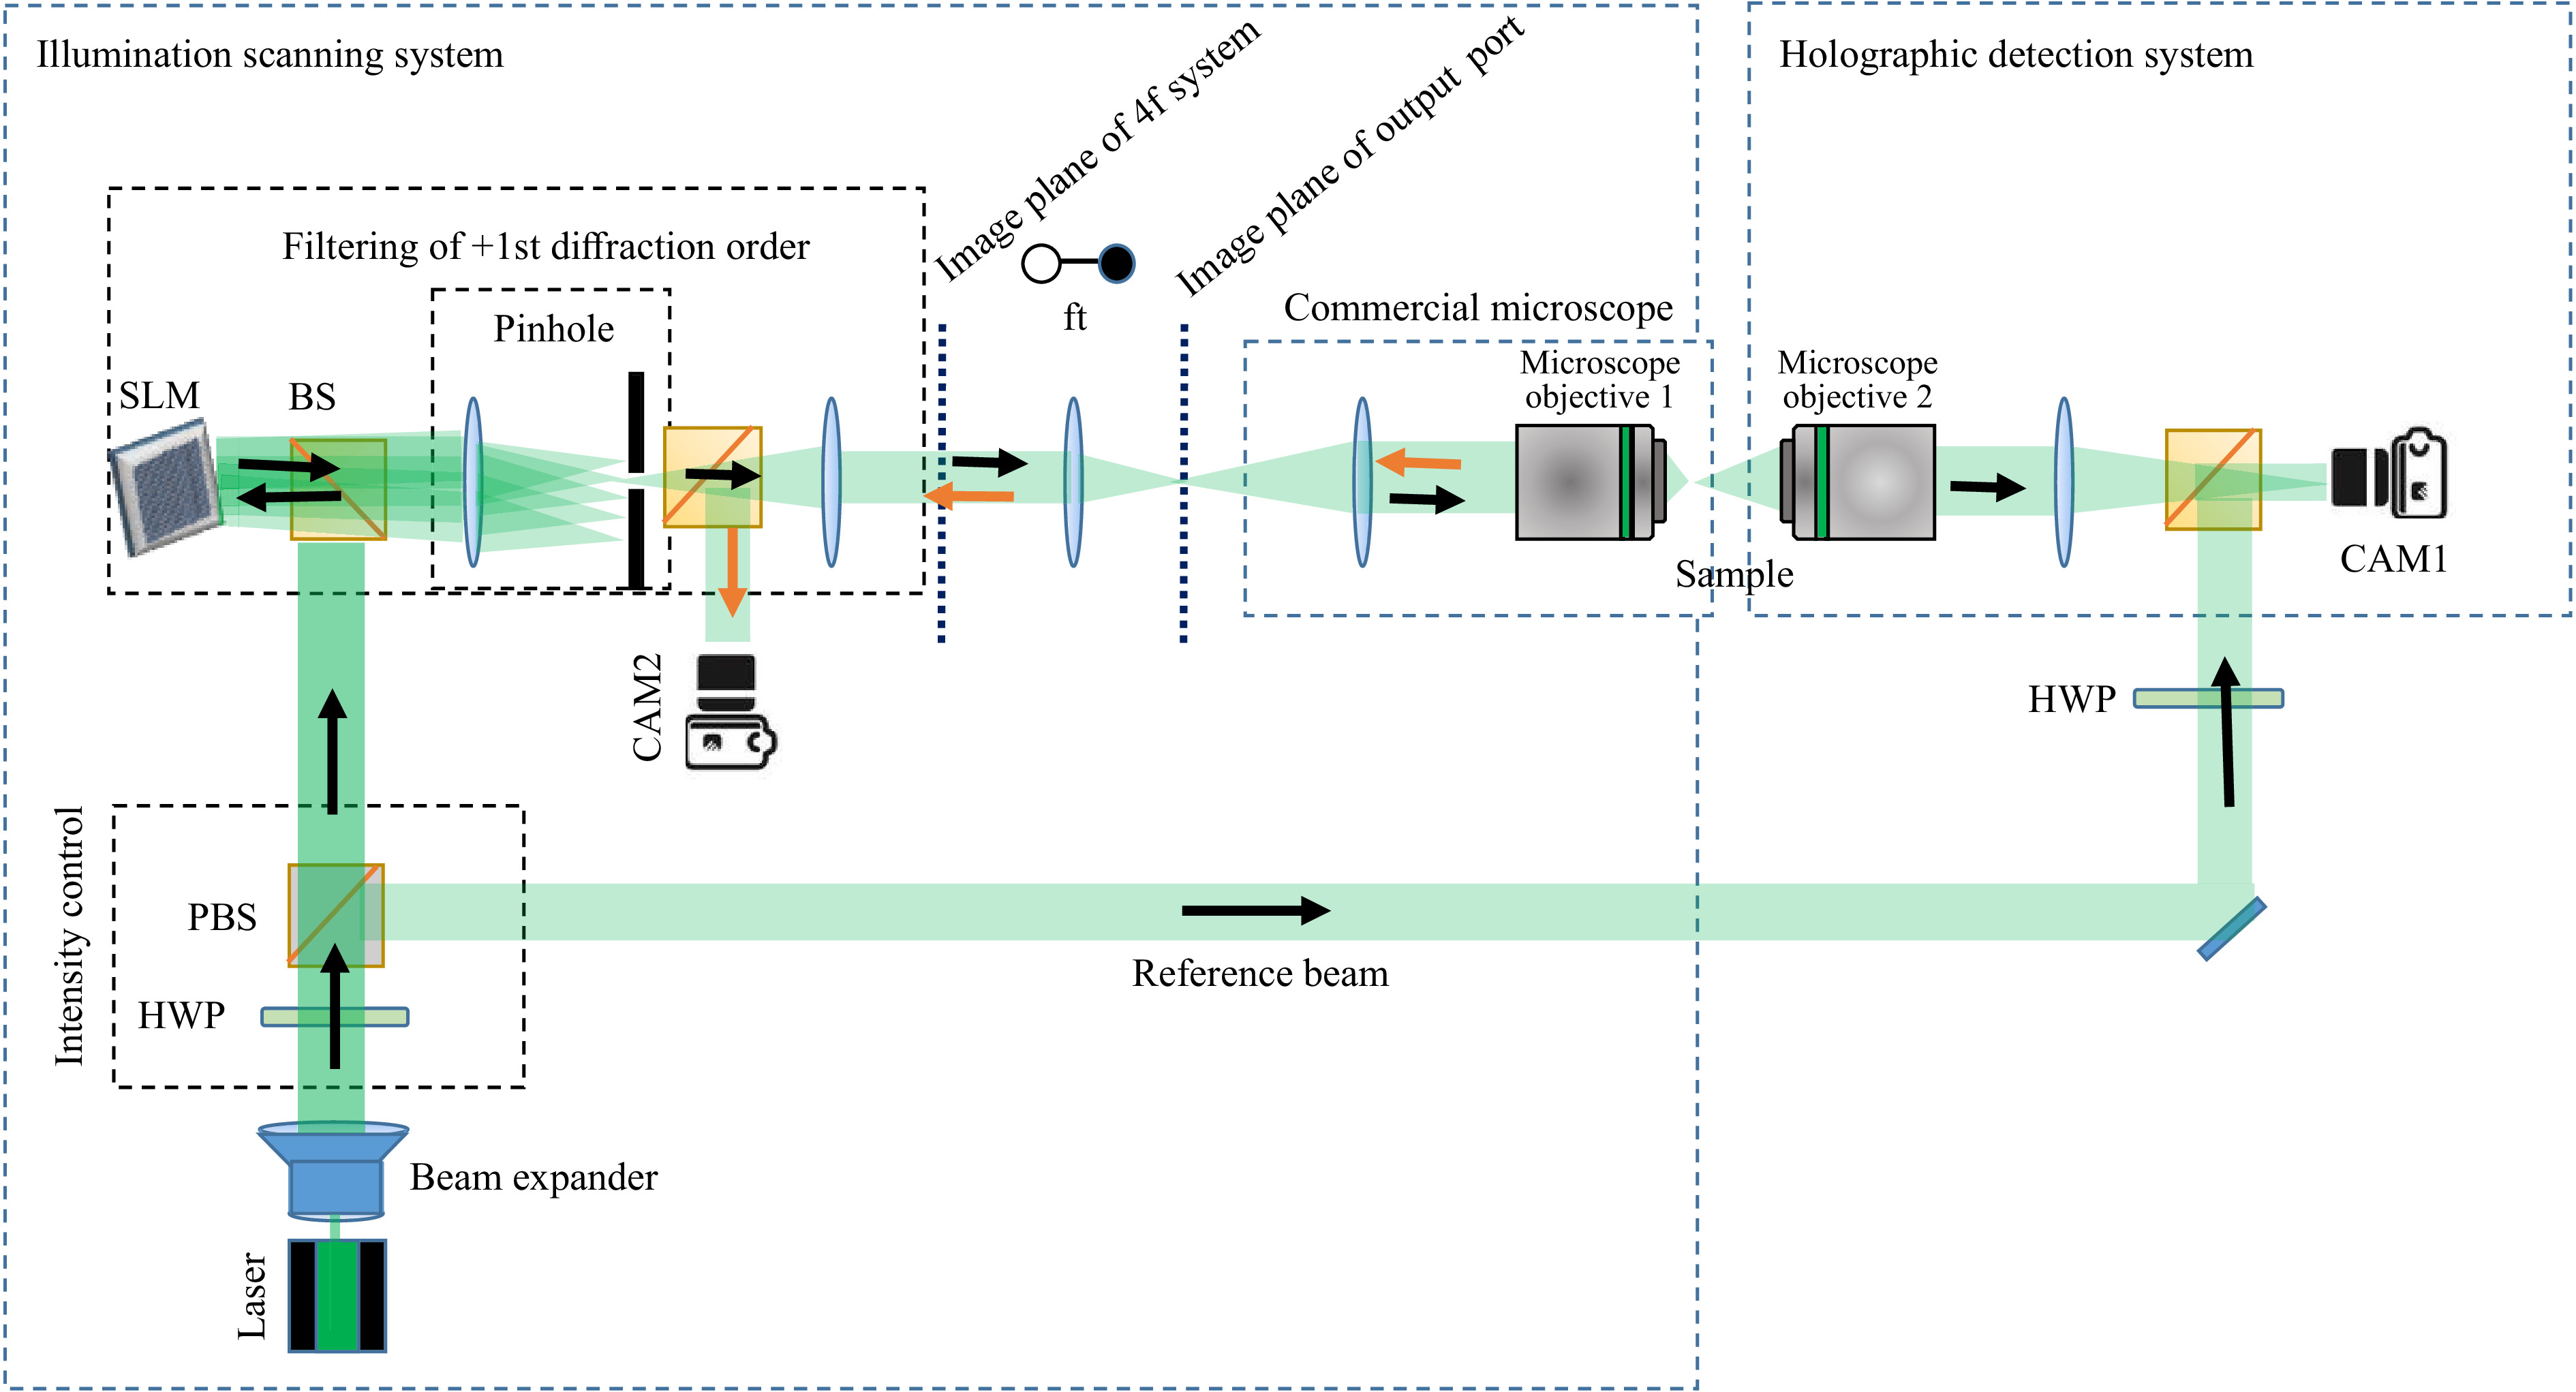
Fig. 2 Sketch of the digital holographic setup for the measurement of the
$ T_M $ . Laser: Torus from Laser Quantum (532 nm), SLM: spatial light modulator HoloEye Gaea, HWP: half-wave plate, PBS: polarizing beam splitter, BS: beam splitter, FT: Fourier transform, Microscope Objective 1: Nikon 40x, 0.6 NA, Microscope Objective 2: Leica Long working distance 40x, NA: 0.6. -
The
$ T_M $ has a large information content, which is underlined by the fact, that knowledge of the$ T_M $ enables to control the output light field through a scattering sample. Commonly, in such a case the aim is to control a large observation window at the output by using a minimal number of measurements. Therefore, the matrices measured are usually not square, but rather rectangular. In this work, the number of camera pixels inside the observation window is much larger than the number of focal points used. Thus, the measurement system is underconstrained. Due to mathematical limitations, it is not possible to perform a straightforward matrix inversion, even with perfect measurements. This is why an inversion approximation is used. In the field of holographic measurement technology, the Tikhonov inversion57 has become established for solving inverse problems for any type of system24,58,59. Tikhonov inversion compensates for singularities by singular value management. In straightforward inversion procedures, singularities occur due to noise amplification caused by inverting measurement noise. With the help of the singular value decomposition (SVD), the complex$ T_M $ of dimension$ M \times N $ and rank$ r $ can be described as$$ T_M = U \cdot \Sigma \cdot V^H $$ (1) $ U $ is a unitary$ M \times M $ matrix and V is a unitary$ N \times N $ matrix, whereas$ H $ denotes the Hermitian transpose. The column vectors of$ U ~~ u_i,i=1,\ldots M $ are called left-singular vectors, the column vectors of$ V ~~ v_i,i=1,\ldots N $ are called right-singular vectors of$ T_M $ .$ \Sigma $ is a real$ M \times N $ matrix occupied by positive diagonal entries$ \sigma_i,i=1,\ldots \, , r $ , which are called singular values of$ T_M $ . If$ T_M $ is both square and regular, it has an inverse, such that$ T_M\cdot T_M^{-1}=I $ , where$ I $ is the identity matrix. Under these assumptions, the inverse can be expressed by:$$ T_M^{-1}=V\cdot \Sigma^+ \cdot U^H $$ (2) $ \Sigma^+ $ contains the singular values$ \sigma_i $ from$ \Sigma $ with the same index, but inverted on the diagonal entries$ \sigma_i^+={1}/{\sigma_i }, $ $ i=1,\ldots\, ,r $ . Within the investigations we consider, the$ T_M $ measured is usually rectangular and does not have an inverse, accordingly. By adjusting the correct number of rows and columns of$ \Sigma^+ $ , however, a pseudo inverse$ T_M^{\dagger} $ can be found via SVD providing$ T_M^{\dagger}\cdot T_M \approx I $ . Additionally, following the Tikhonov approach, noise amplification during the inversion process can be attenuated. Due to measurement noise, the difference between the largest and smallest singular value can be significantly large and entries in$ \Sigma^+ $ can reach extremely high values. Tikhonov inversion, however, performs singular value management according to a regularization parameter$ \lambda $ , such that:$$ \sigma_i^+=\frac{\sigma_i}{\sigma _i^2+\lambda^2},i=1,\ldots ,r $$ (3) For proper inversion,
$ \lambda $ is set to zero and$ T_M^{\dagger}= T_M^{-1} $ under square and regular conditions of$ T_M $ . If$ \lambda > 0 $ , singular values are compressed for noise reduction, but also the relationship$ T_M^{\dagger}\cdot T_M $ deviates more and more from$ I $ . The goal is to keep$ \lambda $ as small as possible, but as large as necessary. Within our investigations,$ \lambda $ was empirically set to$ 10{\text{%}} $ . We have carried out inversions according to Tikhonov varying the extent of different numbers of rows and columns. -
The classical realization of
$ T_M $ measurements aims to control light transmission through the sample at the output. However, the$ T_M $ contains rich sample information, which we want to extract, in order to categorise various biological scattering samples. To study various possibilities, we will take also non-classical realization of the$ T_M $ measurement into account. The samples used are phantom tissues of different thickness and scattering properties and various retinal tissues (see Materials & Methods section). -
In a first step, we perform
$ T_M $ inversion proving that the$ T_M $ we measured is really the transmission matrix of the scattering sample.$ 1,600 $ input tilts are employed to measure the$ T_M $ of a scattering phantom of 1 TMFP (see Fig. 3).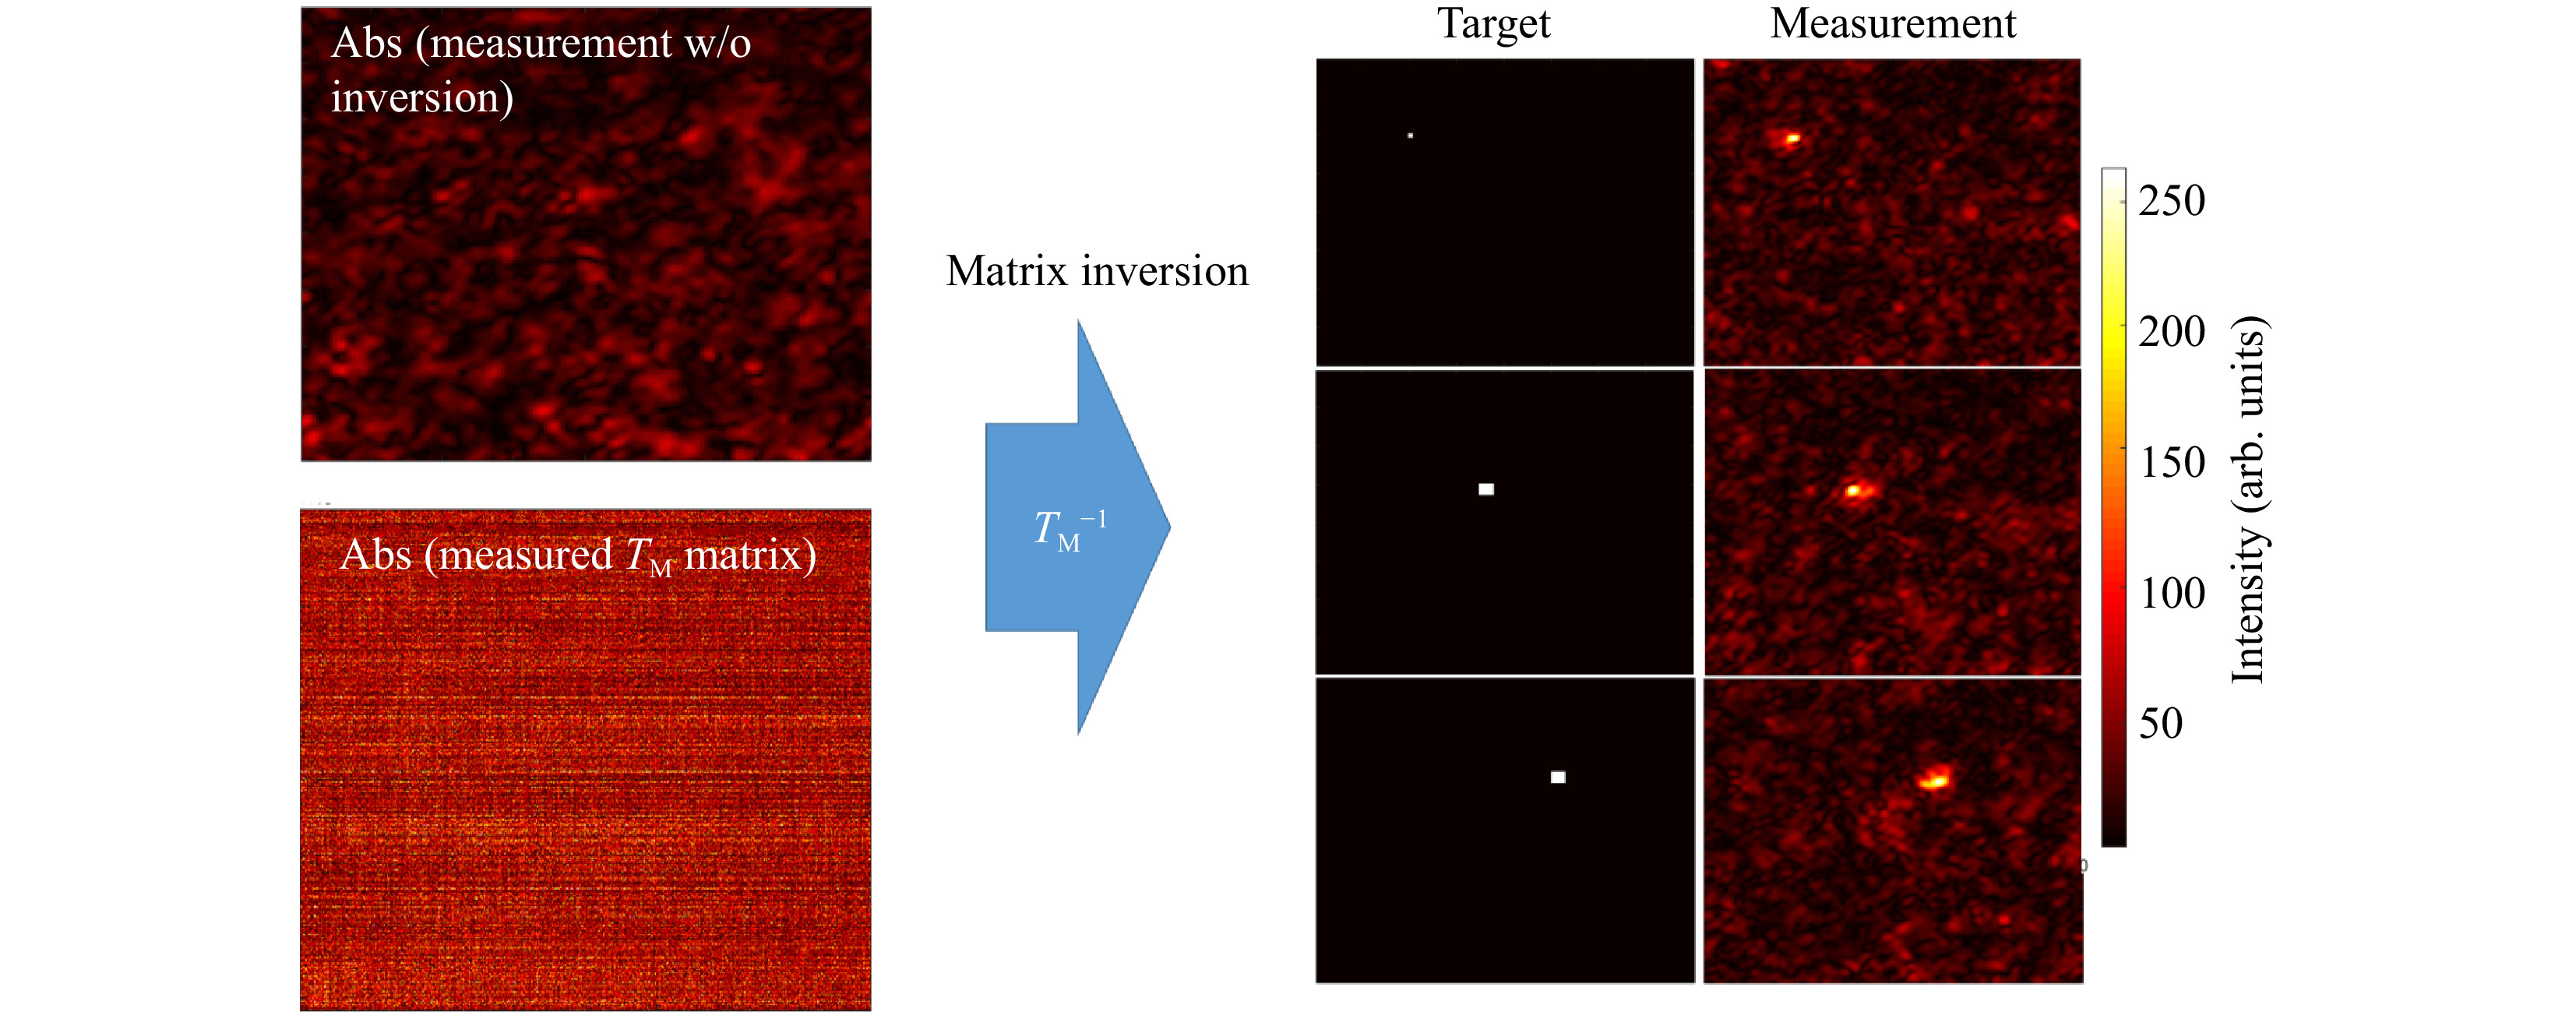
Fig. 3 Example for a
$ T_M $ inversion. The output light field distribution without wavefront pre-shaping is a simple speckle-field (left, top). Knowing the$ T_M $ of the scattering medium (left,bottom) allows for targeted light field generation at the output using Tikhonov inversion. The right part of the Figure shows three exemplary target positions and the corresponding experimentally created foci.The number of pixels to be controlled are 160 × 160, which means that the measured
$ T_M $ has M = 25,600 columns. With the effective magnification of the system, we calculate the size of the observation window to be$ \approx\; {12}~{\rm{ \text{ μ} m}}\;\times{12}~{{ \rm{\text μ} m}} $ .Far fewer tilts than camera pixels are used to avoid temporal instabilities or drifts. Thus, the
$ T_M $ measured is rectangular with$ N $ columns and$ N < M $ . After Tikhonov inversion, it is possible to create any desired light field at the output, albeit with a reduced peak to background ratio (PBR) 10 compared to the optimum, due to the low number of tilts used (see Fig. 4a). Note that the$ T_M $ enables establishing a focus scan at the output, which is not dependent on the optical memory effect.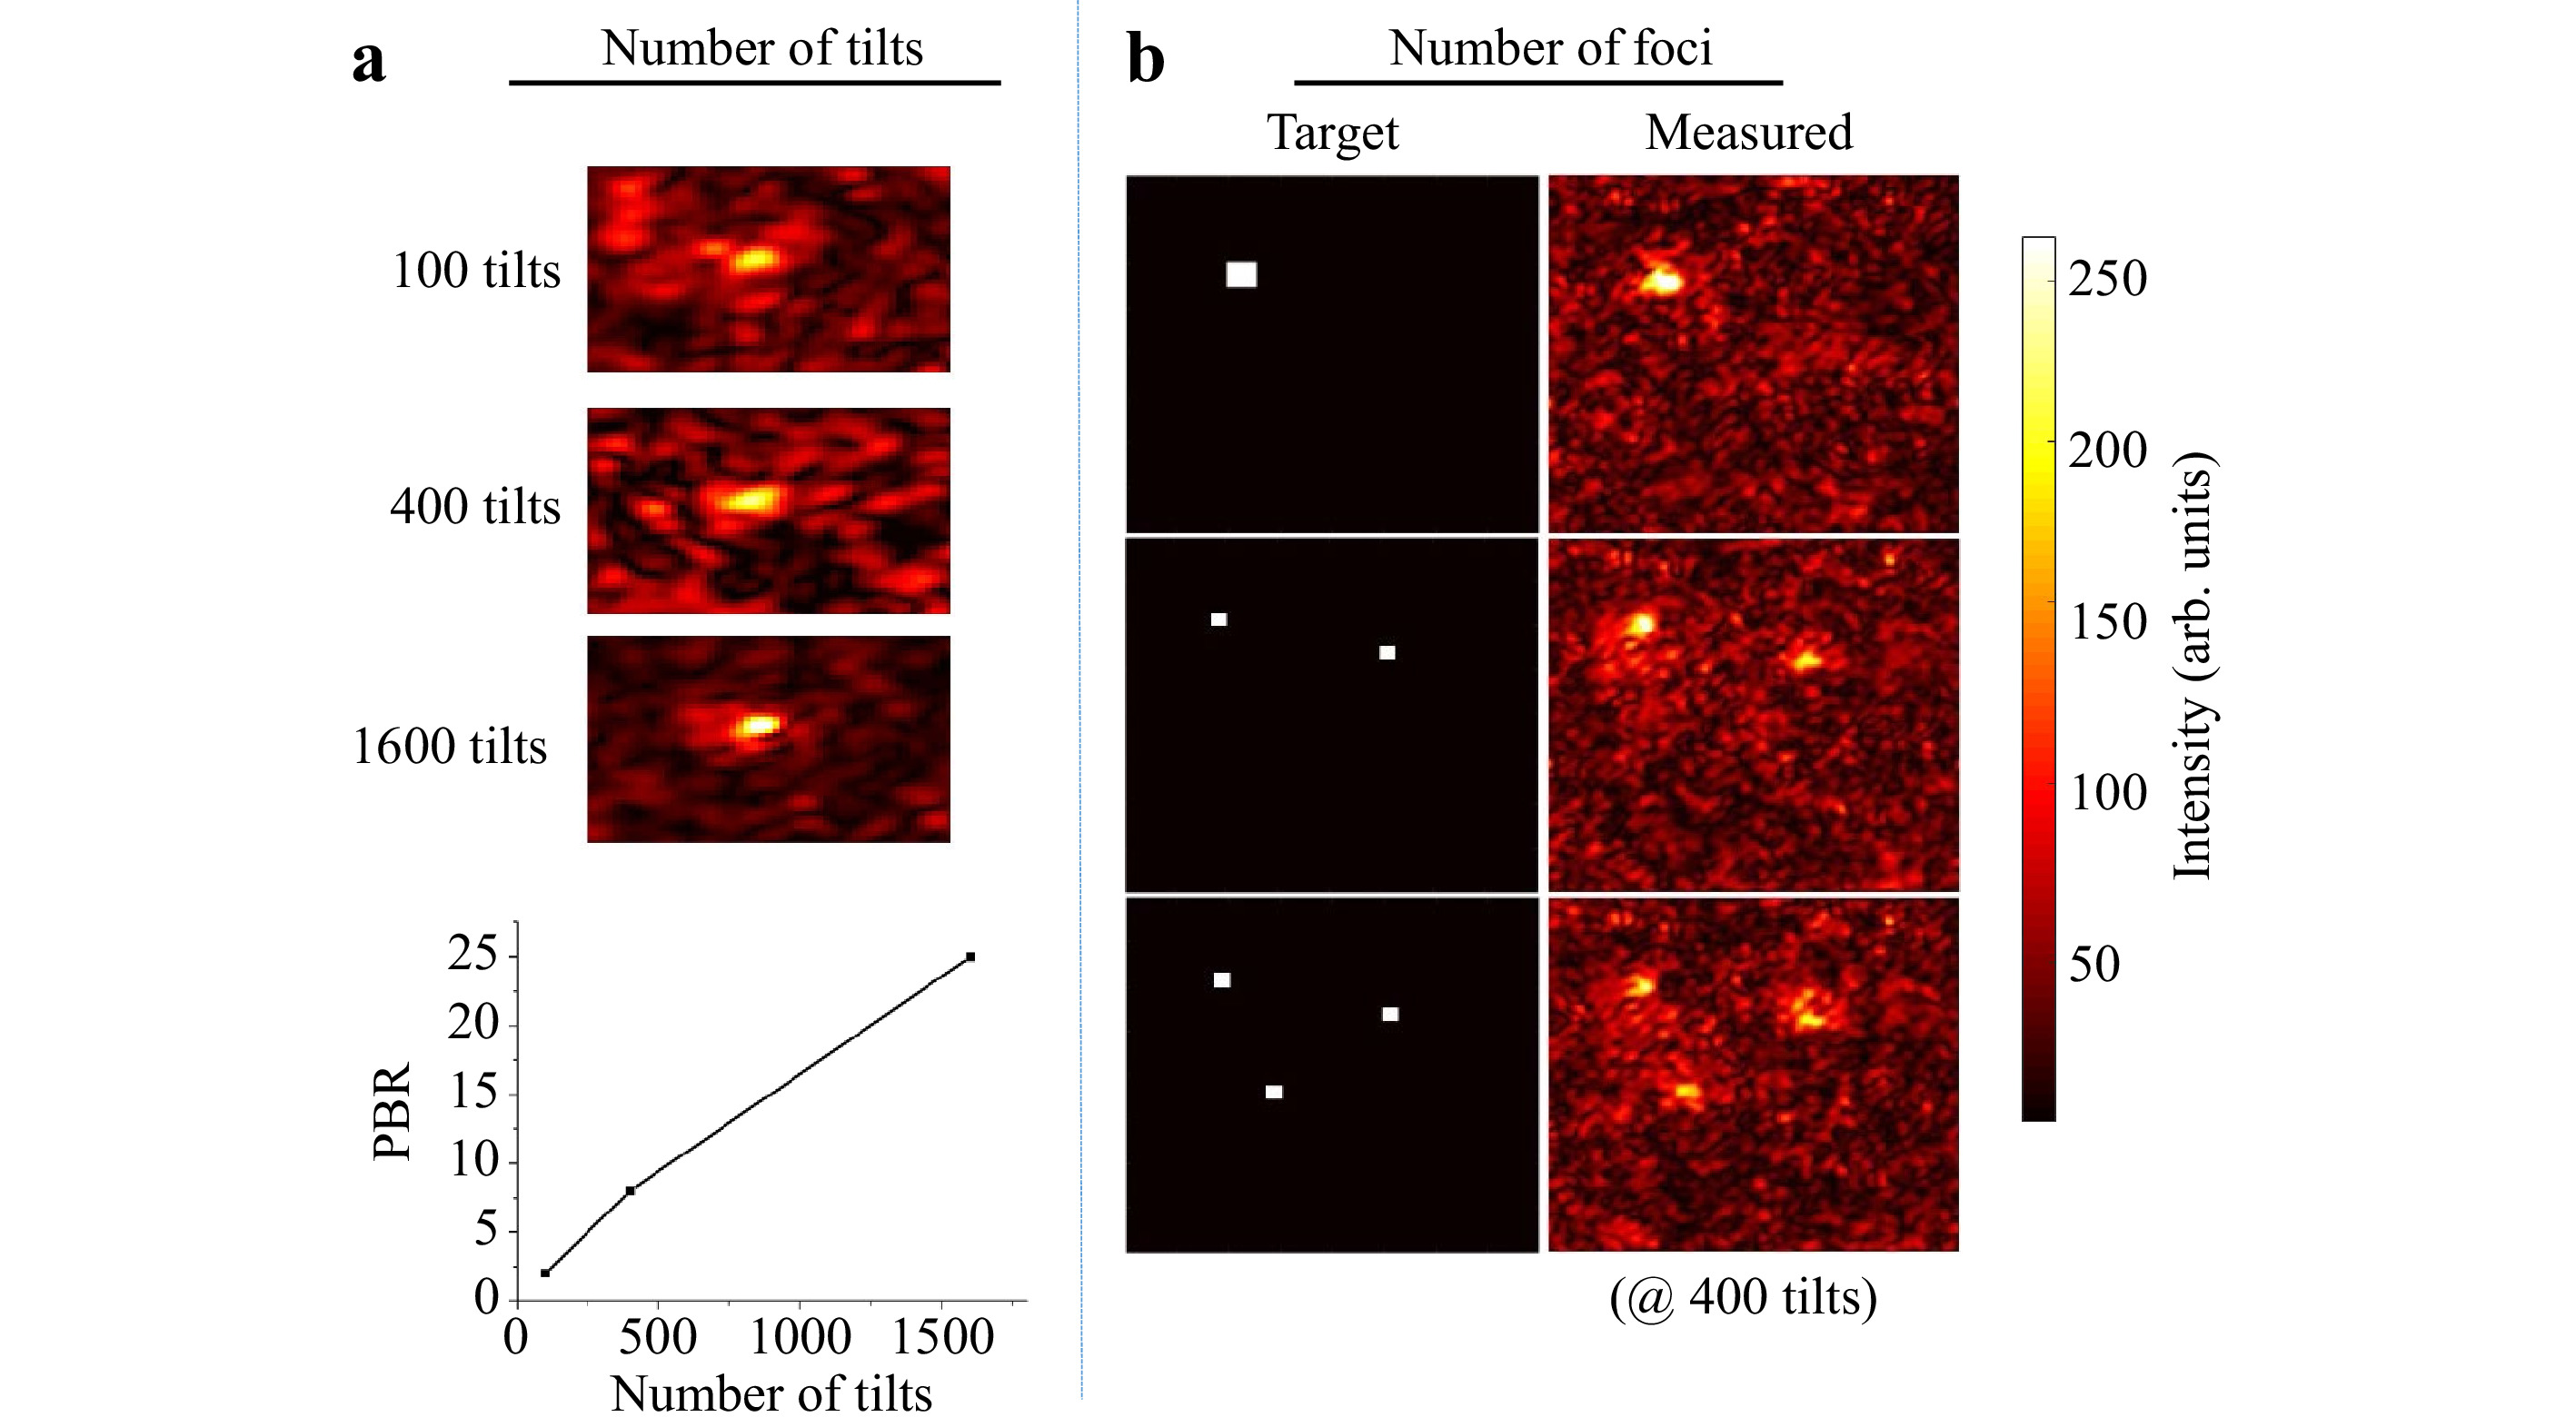
Fig. 4 Details on matrix inversion. The resulting quality of the inversion both scales with decreasing the number of tilts a and increasing the number of desired foci generated in the observation window b. However, matrix inversion and the creation of a focus also works with only 100 tilts compared to
$ 25,600 $ pixels controlled in the observation window. -
As described above, we use a scanning focus at the sample input and measure the light field after interacting with the sample at the output using a camera. Thus, the recorded data contains information on:
1. attenuation of the light level transmitted through the sample, which can be attributed to backscattering, absorption and shadowing.
2. scattering, which leads to redistribution of the intensity distribution and speckles.
3. local differences of the attenuation and scattering.
Extraction of sample information from the
$ T_M $ requires the characteristics of the illumination to be known. Interaction of the scanning focus with the sample will lead to a change of the recorded output light field, which bears the desired information. Thus, it is required to measure a reference, which calibrates the systematic aberrations and the system behavior. However, the appropriate choice of a calibration strategy can be challenging. The straightforward approach is to determine the$ T_M $ of the scanning focus without any sample in the beam path, which means that the$ T_M $ of a cover glass is measured as depicted in Fig. 5a. However, this reference is not suitable for the case which is commonly present for$ T_M $ measurements, where the light field is measured at the output of the scattering sample, as shown in Fig. 5b. The microscope objective MO2 needs to be refocused to the output, which will consequently result in a defocusing compared to the scanning focus reference. Hence, if a reference is required, either a defocused calibration needs to be recorded, or an alternative approach for the measurement procedure needs to be investigated.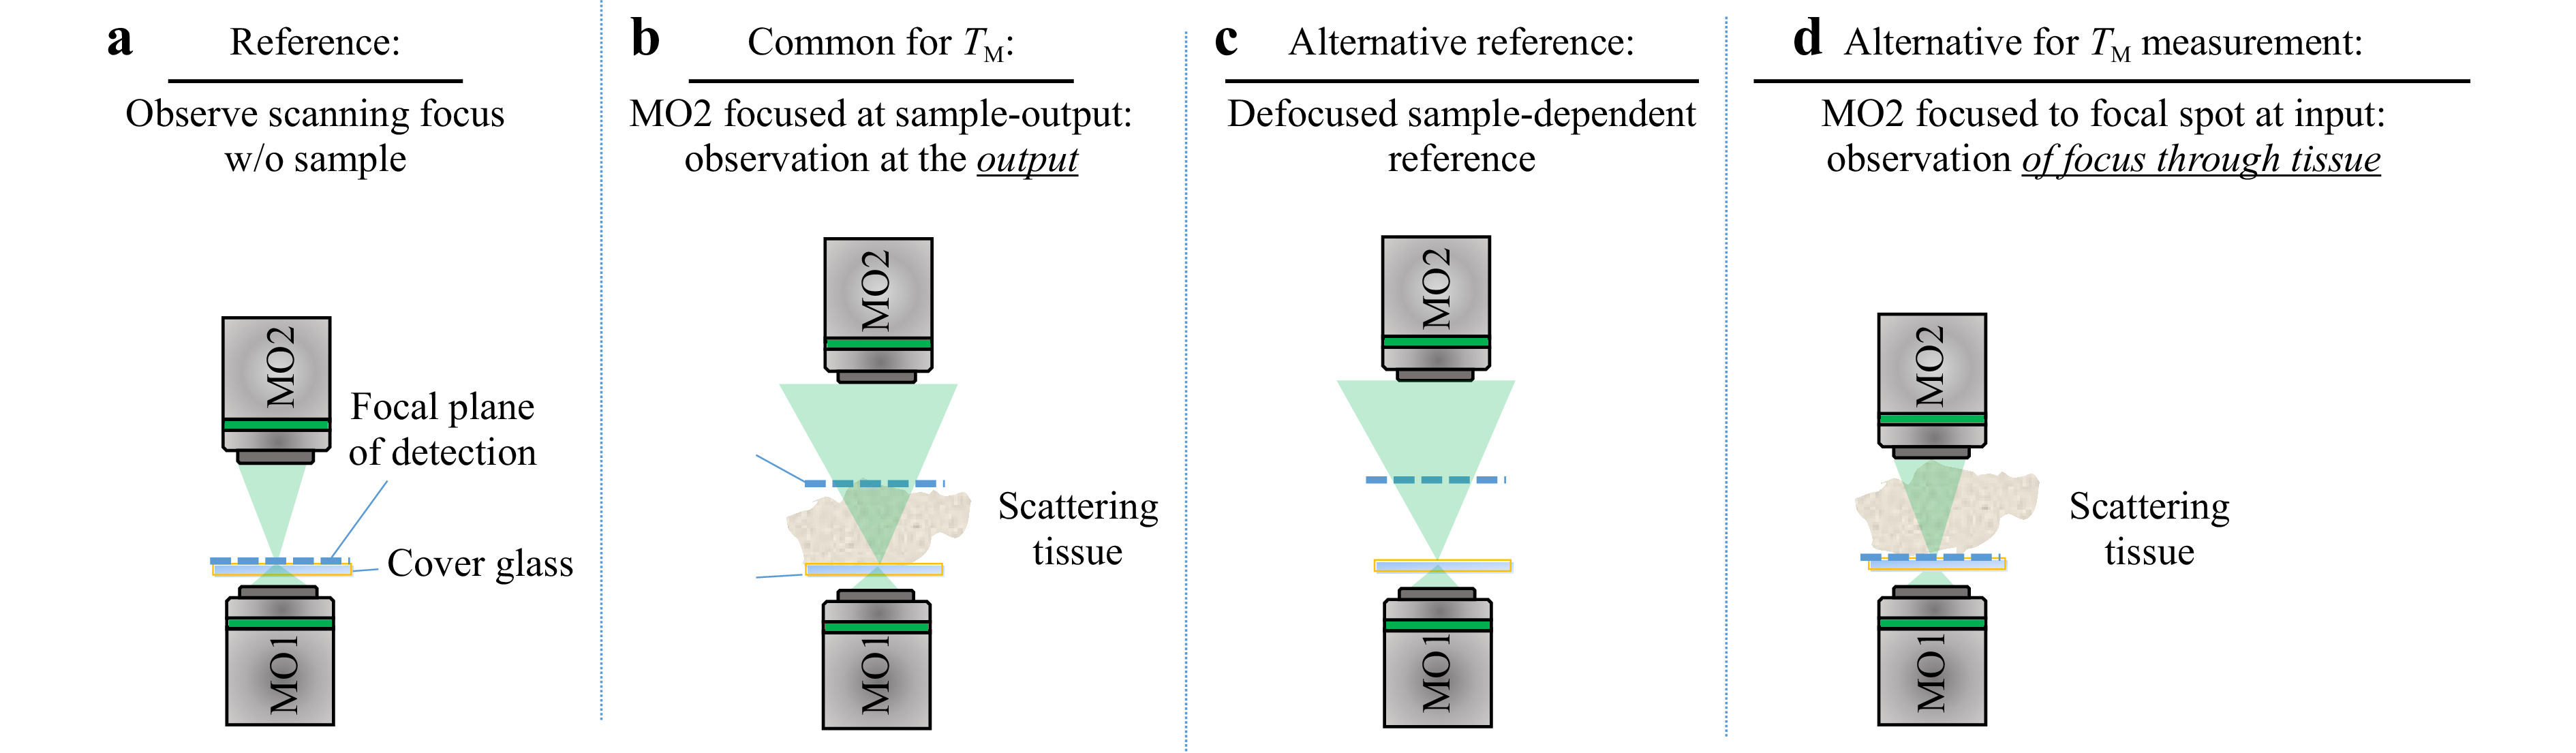
Fig. 5 Various experimental approaches for providing a suitable reference for
$ T_M $ measurement. a The calibration measurement is performed on a cover glass slide, on which the scattering sample is located during measurement. The microscope objective for the detection focuses on the cover glass. b For the common approach of$ T_M $ measurement, the microscope objective is focused on the output of the scattering sample. c Either an alternative reference or d an alternative procedure for the matrix measurement observing the focus through the sample is required.The defocused reference is sample-dependent and needs to be recorded for each measurement separately. A disadvantage is, that a comparison of samples with different thicknesses strongly depends on the repositioning precision. Additionally, for thick samples (i.e. large defocus), the whole camera is illuminated and aberrations play a bigger role (see Fig. 5c). In order to use the scanning focus as a reference properly, as shown in Fig. 5a, the scanning focus needs to be recorded through the scattering tissue, as shown in Fig. 5d. This results in another kind of transmission matrix which we refer to as
$ T_{M,\mathrm{focus}} $ . Usually,$ T_{M,\mathrm{focus}} $ is not suitable for inversion creating a tailored output light field. However, the information contained is suitable for aberration correction on the detection camera. The spatial rearrangement of the Gaussian input focus by sample illumination can be compensated by applying$ T_{M,\mathrm{focus}} $ . The applicability of this approach is limited by the working distance of MO2 and the optical path length of the scattering sample, as it is required that the focus is observable through the tissue. Depending on the actual application, the sample can be characterised by using a reference tissue. In the following, we performed measurements on phantom tissues, which we fabricated according to the recipe described in [60]. These tissues are based on polydimethylsiloxane (PDMS) with various glycerol concentration that change the scattering coefficient of the samples (compare Table 1). All samples have the same thickness of 500 µm ± 20 µm, which enables to take the sample with pure PDMS as a reference.Sample TMFP MFP thickness PDMS 0 0 500 μm s1 0.1 4 500 μm s2 0.3 12 500 μm s3 1 40 500 μm Table 1. Overview of the specifications of the phantom tissues used, for 532 nm wavelength.
-
Knowledge about the transmission matrix enables to control the light propagation through scattering tissue. This shows that the matrix contains rich sample-specific information. Yet, implementation of matrix inversion does not rely on sample characteristics, which is why they are commonly not of interest. With suitable mathematical operations, however, various figures of merit can be obtained. A powerful tool to determine sample characteristics is SVD (Eq. 1). The course of the singular values (SV) on the diagonal of
$ \Sigma $ is based on specific laws and depends on properties of the sample observed. An evaluation of the distribution of singular values enables analysing scattering properties of the sample under test. Popoff et al. have shown that the random-like scattering behavior of an ideal ZnO deposit is mathematically well described35. According to the random matrix theory61, the SV distribution of mean-free matrices occupied by uncorrelated entries of variance 1 is following the so-called “quarter-circle law”. However, it should be mentioned that the course of the SV significantly depends on the setup and therefore, for example, additional averaging over the camera pixels or removal of correlated entries is necessary in order to observe an SV distribution according to the quarter-circle-law.Mathematically, if the SVD is applied to
$ T_M $ (or$ T_{M,\mathrm{focus}} $ ), it tries to minimise its rank. In this way, the SVD can be used to identify essential information channels that provide information content, but with minimum number. For example, performing SVD to an exemplary$ T_M $ with rank$ r=800 $ using Eq. 1,$ 800 $ SVs can be determined, as shown in Fig. 6a. The original$ T_M $ can be reconstructed by multiplication of the three extracted matrices$ U,\Sigma,V^H $ . Here, all SV are used. However, if the entries on the diagonal of$ \Sigma $ are considered as independent information channels, certain properties can be assigned to them. In most cases, SV are sorted by magnitude in ascend (or descend) order, whereby several orders of magnitude can lie between the strongest and weakest SV. Strong SV correspond to a strong flow of information through these channels. However, the information content of the$ T_M $ can be reproduced by a number of information channels which is smaller than its rank. There is a point between the strongest and the weakest SV where a distinction between essential information channels and non-essential ones is possible. Channels with substantial information content can be considered as signal and the others as noise (see Fig. 6a). Gavish and Donoho have introduced a strategy where the optimal point of truncation between signal and noise can be identified62. Considering any rectangular$ M \times N $ data matrix$ Y $ with unknown noise level and$ M \ne N $ , the optimal threshold$ \omega(\beta) $ can be determined by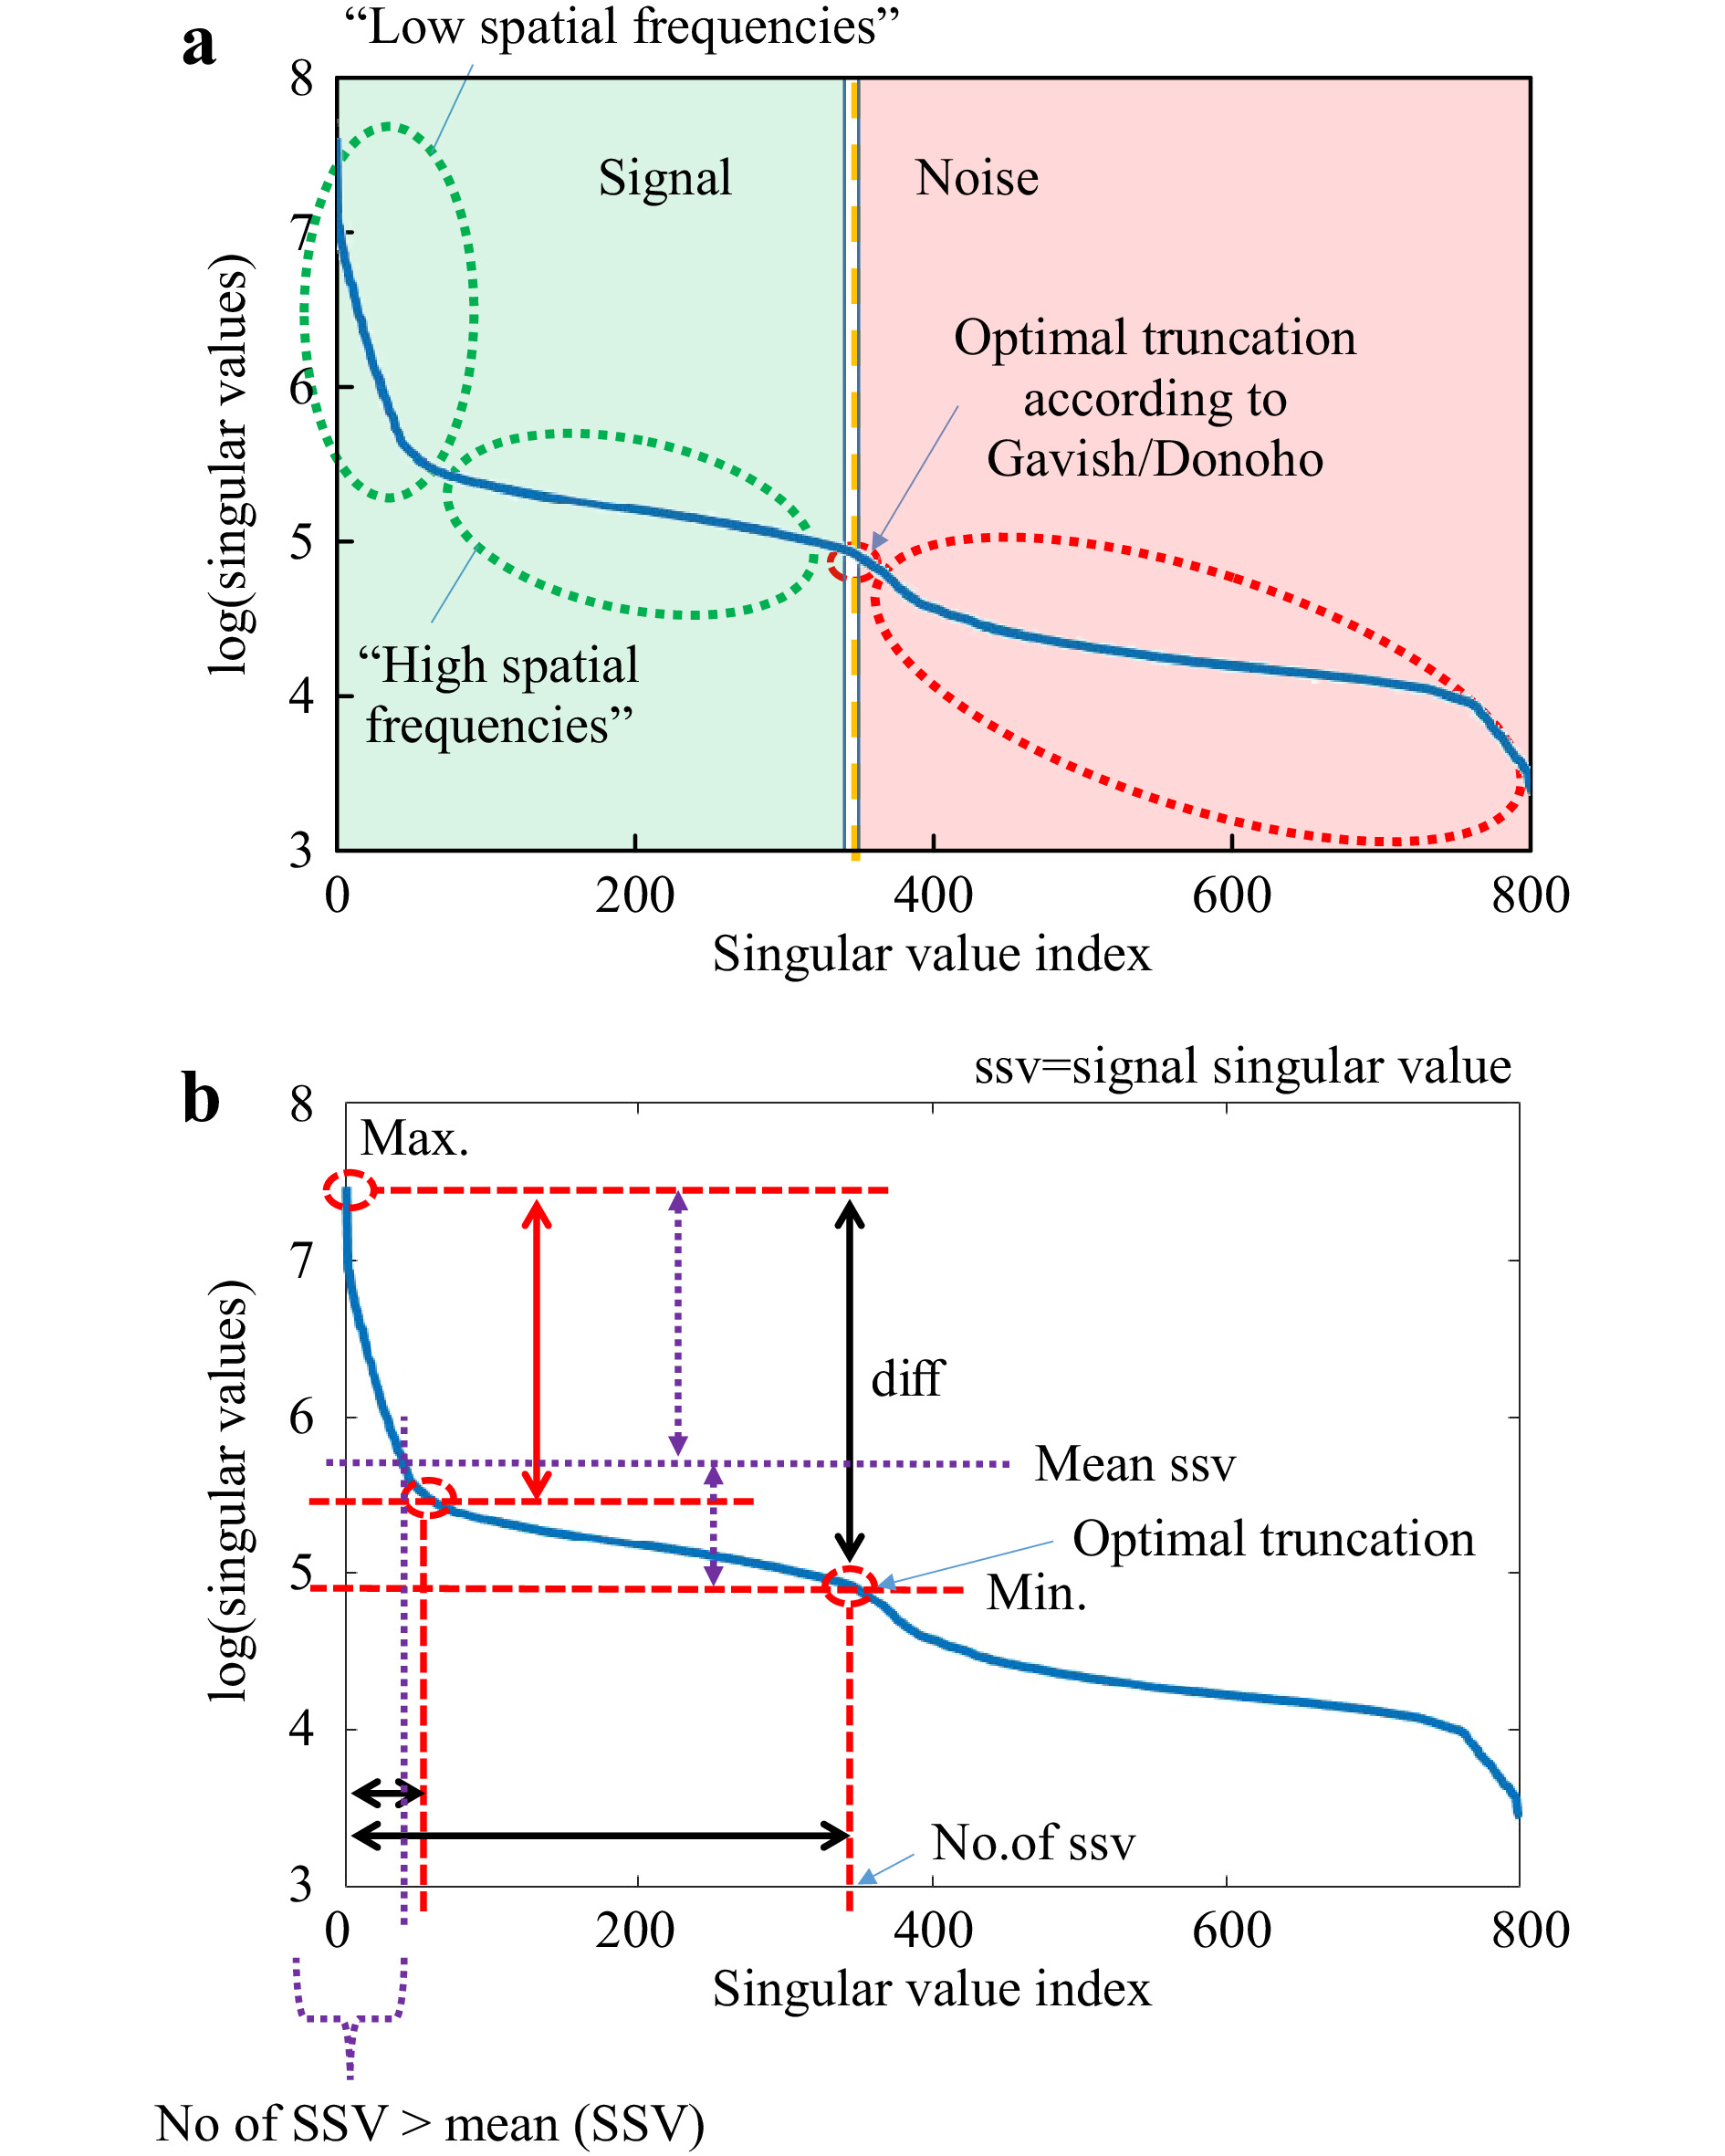
Fig. 6 Explanation of typical SVD-curve. We measure the
$ T_M $ and perform the SVD. a The resulting sorted singular values (blue curve) are further evaluated according to the method described in Ref. 62, which allows to determine the optimal truncation point$ \tau $ . This point separates the singular values corresponding to the signal from the noise. The remaining singular values of the truncated SVD correspond to the spatial frequencies occuring in the$ T_M $ . b Besides$ \tau $ , the course of the SVD allows to determine various characteristic values. In the following, we will just concentrate on the dynamic range (difference max (SSV)-min (SSV)), the ratio r max (SSV)/mean (SSV), the position of the “knee” and the number of SSVs.$$ \omega(\beta) \approx 0.56 \beta^3 - 0.95\beta^2 + 1.82\beta + 1.43 $$ (4) with
$ \beta = {M}/{N} $ . Hence, the truncation point$ \tau $ can be derived:$$ \tau=\omega(\beta)\cdot \sigma_{\mathrm{med}} $$ (5) with
$ \sigma_{\mathrm{med}} $ being the median SV of$ Y $ . At this transition point, the SV vector is truncated, keeping the signal singular values (SSV). The characteristic levels of magnitude in relation to the truncation point$ \tau $ are illustrated in Fig. 6b. The SSV are an analogon to a Fourier transform. While the high value SSV correspond to low spatial-frequencies (and high intensities), the lower value SSV belong to the high spatial-frequencies (and low intensities) (compare Fig. 7). The general level of the SSV bares information on the overall transmittance. In the field of telecommunications, the$ T_M $ provides information about real communication channels when using space division multiplexing through an MMF. In the course of the singular values, a cut-off frequency can be identified, above which a number of usable spatial channels can be determined21. As mentioned above, the SVD strongly depends on setup parameters. This finding relates to the aforementioned reference problem. If we measure the$ T_M $ for 5 axial positions of the detection objective MO2 without any scattering tissue in the beam-path, we obtain strongly changed SVD courses (see Fig. 8). However, in order to obtain relevant sample information, a reference is required to observe the sample induced changes in the$ T_M $ .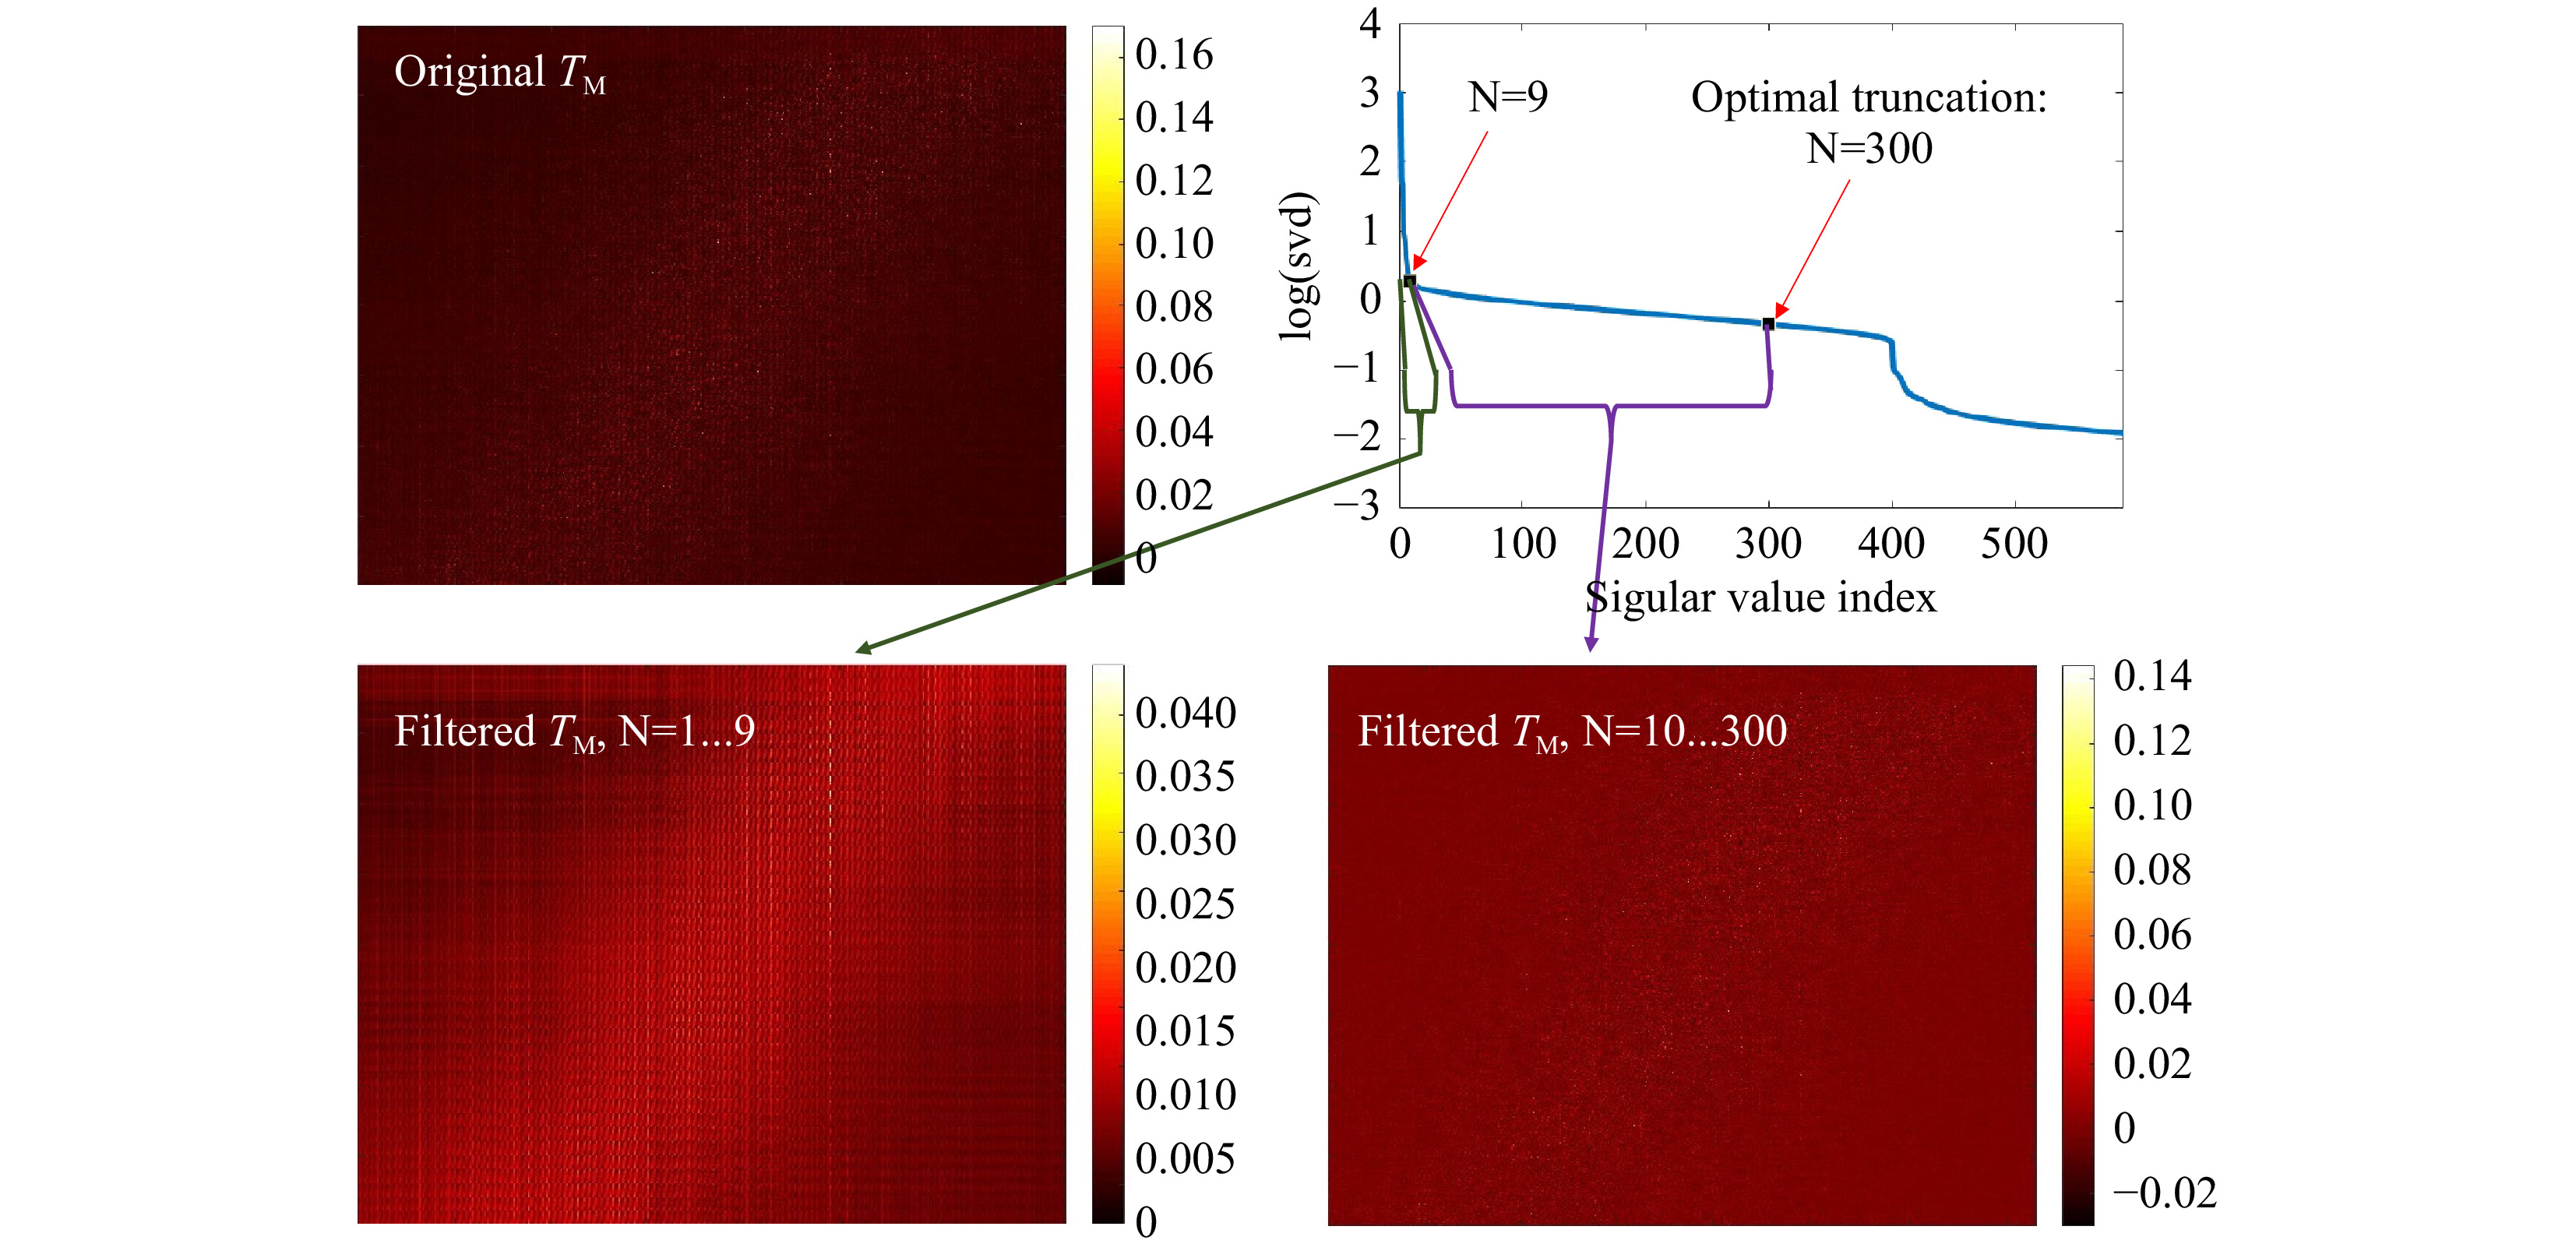
Fig. 7 Truncation of the SVD. The SVD (upper, right) of the original
$ T_M $ (upper, left) is calculated and truncated (see Eq. 5). The signal is spread over N=300 singular values. The first N=9 SSVs show a different behavior than the N=10…300. Using the first 9 SSVs for reconstruction and the N=10 to 300, shows that the SSVs behave like low (N=1...9) and high (N=10…300) spatial frequencies. The measurement was performed on the phantom tissue ‘s3’.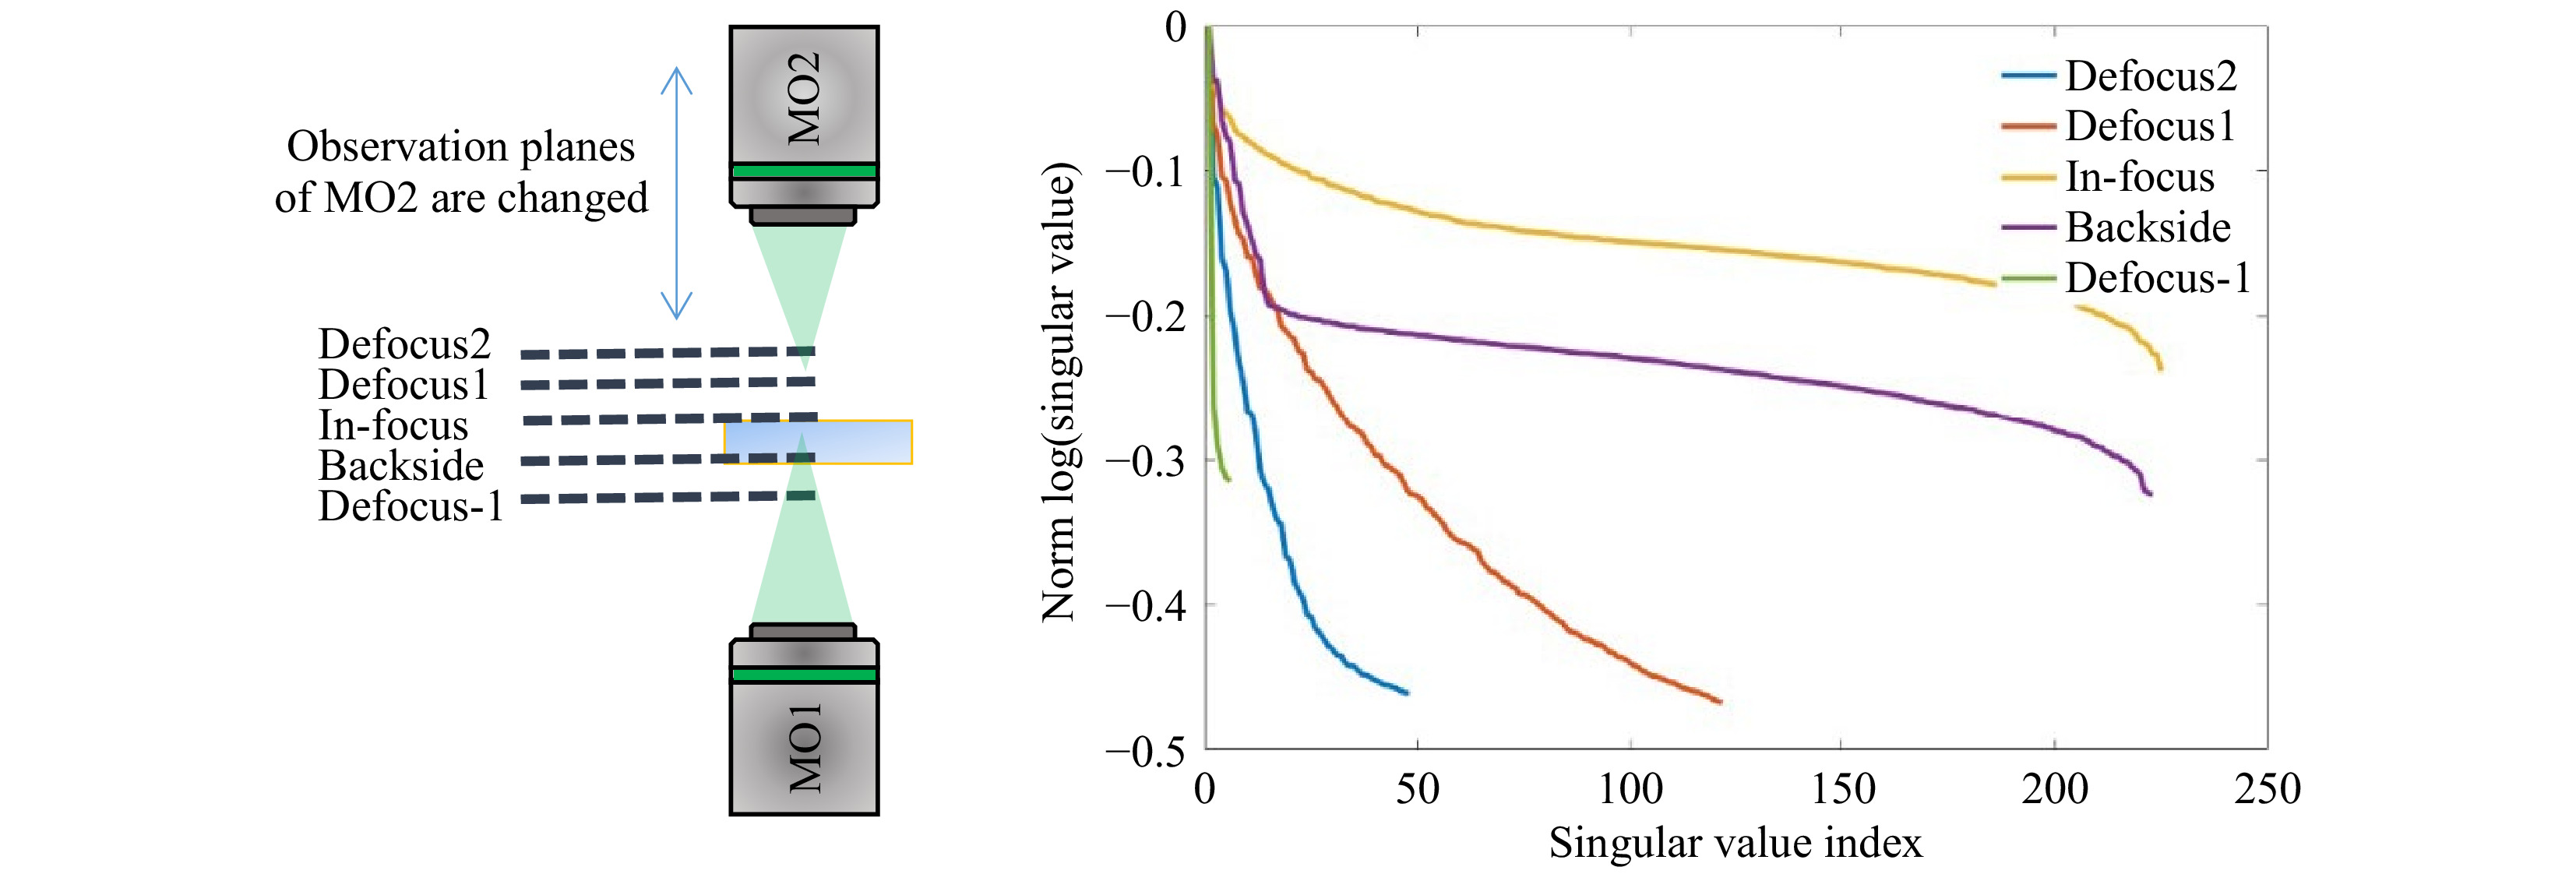
Fig. 8 Influence of defocus on the SVD. Defocusing the detection objective yields strong changes of the SVD course. Additionally, the number of SSV decreases and the dynamic range increases. However, for too strong defocusing the SSVs nearly vanish.
-
We keep the experimental conditions constant, such as laser power, exposure time and only change the phantom tissue under test increasing the scattering coefficient. As all tissues have the same thickness, we take the pure PDMS sample as the reference. First, we measure the corresponding
$ T_{M,\mathrm{focus}} $ of all samples, as shown in Fig. 9. After SVD evaluation (see Fig. 10), we observe that with increasing scattering$ \tau $ shifts to a lower SV index and thus, the signal is spread over a smaller SSV range. Hence, as a first relevant magnitude, the shift of$ \tau $ can be used to compare the relative scattering behaviour of the sample under test. Additionally, the course of the SSV depends on sample characteristics. These are among others: the ratio$ r $ between the maximum SSV and the mean$ r={\mathrm{max}(SSV)}/ $ $ {\mathrm{mean}(SSV)} $ , the dynamic range$ d=\mathrm{max}(SSV)- $ $ \mathrm{min}(SSV) $ , the number of SSV with$ SV >\mathrm{mean}(SSV) $ , the number of remaining SSV after truncation and the position of the ‘knee’, which divides high SSV and low SSV (compare explanation shown in Fig. 6b).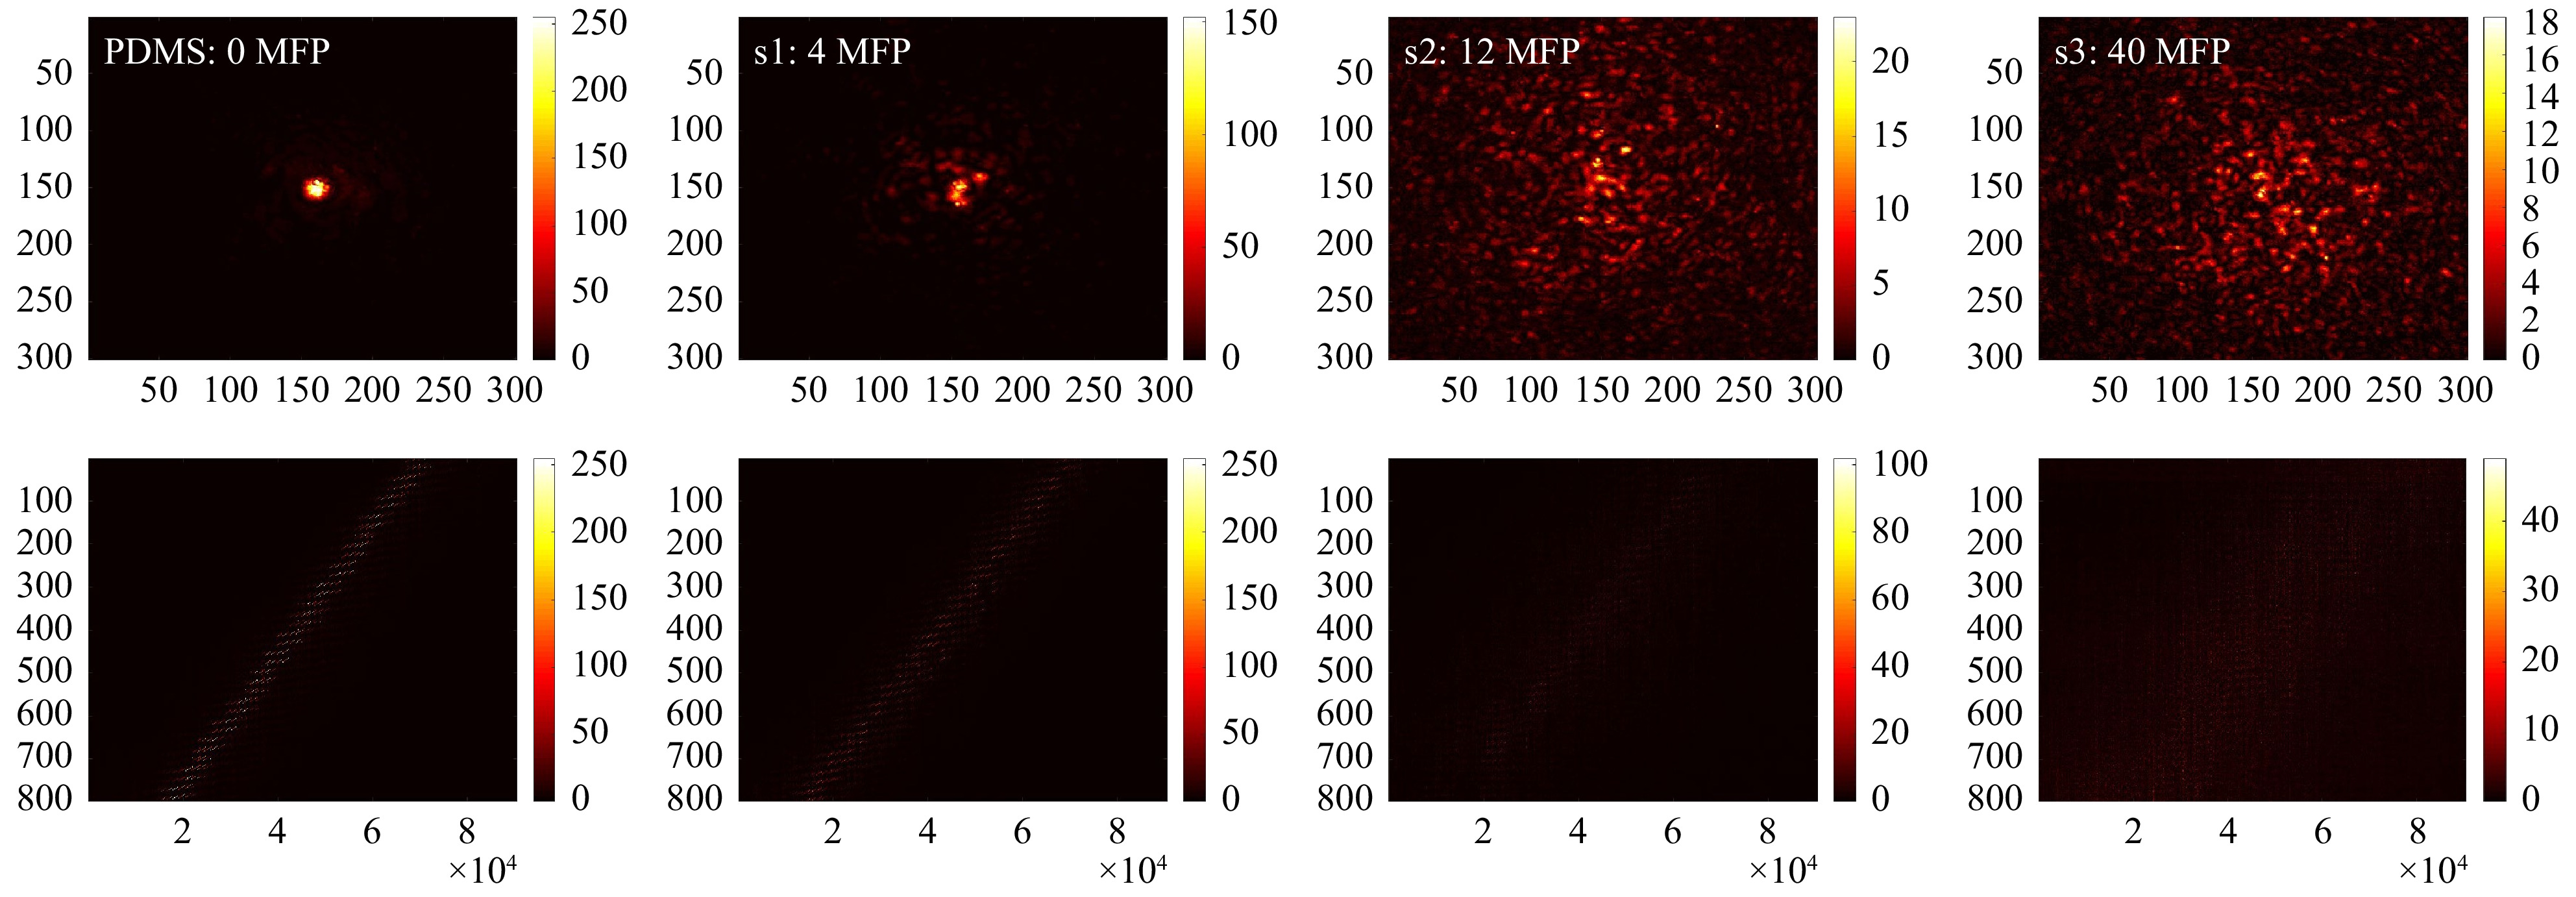
Fig. 9 Measurements on different phantom tissues. Top row (from left to right): exemplary focus visualizations through PDMS (0 MFP), s1 (4 MFP), s2 (12 MFP), and s3 (40 MFP). Bottom row: Corresponding
$ T_{M,\mathrm{focus}} $ .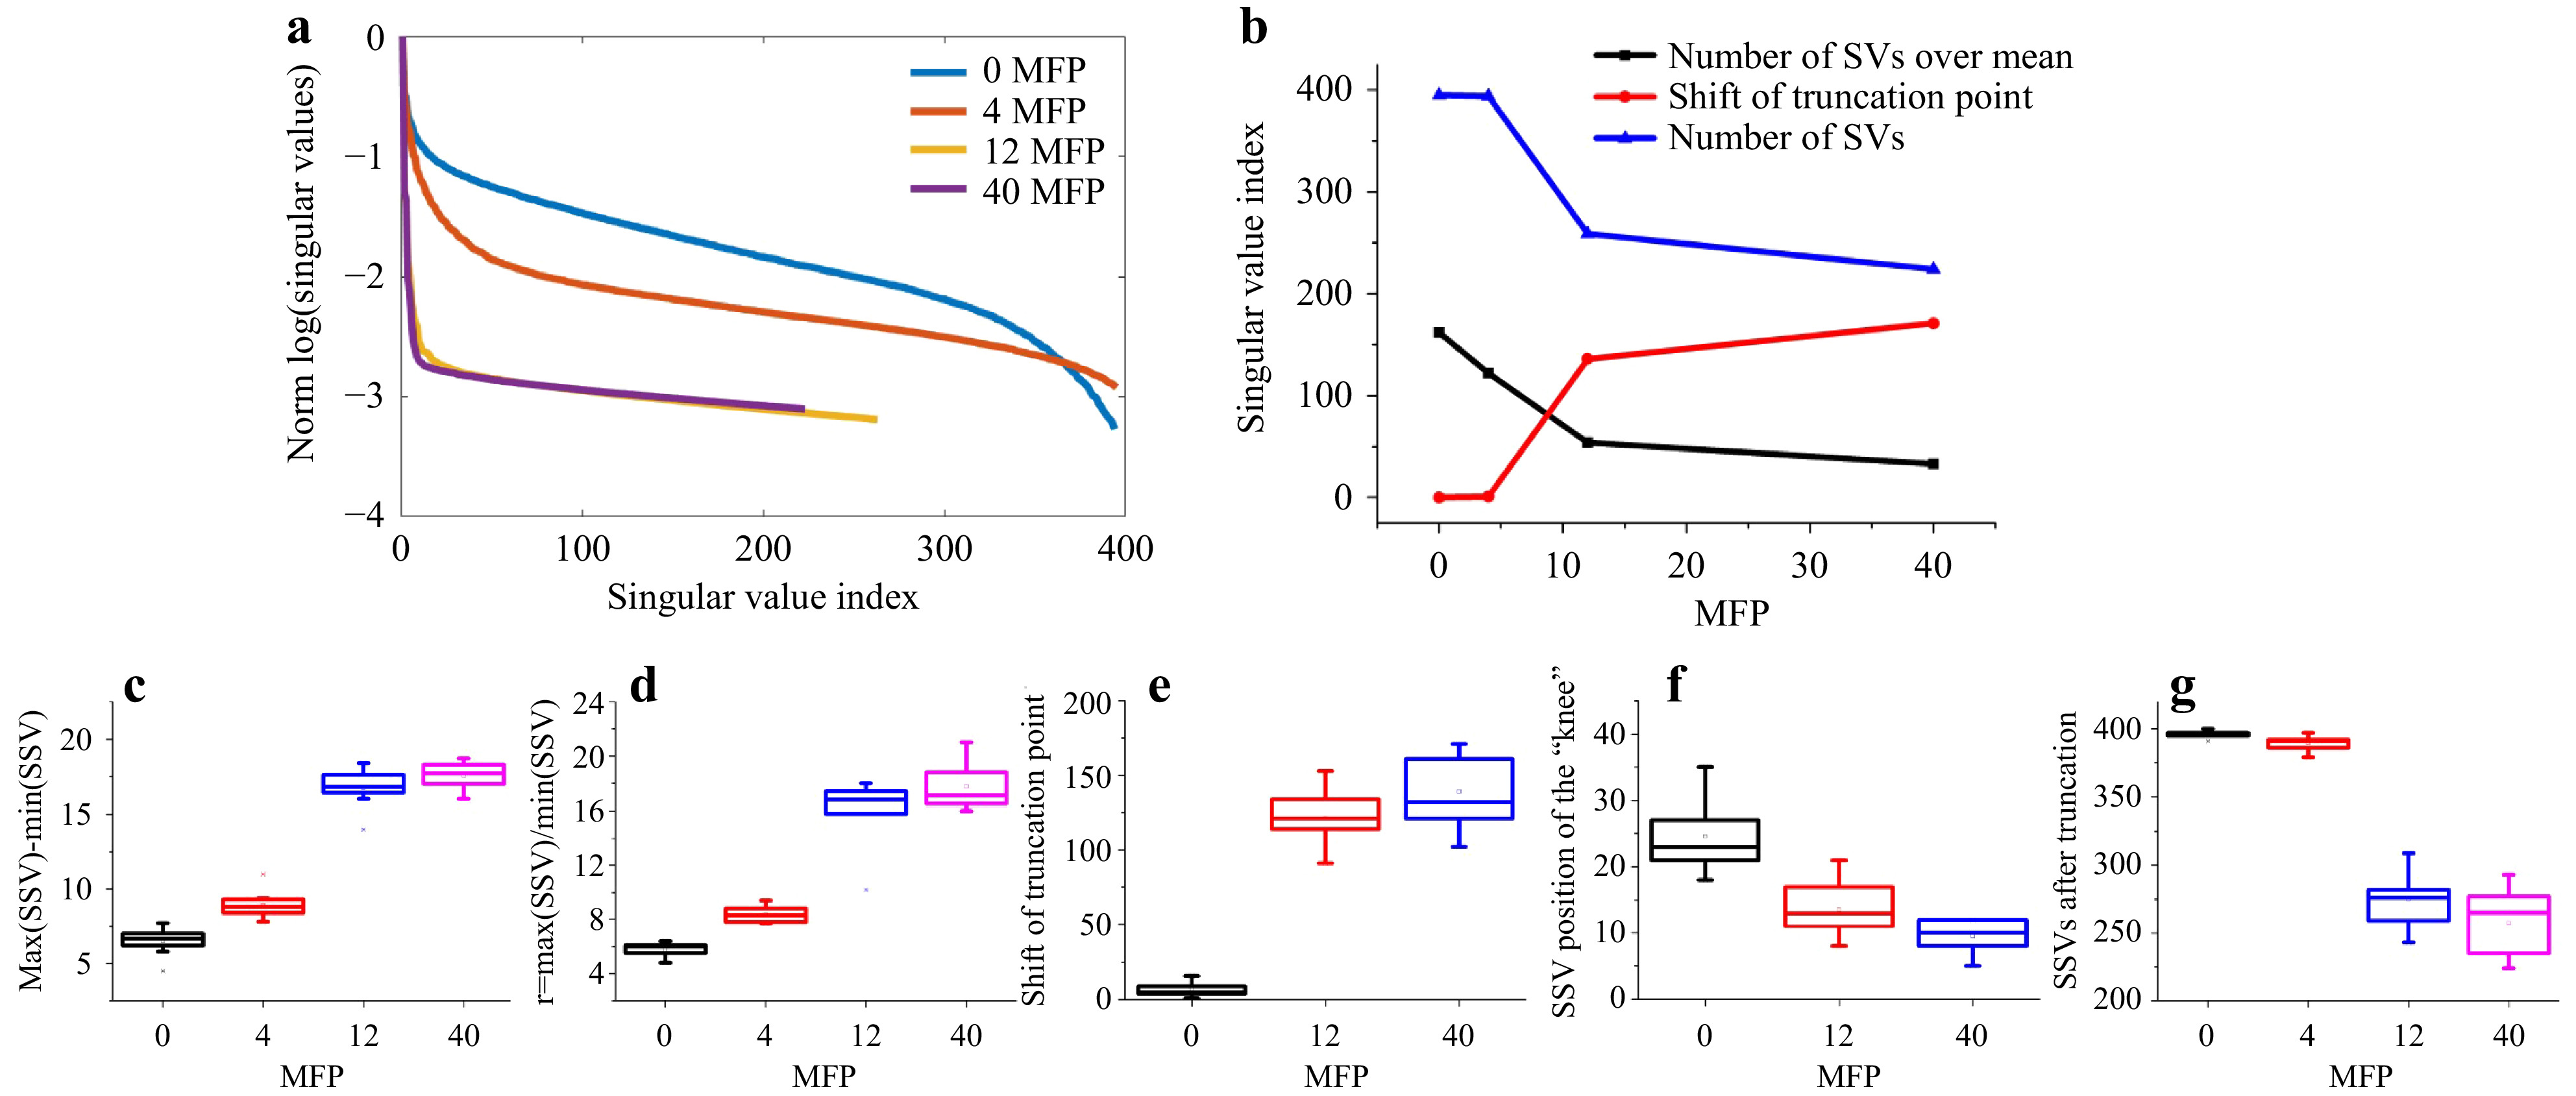
Fig. 10 SVD evaluation of the measurements on different phantom tissues. a SSVs of the four phantom tissues. b The number of SVs after truncation decreases and the truncation point
$ \tau $ shifts to lower index with increased scattering. c The dynamic range$ d=\mathrm{max}(SSV)-\mathrm{min}(SSV) $ and d the ratio$ r={\mathrm{max}(SSV)}/{\mathrm{mean}(SSV)} $ increase with scattering. Both e the truncation point and f the position of the “knee”, that divides low and high spatial frequencies, shift to lower index numbers. g Finally, the remaining signal is spread over a reduced number of SSVs.The measurement on the phantom tissues was repeated at N=9 different lateral positions. As shown in Fig. 10, clear trends with increase of scattering are observable. As the experimental conditions are kept constant, the signal-to-noise-ratio (SNR) decreases with increasing scattering, resulting in a reduction of the overall transmittance, which reduces the mean SSV level. As there are still high SSV values present and the minimum SSV decreases, the dynamic range of the SSV is increased.
These results show that it is possible to distinguish samples with different scattering properties by SVD evaluation. However, a reference is required and the experimental conditions have to be kept constant.
$ \tau $ is strongly dependent on the SNR of the measurement. If, for example, a measurement is repeated for different exposure times, a shift of$ \tau $ to lower index can be observed. The same holds, if the conditions are kept constant, but areas of the sample block (or strongly attenuate) the light propagation. Repeating the measurements on the phantom tissues and adjusting the laser power, to keep the signal levels nearly constant,$ \tau $ does not shift significantly (compare Fig. 11). However, along with sample changes, i.e. increasing scattering and blocking, the characteristic behavior does not change, i.e.$ d $ and$ r $ still increase and the position of the knee shifts, while the pure change of the exposure time leads to decreasing$ d $ and$ r $ .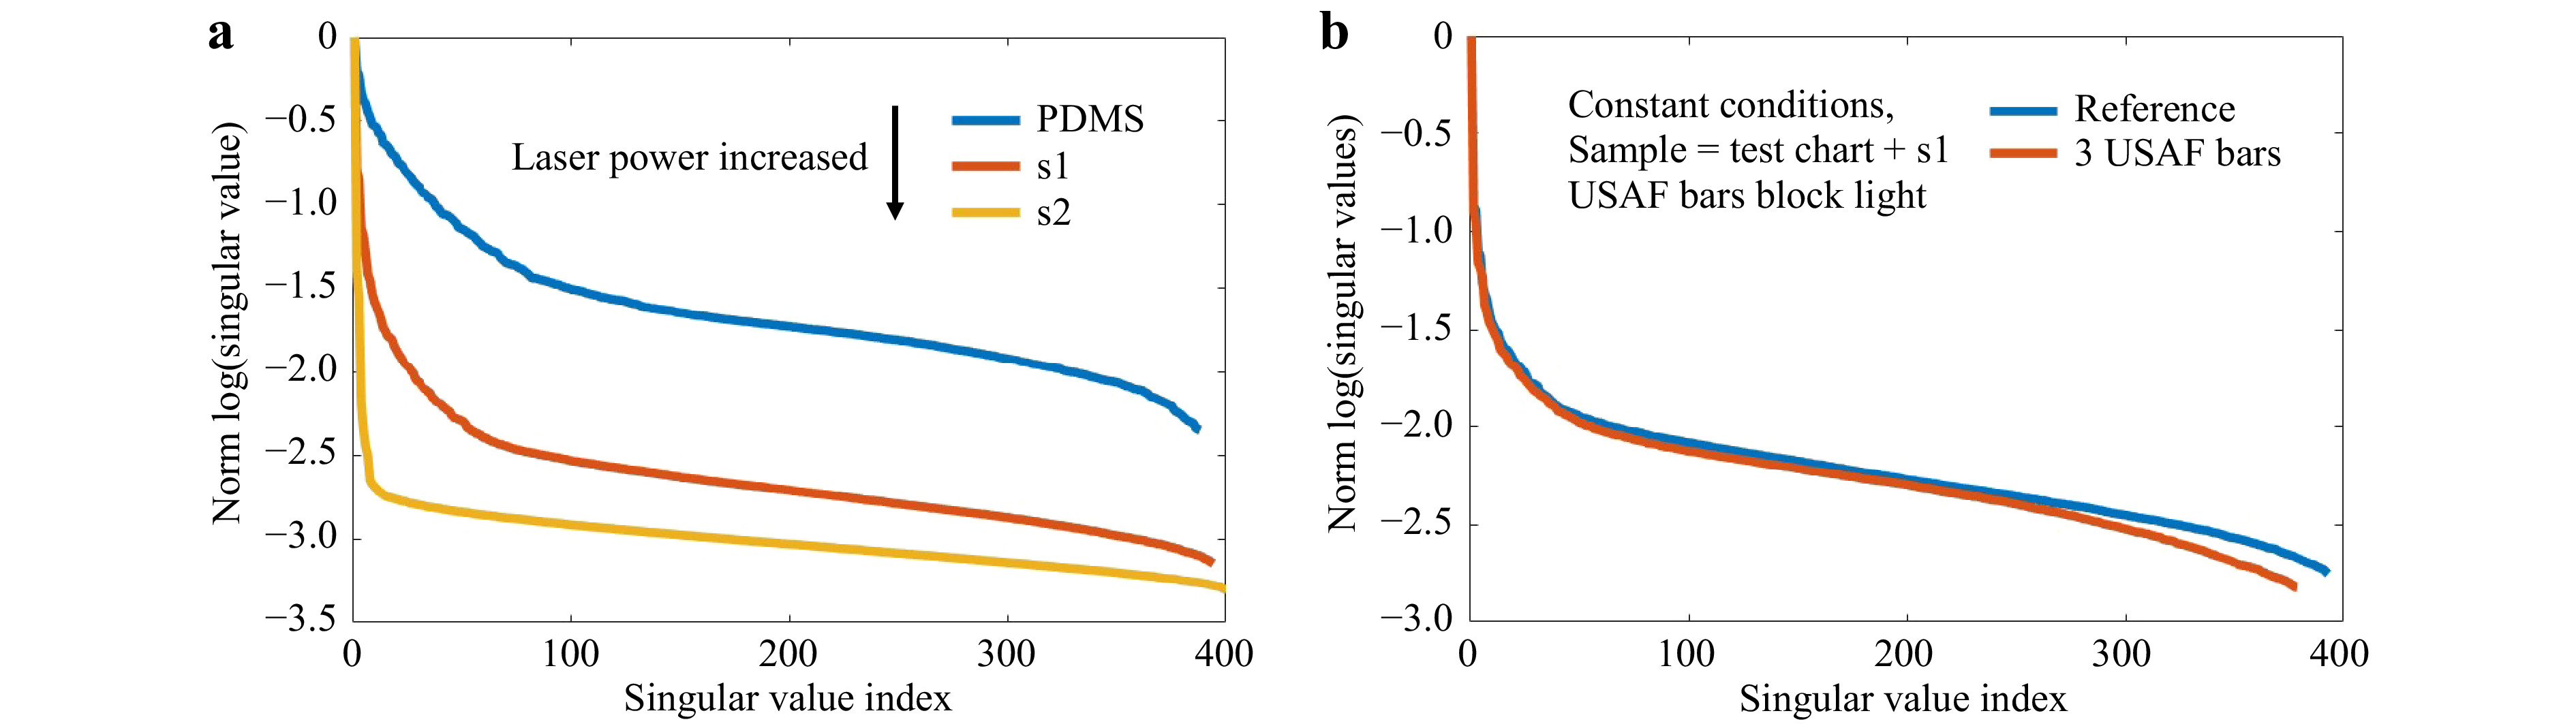
Fig. 11 Crosstalk between varying experimental conditions and SVD evaluation. a The measurement of
$T_{M,\mathrm{focus}}$ on the phantom tissues is repeated. The used laser power is adjusted to keep a constant signal level despite an increase of scattering. This still results in increasing$d$ and$r$ and a shift of the “knee”, however$\tau$ is not shifted. b The phantom tissue s1 is placed on the bars of an USAF test chart. If the focus is scanned across the bars, the light is blocked, mimicking strong absorption or e.g. bone. As a reference, we perform a scan with a laterally shifted test chart. Other conditions are kept constant. Again,$d$ and$r$ increase, while$\tau$ shifts to smaller index.Changing the measurement geometry from focus observation to the classical
$ T_M $ geometry comes along with changes of the SSV as shown in Fig. 12. The dynamic range increases, while the number of SSV decrease. The measurement of$ T_M $ in the classical geometry, strongly depends on the SNR. Hence, it was not possible to keep the laser power and exposure time constant for a comparable measurement series, as the signal strength is strongly decreasing by the transmission through the samples with increasing scattering. However, the same trends are present for observation of the focus through the tissue and the classical$ T_M $ measurement geometry. There is a strong crosstalk between the SVD method and changing experimental conditions. Hence, it is difficult to compare the SVD of different measurement series quantitatively. Surely, the phantom tissue is a special case, where samples are compared which have a highly different dynamic range of scattering. While the reference PDMS sample and the low-scattering s1 show a transition behavior, the samples s2 and s3 with larger scattering coefficient show a different behavior due to the strongly reduced SNR. If just a comparison of s2 and s3 would be targeted, choosing adjusted experimental conditions and a different reference would have a strong impact on the SVDs and would increase the differences. Nevertheless, the results show that indeed it is possible to find differences in the course of SSV.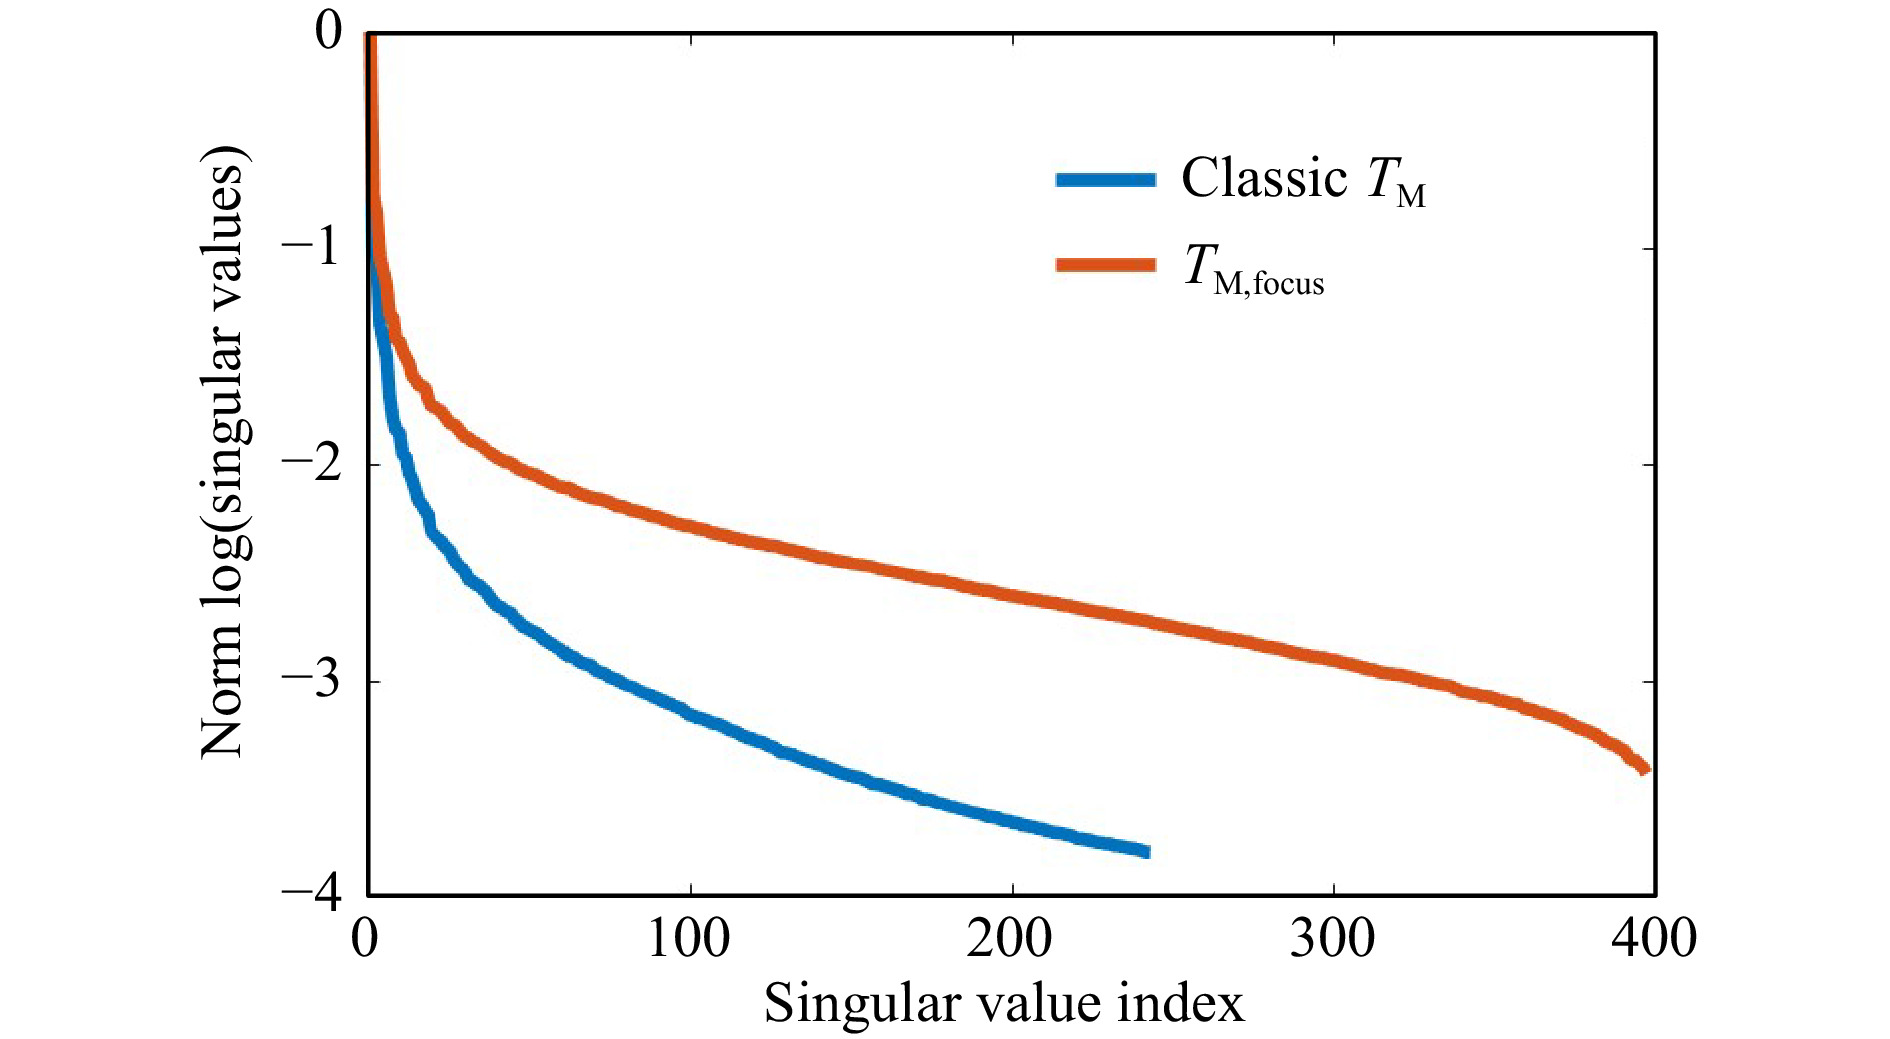
Fig. 12 Influence of changing the measurement geometry from focus observation to classical. Changing the geometry at otherwise constant conditions leads to a reduction of the SNR for each camera acquisition. In the presented example (measurement on s1), this leads to a shift of the truncation point and an increase of the dynamic range. The general behavior remains.
-
Human retinal organoids were generated from hiPSC derived from healthy individuals, and show complete retinal cell generation at about 150 days46. Organoids could be maintained in culture for more than 220 days (Fig. 13a). Histological analysis of immunostained retinal organoid cryosections showed a layered retinal structure based on a cell nuclei distribution (Fig. 13a). The majority of cells are photoreceptor neurons in the most outer retinal layer, indicated by staining for RCVRN (Fig. 13b), whereas other neurons and Müller glia are located in the inner retina as previously shown46. Analysis of retinal sections by TUNEL assay showed rarely any positive cells indicating absence of any major cell death in this organoid system under control conditions (Fig. 13c). To establish a human retinal organoid model reproducing pathologic changes in tissue structure and cell death, we tested the application of the protonophore carbonyl cyanide m-chloro-phenyl-hydrazone (CCCP, 5 μM), which is used to uncouple oxidative phosphorylation, an essential component of cell energy metabolism. CCCP was previously shown to induce apoptosis of photoreceptors from salamanders63, and mitochondrial damage in human retinal ganglion cells derived from hiPSC64. Organoids were treated with CCCP for 11 days in comparison to solvent controls (N = 5 per variable). Microscopic observation of organoids live in culture showed that all CCCP-treated but not control organoids underwent major changes in color and shape (Fig. 13a, d). Histological analysis confirmed this, CCCP caused a loss in layered retinal structure based on nuclei staining, and photoreceptor cells became displaced from the outer layer to the inner retina. Further, some cell nuclei showed a condensed morphology, indicative of cell death, and analysis by TUNEL assay confirmed this. Thus, application of CCCP not only damages isolated retinal cells in cell culture and animals in vivo63,64, but is also sufficient to induce a severe pathology in a 3D complex human retina organoid system providing an efficient experimental pathology model.
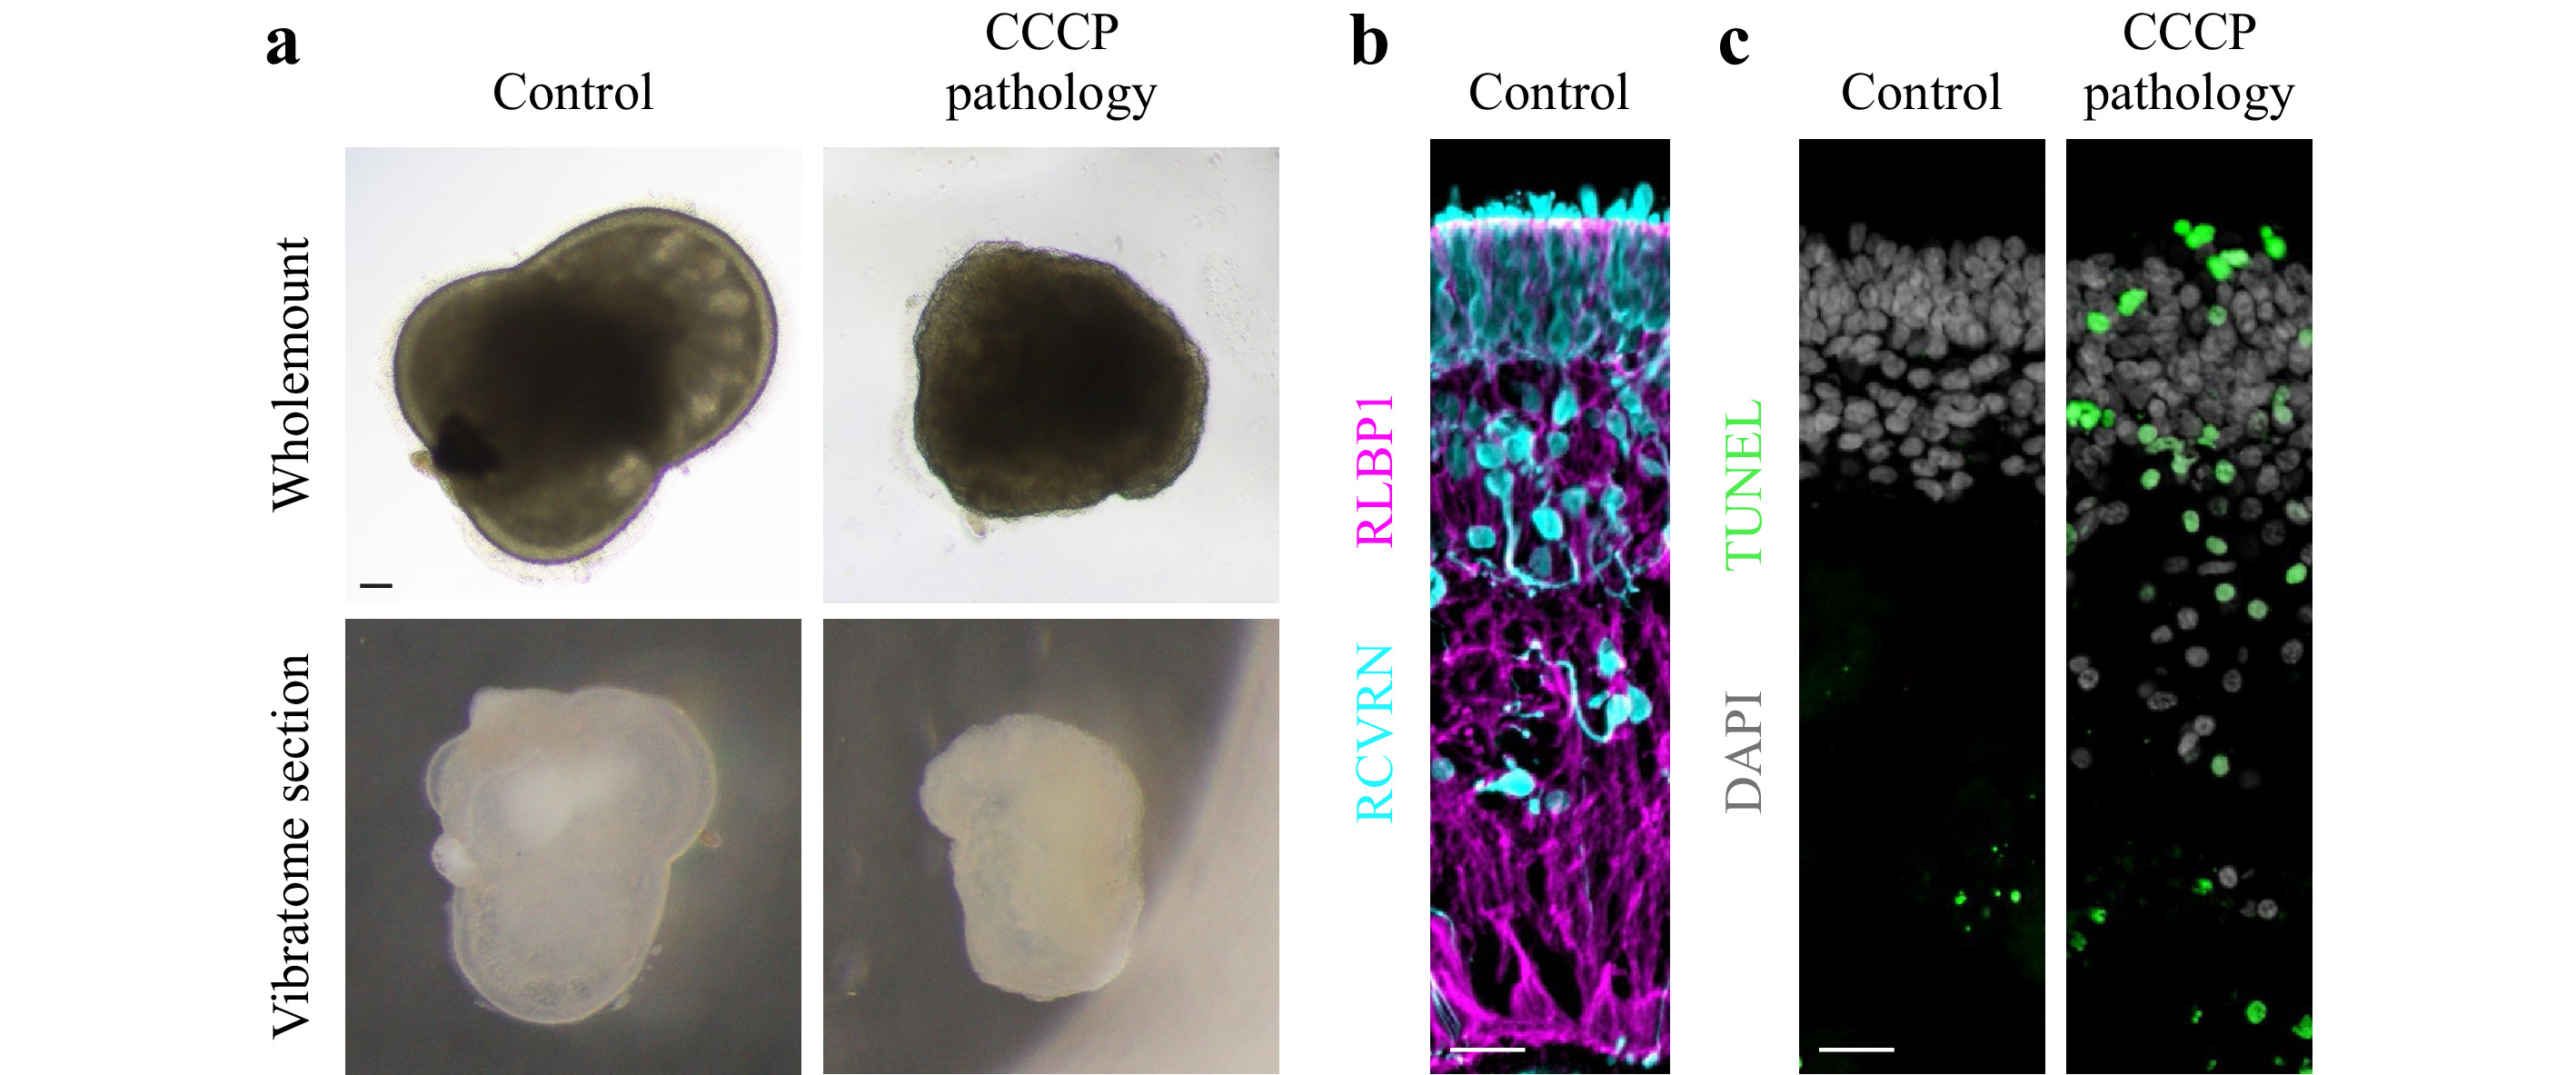
Fig. 13 CCCP induces a severe pathology in human retinal organoids: a Brightfield microscopic images of human retinal organoid shown as wholemount in cell culture either 11 days after challenge with CCCP (pathologic) or without (solvent healthy control) and as cross-sectional vibratome section. In control samples, the outer layer of the retinal epithelium is visible as a bright band around the entire organoid circumference. Upon CCCP-treatment, this epithelium becomes reduced in thickness, and the otherwise smooth epithelial (organoid) surface becomes pathologically uneven, indicating outer retinal degeneration. Scale bar 100 μm. b Healthy human retinal organoids show layered structure: organoid cross-section fluorescently labeled for photoreceptor neurons (RCVRN) located in the most outer retinal layer and Müller glia (RLBP1) spanning the entire retinal epithelium. Scale bar 20 μm. c Degenerating human retinal organoids show structural loss and increased cell death: Human retinal organoid cross-section under control conditions and after CCCP treatment (day 10 of treatment) were green fluorescently labeled by TUNEL assay, which indicates cell death. All cell nuclei are counterstained with DAPI, which shows that control retinas are organized into an outer nuclear layer with densely packed cell nuclei and slightly separated to an inner nuclear layer below with less densely packed cell nuclei. In CCCP treated retina, DAPI also shows that some cell nuclei become small roundish, most of which also are TUNEL positive. Scale bar 20 μm.
-
We prepared tissue slices derived from human retinal organoids (Fig. 13a) in order to investigate whether different anatomical locations in healthy control organoids can be discriminated by
$ T_M $ measurements, and whether there are any differences in comparison to CCCP-induced pathologic organoids. Measurements were performed at four evenly spaced radial positions across the retinal epithelium, spanned from the outer (apical) border of the epithelium up to the presumptive inner (basolateral) epithelial border (Fig. 14a), and applied the classical$ T_M $ geometry for analysis. Exemplary results are shown in Fig. 14b, c. With increasing distance from the outer (apical) retinal surface, the SSV course changed, indicating an increase of scattering, when the assumptions on SSV as described above are considered. For the pathologic organoid, the measurements looked different compared to controls: the SSV course remained at a comparably constant level. In sum, the observation that light-scattering tissue properties increase with greater distance from the healthy retinal surface was consistent for all measurements (Fig. 14f, g). Further, overall the measurements on the pathologic tissues were more variable and showed an increase in scattering compared to controls (Fig. 14f, g).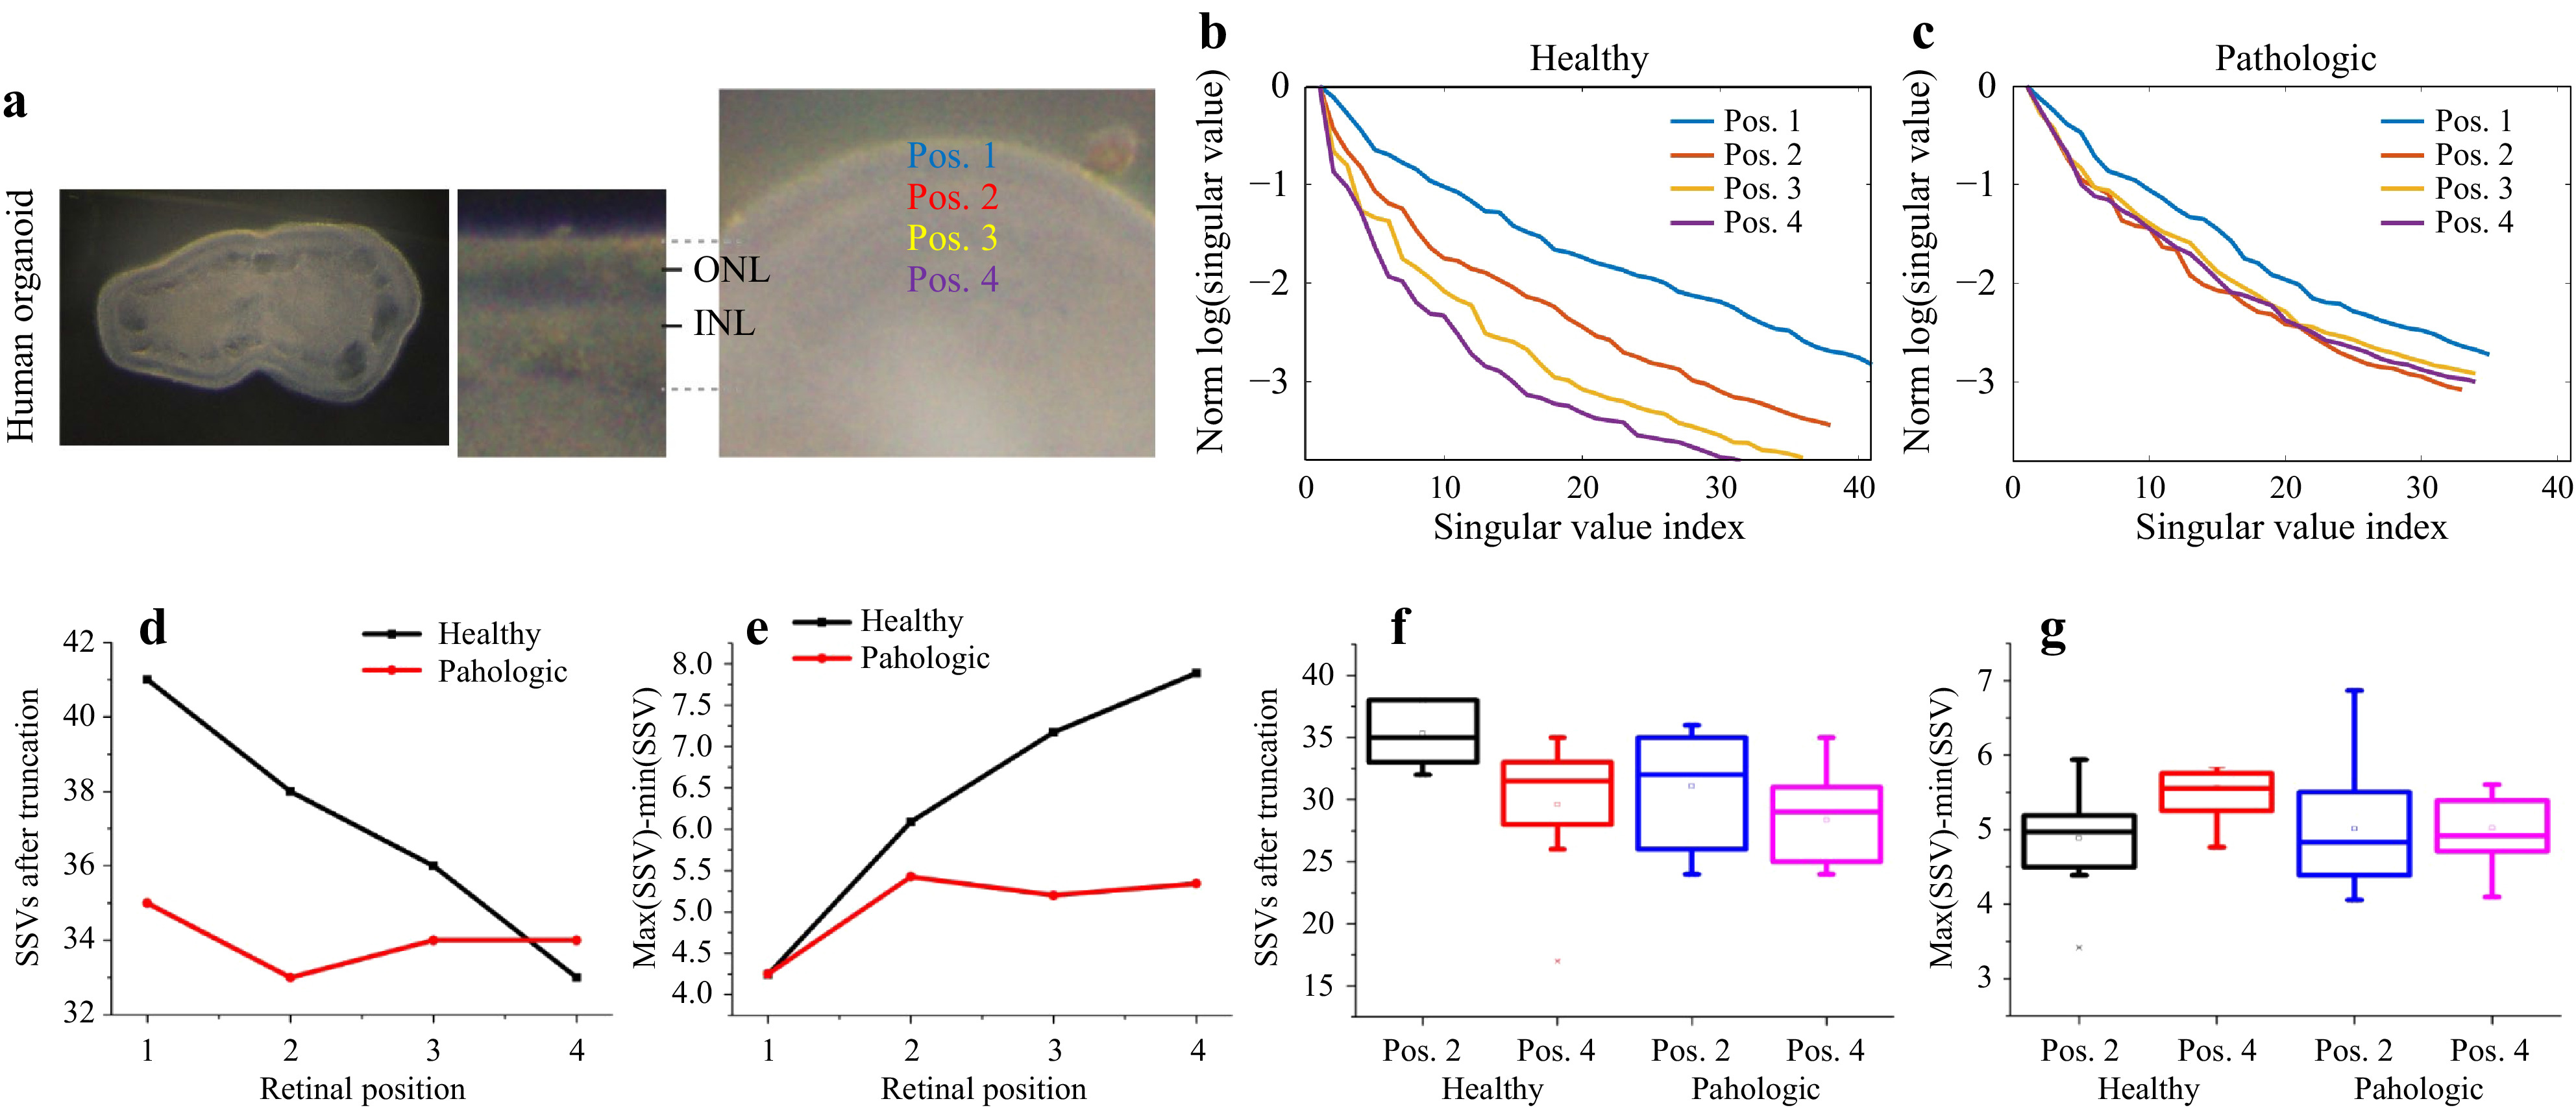
Fig. 14 SVD analysis of
$ T_M $ from human retinal organoids with and without CCCP-induced neurodegeneration. a Locations of the measurement positions. b, c The SSV courses for the healthy and degenerated retinal tissue show clear different behaviour with changing distance from the sample surface. d The truncation point shifts and the remaining signal is spread over a reduced number of SSV, while the e dynamic range increases, which indicates an increase of scattering in healthy tissue with increasing distance from the surface. The pathologic tissue behaves differently, and shows higher scattering in the data, which could have its origin in structural loss. f and g The difference of maximum and minimum SSV (left) and the number of SSVs after truncation (right) show differences between positions 2 and 4.A statistical ANOVA analysis of the differences between the positions Pos2 and Pos4 for healthy and pathologic samples supports these observations (ANOVA at the 0.05 level). The differences between the two positions for the healthy group reach significance levels of
$ p_{\mathrm{SSV,healthy}}=0.015 $ and$ p_{\mathrm{diff, healthy}}=0.049 $ for the two shown metrics. For the pathologic samples, no statistically relevant differences between the two positions are observed, with the significance levels of$ p_\mathrm{{SSV,patho}}=0.12 $ and$ p_{\mathrm{diff,patho}}=0.97 $ . Together, our data indicate that changes in$ T_M $ might reflect specific tissue properties, like cell composition, and changes thereof upon pathology. -
For the first time worldwide, the human organoid retina was examined with digital holographic measurement of the transfer matrix, which is promising for the distinction between healthy and diseased tissue. These studies are crucial for in vitro organoid manufacturing and have potential also for in vivo biomarker monitoring. In our experiments, we measured and observed differences in
$ T_M $ at several different anatomical positions. These differences were lost in organoids treated with CCCP, which induced histopathological changes in retinal layer structure, cell nuclear morphology, and cell death, indicative of retinal degeneration. Since structural landmarks visible by brightfield microscopy were lost upon pathology, the measurement positions might not correlate any more to the same positions like in control tissues. However, since all positions in the pathologic tissue showed rather comparable values, this might not matter. Whether latter changes in$ T_M $ are caused by the redistribution of cells within the retinal epithelium, differences in cell density, or other pathologic changes is still unclear. Taken together, our data indicate that$ T_M $ measurements might discriminate tissue intrinsic properties and pathologic changes thereof. However, evaluation via SVD exhibits significant crosstalk with changing environmental and experimental conditions. Future studies with living retina organoid tissues, retina from healthy and diseased animal models and human donor tissues, as well as healthy and pathologic tissues of other organs, will be useful to confirm and extend our observations.Wavefront shaping using an SLM is a key to acquiring the
$ T_M $ in the basis of scanning focal spots. By using$ 160\times 160=25,600 $ camera pixels, a relatively large number of rows were used for$ T_M $ measurement. Since temporal stability has to be ensured and the SLM is quite slow in practice with$ < {10}~{\rm{Hz}} $ repetition rate, we decide to use underconstrained conditions. This means that less foci are scanned than camera pixels inside the observation window are used. Performing$ T_M $ inversion with underconstrained conditions leads to focus generation through scattering media, albeit with reduced quality compared to a fully defined system. This could also be a possible source of uncertainty in the SVD studies carried out.This can be overcome using real-time capable modulators with higher repetition rate, such as a digital micromirror device65 or binary phase modulators66. Note, that SVD evaluation does not allow identification of local differences in the samples, but can be understood as the extractor of the mean scattering of the scanned area.
The results presented lead to a promising direction towards the development of a technology that could be used to develop new clinical imaging biomarkers, as well as quality controls for organoid production and tissue maintenance in cell culture. However, in the current configuration, optical access to both the input and output of the sample is required when measuring the
$ T_M $ . For in vivo applications or situations where the target region is located inside the scattering medium, the determination of the$ T_M $ is challenging as the output is commonly not accessible. A more relevant practical solution could be to determine the reflection matrix of the scattering medium67–70. Here, recent approaches employ time-resolved reflection matrix determination using coherence gating to address a target-depth inside the scattering medium70. -
The phantoms were prepared freshly. The fabrication of tissue-mimicking phantoms has been explained in detail in60. Briefly, first, the two components of silicone elastomer polydimethylsiloxane (PDMS) (Dow Corning GmbH) were mixed together in quantities of 10:1 parts by volume, a ration of the base PDMS material to the curing agent volumes. Subsequently, glycerol (Sigma-Aldrich GmbH) in 0.5 parts per volume was included carefully by preventing the excessive amounts of air bubbles. The mixture was thoroughly mixed and poured into petri dishes (Henke Sass, Wolf GmbH) with controlled thicknesses. Air bubbles were evacuated from the mixture in a vacuum chamber. The mixture was left at room temperature to solidify for 24 hours.
-
Previously established human induced pluripotent stem cells (hiPSC) lines iPS-5A and CRX-H2B-mCherry46,71,72 were used in this study. hiPSCs were maintained in mTeSR1 medium (Stem Cell Technologies) on Matrigel-coated culture dishes and passaged using ReLeSR (Stem Cell Technologies). Human retinal organoids were differentiated using a protocol adapted from previous publications46. Briefly, hiPSCs were dissociated into small clusters and suspended in Matrigel (growth-factor reduced, BD Bioscience). The almost solid gel was resuspended into small clumps for floating culture in N2B27 medium (1:1 Dulbecco’s Modified Eagle Medium (DMEM)/F12: Neurobasal A medium, 1% B27+vitamin A, 0.5% N2, 1% penicillin /streptomycin, 1% GlutaMAX, and 1 mM 2- mercaptoethanol). The developing neuroepithelial cysts were plated on Matrigel-coated dishes on day 5. Intact cell sheets were detached from the cell culture plates at day 14 using dispase (Stem Cell Technologies) and transferred to floating culture in a B27 supplemented medium (DMEM/F12, 1% B27 without vitamin A, 1% penicillin/streptomycin, 1% GlutaMAX, 1% NEAA, and 0.1% amphotericin B). Developing retinal domains were manually isolated at D25-30 using surgical tweezers (Fine Science Tools, Dumont No. 5). From D25 on, 10% FBS was added to the B27 medium. On D100, medium was changed to N2+FBS. EC23 supplement (0.3 μM) was added from D25 to D120. Half medium was replaced every 2−3 days. All procedures involving hiPSC were performed in accordance with the ethical standards of the institutional and/or national research committee, as well as with the 1964 Helsinki declaration and its later amendments; and approved by the ethical committee at the TU Dresden.
-
For comparison of healthy and degenerating retina, 220 day old human retinal organoids were treated daily with 5 μM CCCP (Tocris, 0452) for 11 days or received solvent control. Half medium was replaced every other day. 5 organoids (N) per treatment were analyzed. All tissues were fixed in 4% PFA for 30 min at room temperature and stored in PBS at 4 °C. Transmission matrix measurements were performed across a radial line with evenly chosen distances from the apical organoid boundary to the inner retina as depicted in Fig. 14.
-
For immunohistochemistry of tissue cryosections, samples were fixed in 4% PFA for 30 min, cryoprotected using a graded series of sucrose solutions (10% for 1 h, 30% for 3 h, 50% overnight), embedded in O.C.T. (Sakura Finetech) and stored at −20 °C. Tissues were sectioned at 12 μm thickness using a cryostar NX70 cryostat (Thermo Scientific), mounted on Superfrost Plus slides (Thermo Scientific) and stored at −80 °C. Sections were washed 10 min in PBS and incubated for 60 min at room temperature in blocking solution (0.5% BSA and 0.3% Triton-X-100 in PBS). Primary antibodies against RCVRN (Recoverin, Millipore AB5585, 1:2500) and RLBP1 (CRALBP, Invitrogen MA1-813, 1:200) diluted in blocking solution were added for 48 h at 4 °C. Tissue was washed in PBS (3x 10 min) before species-specific secondary antibodies conjugated to fluorophores (488, Cy3, 647; Dianova, diluted 1:1000 in blocking solution) were added for 1h at room temperature. Cell nuclei were counterstained with DAPI. For cell death visualization, a TUNEL assay was performed using In Situ Cell Death Detection Kit Fluorescein (Sigma-Aldrich, Roche products) according to the manufacturer’s instructions. Samples were imaged on a widefield microscope equipped with an ApoTome2 (Zeiss). Images were analyzed and optimised by making minor changes to contrast, and cropped in Adobe Photoshop CC and arranged using Adobe Illustrator CC.
-
This work was financially supported by the Funding Programs for DZNE Helmholtz (M.K.); TU Dresden CRTD (M.K.); Bundesministerium für Bildung und Forschung (BMBF) ReSight (01EK1613A), and DFG KA2794/5-1 SPP2127 (M.K.). Furthermore, it was partially supported by DFG Cz55/40-1 and DFG Cz55/42-1. The hiPSC line was kindly provided by Andreas Hermann (DZNE Dresden, Uni Rostock). We thank all MOKALAB and BIOLAS members for their excellent support.


 DownLoad: