


-
An essential problem in interferometry and holography is that when the distances to be measured are larger than the source or illumination wavelength, interferometry and holography may fail to unwrap the correct phase information. This problem arises from the failure in unambiguously determining the interferometric orders with single-wavelength measurement. A key to solve this problem is to employ an extra wavelength to generate a synthetic wavelength in the measurement. This is often referred to as the dual-wavelength technique (DWT) or two-wavelength technique. The concept of utilizing different wavelengths to extend the absolute distance/phase measurement range of using a single wavelength was introduced by Michelson and Benoit in the 1890s1-3. They measured a 1 cm etalon with a Michelson interferometer and four principal colors in cadmium emissions (red, green, blue and violet, with wavelengths of 643.85, 508.58, 479.99 and 467.82 nm, respectively). The excess fractions of interferometric fringes for each wavelength were then calculated based on the known wavelength. This method is also named as the method of excess fractions. The same method, after four decades, found its application in standard measurement for gauge blocks using cadmium light source in the interferometer4-5.
In 1947, Forrester et al. discussed the possibility of experimentally using two nearly the same visible wavelengths to create a beat wavelength that is larger than original ones6. The concept of using two wavelengths in holography was first introduced by Wyant7 as a convenient alternative to test aspheric optical elements. Interferometry is generally the preferred method, because the complete surface is covered in a single measurement, unlike a scanning probe, which measures the contour a cross-section at a time. The major problem in using interferometry for testing a largely deformed aspheric is the large number of fringes in the resulting interferogram. A method of reducing the number of fringes in the interferogram would be to use a longer wavelength light source in the interferometer. However, there were three main disadvantages in using a longer wavelength, nonvisible light source: (a) ordinary refractive elements cannot be tested this way, (b) standard photographic films could not be used to record the interferogram directly, and (c) not being able to see the radiation could cause added experimental difficulty. These problems could be solved by using DWT in holography. DWT together with holography provides a means of using only visible light to obtain an interferogram identical to the one that would be obtained if a longer wavelength were used. Due to the large number of different wavelengths obtainable from commercially available lasers, a wide range of equivalent wavelengths could be obtained using DWT. Around the 1970s and 1980s, this dual-wavelength concept has also been successfully applied to interferometry8-12 and holography13,14.
In recent three decades, DWT has been developed in various directions. Dispersion management can be an annoying issue in dual-wavelength or white-light interferometry. Ideally, the geometric paths in two arms of the interferometer should be the same, however, the imperfection of beam splitters or dispersion nature of the material may introduce unwanted phase accumulations in the interferometer. In other words, the wavelength in the medium which may differ from the laser wavelength can lead to errors in the topography results. Pfortner and Schwider developed a numerical algorithm to compensate the dispersion errors in white-light interferometry15. Another common phenomenon when dealing with different wavelengths is chromatic aberrations. The methods of eliminating chromatic aberrations in DWT have been reported in Refs.16-18. One way to eliminate the chromatic aberration is to convert the aberrations into scaling effect in lateral plane. Nicola et al.16 managed the chromatic aberrations elimination by rescaling the pixel size of digital holograms at reconstruction plane. Another way is by using digital refocusing in dual-wavelength digital holography (DWDH). Since digital holography (DH) can reconstruct the complex wavefront of the object or sample, the wavefront at in-focus or out-of-focus planes can be obtained easily by numerically propagating the wavefront to the target plane. Ferraro et al.18 employed this idea in chromatic aberration compensation. By digital refocusing the out-of-focus optical field (the defocus is introduced by chromatic aberration in using different wavelengths), the optical field can be brought back to the right focal plane. Retrace errors, coming from the mismatch between test ray and reference ray, is an issue in aspherical testing19. Iterative algorithms can be adopted to remove the retrace errors in dual-wavelength aspherical testing20,21. Researchers also tried to go beyond the phase ambiguity limit of the synthetic wavelength in DWT. De Groot reported a method to extend the unambiguous range measurement using DWT in interferometers22. The method first generates a beat fringe pattern and then compares the beat pattern with one of the single wavelength fringe patterns. When the two patterns share a larger period, an extended synthetic wavelength can be obtained, which can be numerical estimated and give rise to a longer absolute range measurement. Further improvements have been done by Falaggis et al.23,24. Also, they developed methods in more general techniques in multi-wavelength modalities23-25. Other developments and improvements in DWT was benefited by the advancement of laser technology. Tunable laser sources together with nonlinear optics26-31 give DWT more degrees of freedom in wavelength choice and free the researchers from aligning an extra laser beam in the optical system. The stability of wavelength is also a nontrivial issue in high precision optical metrology. Monitoring and controlling the wavelength drifts can enhance the performance of DWT32-35. Super-sensitive DWT with the sum of the two phase maps has been proposed36-38, however, unfortunately, ignored by researchers over a few decades. Recently, super-sensitive DWT has drawn researchers’ attention and developments have been reported in Refs.39-43. The super-sensitive DWT will be further discussed in later sections.
A brief review on the historical development of DWT described above shows the technique’s diverse advancements, especially in interferometric techniques. In fact, the DWT is not limited to interferometry and holography. It can also be applied to incoherent techniques, such as fringe projection profilometry (FPP)41, 43-48 or deflectometry49,50. Abundant DWT technique development and implementation has been studied in FPP and a few good review papers have been published41,44-47. Our paper will put less efforts on reviewing the history and early applications of DWT in FPP, but we will still review a recent work on combining super-sensitive DWT with FPP, which has not been included in the review papers mentioned above. Need to mention that FPP can be considered as a category of methods in structured light field51-54. There are also techniques sharing similar concepts with DWT. For instance, the Moiré pattern, which is a beat pattern formed by the superposition of two fringe patterns with different spatial frequencies, can extract phase information of the object with optical projection and numerical reconstructions55-57. The other category is non-interferometric coherent imaging techniques, e.g. coherent diffractive imaging (CDI)58, ptychography59, Fourier ptychography60. DWT has potential in implementing in these imaging methods to boost their performance in 3D topography and phase imaging. The related applications of DWT in coherent imaging techniques and novel optical imaging modalities will also be covered in the selected applications of DWT section of this paper.
Throughout the literature search, we notice that DWT appears as different expressions in research article titles, though the mathematical backgrounds are essentially the same. This sets an obstacle for students or new researchers in this field to read through previous research work or search related papers with keywords. Here we list an alternative keywords involving the DWT to help new researchers and students in this field or intended to work on this technique. The straightforward technical equivalent terms for DWT are two-wavelength holography/interferometry/FPP7,8,10,12,61,62, variable wavelength interferometry9, multiple-wavelength holography/interferometry11,13,29,31, two-color interferometry32, dual-wavelength holography34,40,63-70, two-wavelength phase-metrology43, dual/two-wavelength phase unwrapping71,72, multiwavelength holography17,18,73-76, synthetic wavelength holography/interferometry35,77-84, two/dual-frequency FPP85-87. An important statement should be made here that actually the concept of multi-wavelength techniques is different from DWT. Multi-wavelength technique (MWT) employs a set of wavelengths to form a very large synthetic wavelength, which can achieve phase unwrapping free feature23-25. Some papers titled with “multi-wavelength” related techniques, however, their number of wavelengths in use is two, which still fall in the scope of DWT. MWT and DWT are closely related with similar mathematical framework, but different implementations. Though the review of MWT is not in the scope of this paper, MWT developments deserve researchers’ attention. A few references are cited here for some research advances and reviews on MWT23-25, 41, 88-100. The other category of keywords for DWT is related to the feature or applications of DWT: unambiguous range measurement, absolute distance/height measurement, extended range metrology, large step-height/displacement measurement, extended range contouring9,22,29,34,35,62,101; nonnull aspherical testing, gauge block measurement, the method of excesses fractions4,5,7,19-21,96. All the keywords mentioned above are in the mathematical framework using the phase difference from the phase maps of two wavelengths. This has been extensively studied over the last five decades. The other mathematical framework is to use the sum and the difference of the two phase maps. This methodology can also be considered as DWT and has been reported in 1970s36-38. Unfortunately, it did not draw much attention over a few decades. Recently, this method has found its way in super-sensitive measurement applications39-43.
In this review, we present the principle of DWT with an example in DH and introduce the usage of phase sum in DWT to achieve high sensitivity. Examples of different scales of synthetic wavelengths are discussed with various experimental realizations and applications. DWT in combination of novel coherent imaging techniques is summarized. Then, the performance of DWT and noise sources are analyzed. In the end, we briefly conclude this article and point out the potential future directions of DWT.
-
Here, we introduce the principle of DWT with an example in holographic imaging. Consider an interference between a plane wave and a point source, which is the simplest in-line hologram. The intensity pattern is
$$\begin{split} {I}_{0}\left(x,y:z\right)=&{I}_{a}+{I}_{b}cos\left({k}_{0}\frac{{x}^{2}+{y}^{2}}{2z}\right) \\=&{I}_{a}+{I}_{b}cos\left(\frac{\pi \left({x}^{2}+{y}^{2}\right)}{{\lambda }_{0}z}\right) \end{split} $$ (1) where z is the distance from the point source to the measurement plane, and
$ {k}_{0}=2\pi /{\lambda }_{0} $ is the propagation constant with$ {\lambda }_{0} $ being the wavelength. Assume now, that there are two wavelengths$ {\lambda }_{1,2} $ making this interference pattern, then the respective intensity patterns are$$ {I}_{1,2}\left(x,y:z\right)={I}_{a}+{I}_{b}cos\left(\frac{{k}_{1,2}\left({x}^{2}+{y}^{2}\right)}{2z}\right) $$ (2) where
$ {k}_{1,2}=2\pi /{\lambda }_{1,2} $ and the constants$ {I}_{a},{I}_{b} $ have been left unchanged for the two wavelengths for simplicity. If these two intensity patterns are added, the sum of the cosines yields$$\begin{split}& cos\left(\frac{{k}_{1}\left({x}^{2}+{y}^{2}\right)}{2z}\right)+cos\left(\frac{{k}_{2}\left({x}^{2}+{y}^{2}\right)}{2z}\right)\\=&2cos\left(\frac{\left({k}_{1}+{k}_{2}\right)\left({x}^{2}+{y}^{2}\right)}{2z}\right)cos\left(\frac{\left({k}_{1}-{k}_{2}\right)\left({x}^{2}+{y}^{2}\right)}{2z}\right) \end{split}$$ (3) The addition and subtraction of the propagation constants can be recast in the form
$ {k}_{1}\pm {k}_{2}= 2\pi ({{\lambda }_{2}\pm {\lambda }_{1}})/({{\lambda }_{1}{\lambda }_{2}}) $ . Of relevance here is the second term, expressible as$ cos\left({\pi \left({x}^{2}+{y}^{2}\right)}/({\Lambda z})\right) $ , where$$ \Lambda =\frac{{\lambda }_{1}{\lambda }_{2}}{{\lambda }_{2}-{\lambda }_{1}} $$ (4) In other words, it is as if the interference pattern is now being recorded by a wavelength which is neither
$ {\lambda }_{1} $ nor$ {\lambda }_{2} $ , but a synthetic or artificially created wavelength Λ, which, typically, is expected to be much larger than$ {\lambda }_{1,2} $ . The resulting advantage is that there are far less number of Newton’s rings.In the first demonstration of dual-wavelength holography (DWH), the fringe pattern obtained from light passing through an optical element such as a lens (i.e., a phase object) under test, using a wavelength
$ {\lambda }_{1} $ in an interferometer such as the Mach-Zehnder type as shown in Fig. 1, was photographed. This photographic recording of the fringe pattern (hologram) was then developed and replaced in the interferometer in the exact position it occupied during exposure, and it was illuminated with the fringe pattern obtained by testing the optical element using a different wavelength$ {\lambda }_{2} $ . The moiré pattern obtained is identical to the interferogram that would have been obtained if the optical element were tested using a synthetic wavelength Λ as defined in Eq. 4. A simple way to see this is to note that if the first hologram is “read” using the interfering waves from the second wavelength, note that$ cos\left({{k}_{1}\left({x}^{2}+{y}^{2}\right)}/({2z})\right) $ multiplied by the diverging wave from the point source$ exp\left(-j{k}_{2}{\left({x}^{2}+{y}^{2}\right)}/({2z})\right) $ contains a term$ exp\left(j{({k}_{1}-k}_{2})({{x}^{2}+{y}^{2}})/({2z})\right) $ , where j denotes the square root of -1 in engineering convention. The intensity pattern comprising the interferogram contains$ cos\left({({k}_{1}-k}_{2})({{x}^{2}+{y}^{2}})/({2z})\right) $ , which is similar to the second term on the RHS of Eq. 3, and therefore can be expressed in terms of the synthetic wavelength given in Eq. 4.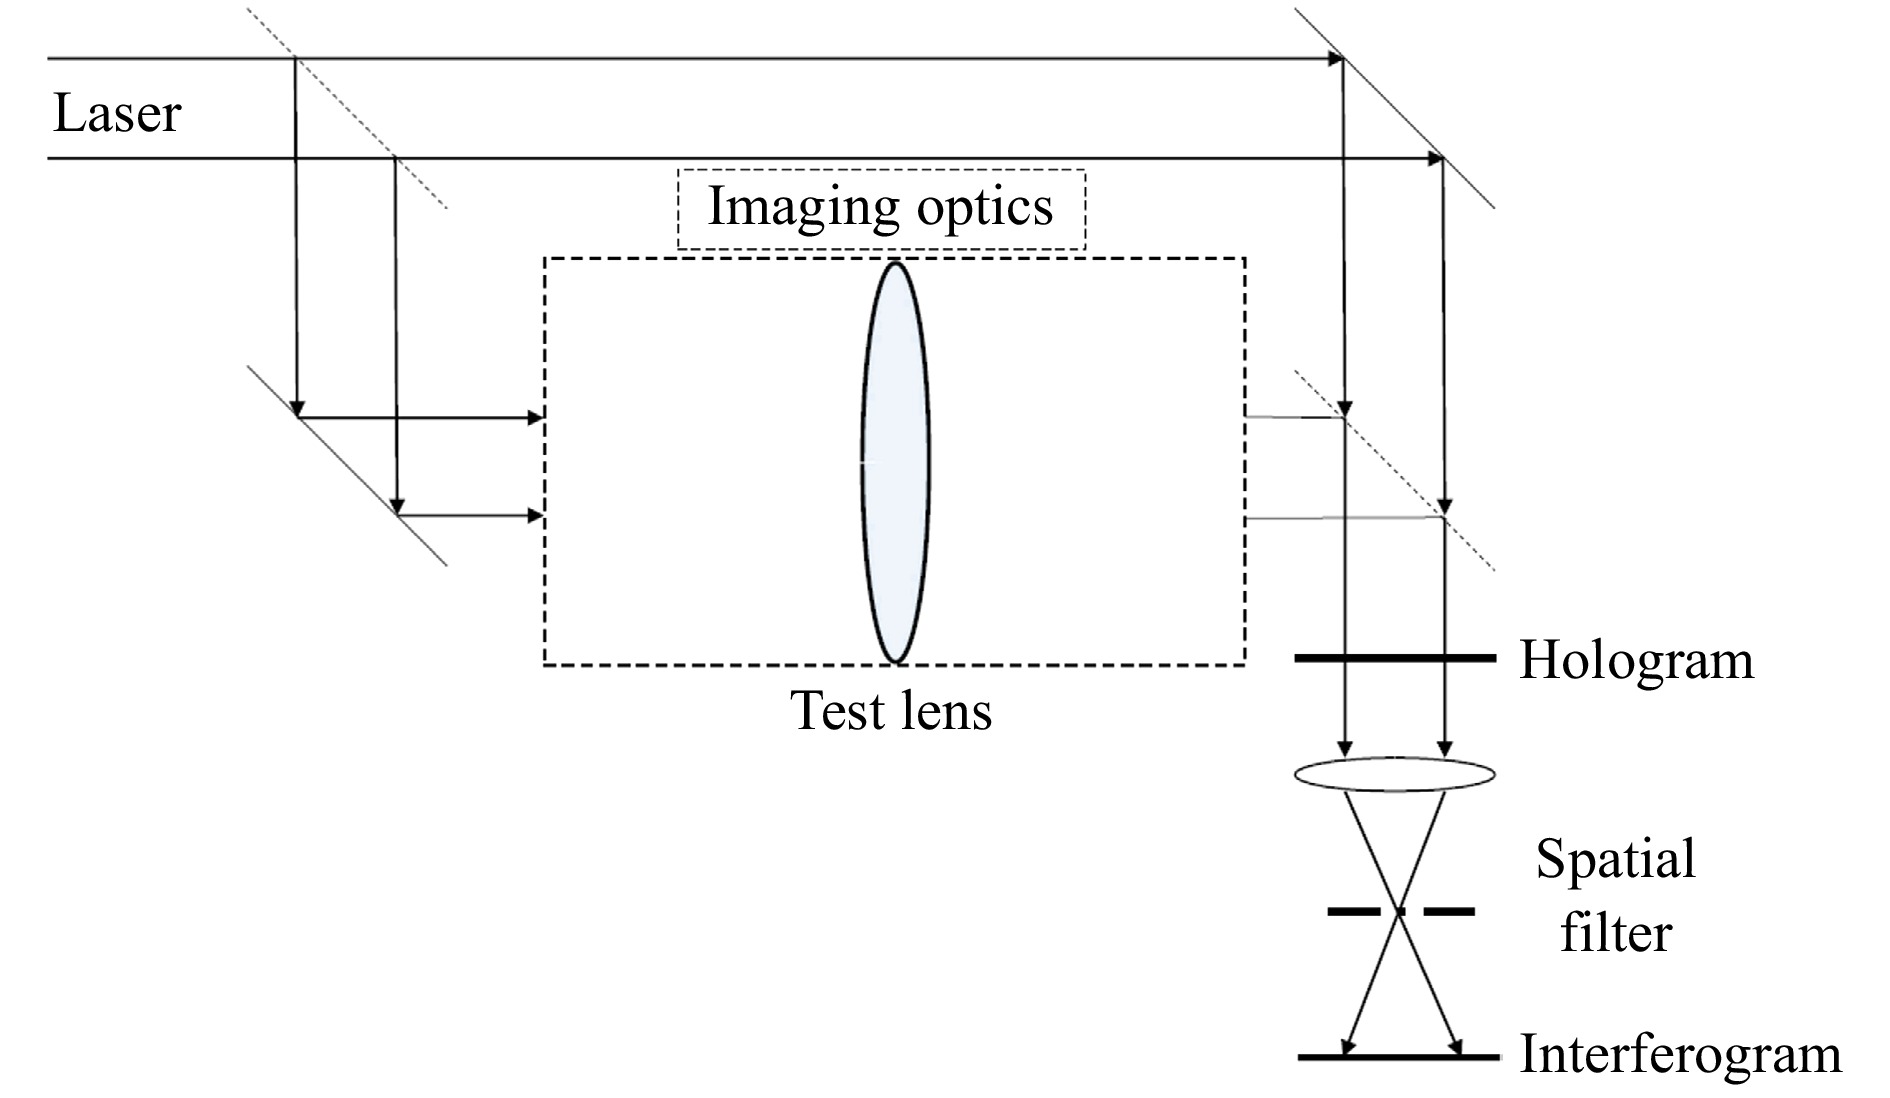
Fig. 1 Mach-Zehnder configuration for hologram recording using wavelength
$ {\lambda }_{1} $ , followed by reconstruction using wavelength$ {\lambda }_{2} $ , yielding the interferogram or moire pattern generated using the synthetic wavelength Λ. This schematic is adapted from the original figure in Wyant7.DWH involves finding the difference between a fringe pattern recorded at one instant of time and a fringe pattern existing at some later instant of time. If the two fringe patterns are different for reasons other than wavelength change, e.g., air turbulence, incorrect results result. The effect of air turbulence can be reduced by recording the two interferograms resulting from the two wavelengths simultaneously. When this interferogram (hologram) is illuminated with a plane wave, spatially filtered, and reimaged, one obtains an interferogram identical to that obtained using the first method of DWH described above. Since both fringe patterns are recorded simultaneously, and dispersion is small, air turbulence is essentially the same as if a long wavelength light source were used in the interferometer.
With the advent of digital recording, DWH could be modified so that two holograms are either simultaneously or sequentially recorded using wavelengths
$ {\lambda }_{1,2} $ , followed by numerically processing the phase data after reconstruction. The methodology of DH is slightly different from conventional holography. While in analog holography the interference pattern is recorded on a film and developed, in DH the intensity is recorded in a digital camera sensor. The hologram is numerically reconstructed using the laws of Fresnel propagation (or back-propagation), depending on whether the virtual or real image is being reconstructed.Consider the hologram of a point source (see Eq. 1), which is slightly modified to take into account any angle that may be introduced between the reference and the object:
$$ h(x,y){\propto I}_{0}\left(x,y:z\right)={I}_{a}+{I}_{b}cos\left({k}_{0}\frac{{x}^{2}+{y}^{2}}{2z}\right)cos\left(Kx\right) $$ (5) where
$ K={k}_{0}sin\theta $ , with θ representing the angle in the$ x-z $ plane between the reference and the object waves. If this is “illuminated” by a plane wave and back propagated, the optical field after a distance$ –z $ of back-propagation can be expressed as$$\begin{split} \Gamma\left(x,y\right)=&h\left(x,y\right)* g\left(x,y;-z\right)\propto h\left(x,y\right)\\&*\exp\left(+j{k}_{0}\frac{{x}^{2}+{y}^{2}}{2z}\right) \end{split}$$ (6) where
$ g\left(x,y;z\right) $ is the impulse response for propagation, * denotes the convolution operator. This convolution can be computed with a single Fourier transform method:$$ \begin{split} {\rm{\Gamma }}\left( {x,y} \right) &= \mathop \int\int \limits_{ - \infty }^\infty h\left( {x',y'} \right)exp \left( { + j{k_0}\frac{{{{\left( {x - x'} \right)}^2} + {{\left( {y - y'} \right)}^2}}}{{2z}}} \right)dx'dy'\\ \propto & \mathop \int\int \limits_{ - \infty }^\infty h\left( {x',y'} \right)exp \left( {j{k_0}\frac{{{{x'}^2} + {{y'}^2}}}{{2z}}} \right)\\&exp \left( {j\left( {\frac{{{k_0}}}{z}} \right)\left( {xx' + yy'} \right)} \right)dx'dy'\\ =& {F_{x,y}}{\left. {\left[ {h\left( {x',y'} \right)exp \left( {j{k_0}\frac{{{{x'}^2} + {{y'}^2}}}{{2z}}} \right)} \right]} \right|_{{k_{x,y}} = {k_0}\left( {x,y} \right)/z}} \end{split}$$ (7) In Eq. 7,
$ {F}_{x,y} $ is the Fourier transform operator. For the simple hologram function stated above, it can be shown that after propagating a distance$ –z $ , one of the terms in$ h\left(x,y\right) $ will yield the (virtual) image of the point source, with the other terms corresponding to the dc (zeroth order) and the defocused (real or twin) image of the object. If there is an angle between the reference and the object while recording the hologram, the different components will be spatially separated. Alternatively,$ h\left(x,y\right) $ can be Fourier transformed, filtered around the spatial frequency K, and centered before back-propagation; this removes the dc (zeroth-order) and the twin-image components.From the reconstructed complex field
$ \Gamma \left(x,y\right) $ in Eq. 7, the intensity and phase of the object can be obtained using$$ I\left(x,y\right)={\left|\Gamma \left(x,y\right)\right|}^{2} $$ (8) $$ \phi \left(x,y\right)=arctan\left(\frac{Im\left[\Gamma \left(x,y\right)\right]}{Re\left[\Gamma \left(x,y\right)\right]}\right) $$ (9) The phase
$ \phi (x,y) $ is proportional to the object surface feature height and the illumination angle θ, theoretically,$ 0\le \theta < 90^{\circ} $ 102,103. The reconstructed phase in Eq. 9 is a 2D map of the wrapped phase, exhibiting modulo$ 2\pi $ fringe spacing of the wavelength λ, which must be unwrapped to yield the absolute phase. The resulting unwrapped phase is the phase profile for a phase object, and plotted in either 2D or 3D. A commonly used unwrapping technique is the phase-unwrapping max-flow/min-cut (PUMA) algorithm, based on the graph-cut technique developed by Bioucas-Dias and Valadao104. The PUMA algorithm is commonly chosen for its ready availability and good performance in the presence of significant phase noise.Just as light passing through a phase object acquires additional phase, light reflected off a contoured object also acquires phase, and can be similarly studied, as shown schematically in Fig. 2. Holographic topography is the measurement of surface shape by means of holographic recording and reconstruction. When recorded digitally, the phase contours may be post-processed to yield the object height up to 1/100th of the synthetic wavelength105. Digital holographic topography is a more general 2D case of holographic profilometry, where only a cross-section of a given topography can be extracted, and avoids the need for scanning.
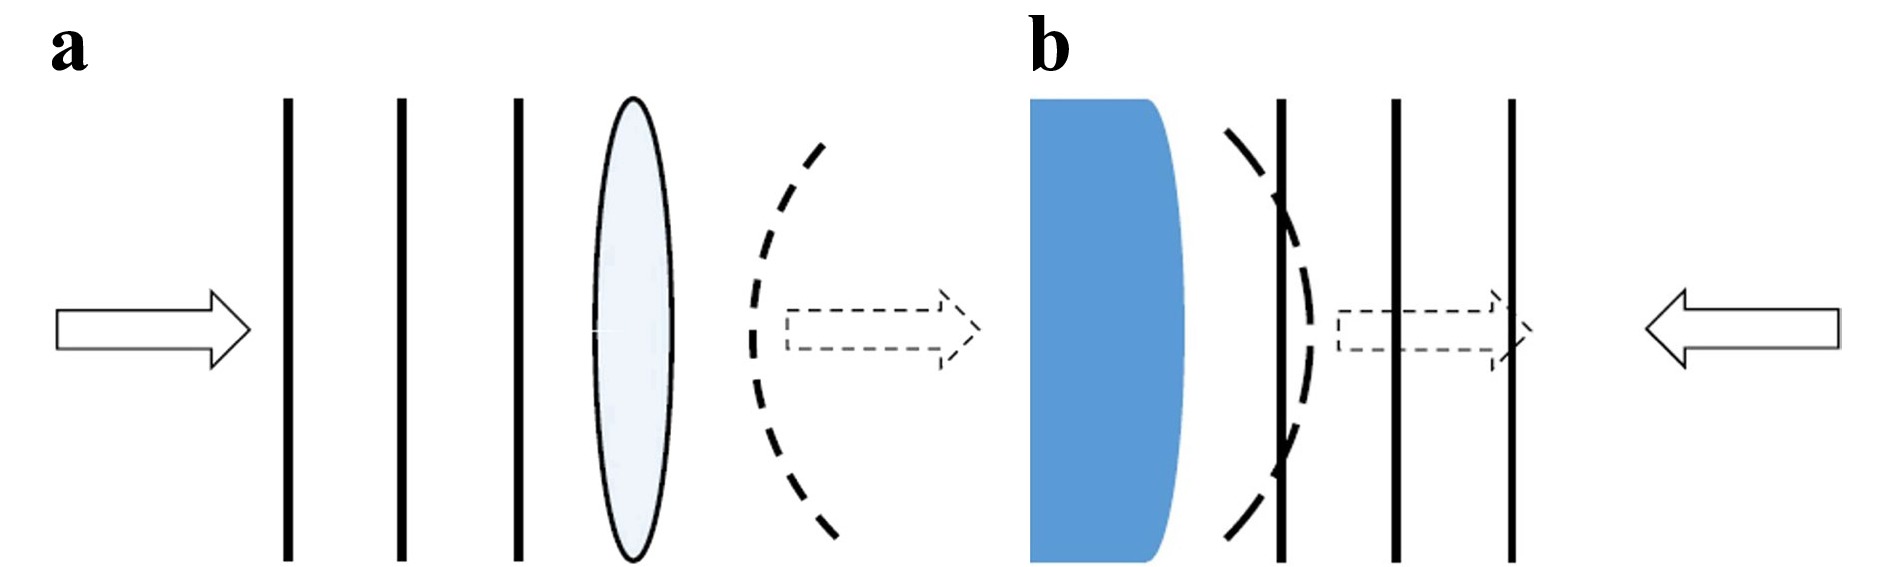
Fig. 2 Schematic showing that light transmitted through a phase object as in a or reflected from a surface as in b acquire phase profiles, characteristic of the refractive index profile or shape of the phase object as in a or the topography of the surface as in b, respectively.
DWDH has been explored extensively to quantify surface topography and displacement measurements for both fixed and time-varying objects30,63,74,102,103,105. By choosing different wavelengths, unambiguous phase unwrapping can be achieved to resolve different scales of depth jumps. Typically, the difference between the two wavelengths,
$ \Delta \lambda =\left|{\lambda }_{2}-{\lambda }_{1}\right| $ , is of the order of$ 10-50\;{{nm}} $ , which yields synthetic wavelengths Λ of approximately$ 30-10\;\mu m $ , respectively. Under the assumption that topographic resolution is of the order of 1/100 of Λ, this allows feature heights of the order of$ 1-3\;{{\mu m}} $ to be resolved reasonably well63. However, considerable work has also been performed using much longer synthetic wavelengths to measure mm- or even cm-scale features106. Proper choice of$ {\lambda }_{1},{\lambda }_{2} $ , such that$ {\lambda }_{1}~{\lambda }_{2} $ , yields very long synthetic wavelengths. For instance, using acousto-optics and RF frequency of ~1 GHz, synthetic wavelengths in the order of tens of cm can be achieved using a 514 nm laser source78.For large height variations, typically tens to hundreds of wavelengths, the height variation corresponds to several multiples of
$ 2\pi $ of phase. Due to the$ arctan $ function used in the phase reconstruction process (Eq. 9), the phase information is wrapped in the modulo of 2π, which creates a 2π-ambiguity when unwrapping the phase. This limits the maximum absolute distance measurement along axial direction within$ {\lambda }/{2n} $ , where λ is the wavelength and n is the refractive index. Large height variation situations can be improved by using the DWT by carefully selecting two different wavelengths, using them to record and reconstruct holograms separately, and generating a synthetic wavelength to reconstruct the combined hologram. The synthetic wavelength is usually much larger than the optical wavelength, thus, it can resolve larger height variations. The single wavelength technique (SWT) is not an ideal solution to very small height variations105,107. For small variations, use of the DWT together with fringe subdivision, nanometer scale axial resolution is possible64.The essence of DWDH is to have two wavelengths accumulating different phases in a given distance and generate the beat pattern from phase difference. The principles governing DWDH and synthetic wavelength generation73,105,107 are briefly summarized here. DWDH requires two holograms to be recorded at two separate wavelengths,
$ {\lambda }_{1,2} $ , and the phase difference to be subsequently computed. For$ {\lambda }_{1} $ , the phase difference of two adjacent fringes can be expressed as$ {\phi }_{1}=({2\pi }/{{\lambda }_{1}})\Delta d $ , where$ \Delta d $ is axial height separation. Need to mention that the illumination angle and geometry of interferometer have been taken into consideration in$ \Delta d $ . Similarly, for$ {\lambda }_{2} $ ,$ {\phi }_{2}=({2\pi }/{{\lambda }_{2}})\Delta d $ . The phase difference can be expressed as the height variation multiplied by a synthetic wavenumber K corresponding to a synthetic wavelength Λ:$$ {\phi }_{1}-{\phi }_{2}=\frac{2\pi }{\dfrac{{\lambda }_{1}{\lambda }_{2}}{{\lambda }_{1}-{\lambda }_{2}}}\Delta d=\frac{2\pi }{\Lambda }\Delta d $$ (10) Thus, the synthetic wavelength originates from the phase accumulation of coherent light wave, which is dependent on the wavelength or the longitudinal spatial frequency of the light source. With a given height jump, the phase accumulated by different wavelengths are different. The subtraction of the two phases yields a beat frequency or equivalently a beat (or synthetic) wavelength that can extend the axial measurement range.
Typically, two holograms for two different wavelengths are required to be captured sequentially or by two cameras. The two holograms are reconstructed separately to get two complex fields of the object at the reconstruction plane. Note that due to different wavelengths used in the holograms, a pixel mismatch problem exists. To calculate the phase difference map for synthetic requires a pixel-to-pixel subtraction. The mismatch comes from the wavelength dependence of the pixel size in the reconstruction plane103,
$$ \Delta {x}_{{r}_{i}}=\frac{{\lambda }_{i}\Delta d}{N\Delta x}i=1,2 $$ (11) where
$ \Delta {x}_{{r}_{i}} $ is the reconstruction pixel size, N is the number of the pixels along x-axis,$ \Delta x $ is the pixel pitch of the camera, i is the index of the wavelengths. The reconstruction pixel size is linearly related to the wavelengths. In Eq. 11, the height$ \Delta d $ and the pixel pitch cannot be changed for a fixed system. To achieve pixel mismatch correction, in other words,$ \Delta {x}_{{r}_{1}}=\Delta {x}_{{r}_{2}} $ ; the only way is to increase or decrease the number of pixels. A typical way to match the pixels is zero-padding the longer wavelength hologram before reconstruction; and after reconstruction, zero-padding the shorter wavelength hologram or cropping the longer wavelength hologram16,78. The padsize is the number of zero elements to be added symmetrically to each edge of the hologram, rounded to the nearest integer value, and is given by$$ {\rm{padsize}}=round\left[\frac{N}{2}\left(\frac{{\lambda }_{1}}{{\lambda }_{2}}-1\right)\right] $$ (12) assuming
$ {\lambda }_{1} > {\lambda }_{2} $ . After pixel matching, the two phase maps are pixel-wise subtracted according to the recipe:$$ \Delta {\rm{\Phi }}=\left\{\begin{array}{l}{\phi }_{1}-{\phi }_{2}\quad if\quad {\phi }_{1} > {\phi }_{2}\\ {\phi }_{1}-{\phi }_{2}+2\pi\quad if \quad {\phi }_{1}\le {\phi }_{2}\end{array}\right. $$ (13) The phase difference map
$ \Delta {\rm{\Phi }} $ is equivalent to the phase reconstructed from a hologram recorded by the synthetic wavelength. Then upon phase unwrapping and phase-to-height conversion ($ \Delta d={\Delta {\rm{\Phi }}}/{2\pi }{\rm{\Lambda}} $ ), the 3D topography of the surface can be deduced.The principle shown above is simple and straightforward. This is to give readers, especially for those who beginning research in this field, a general idea of how to implement DWT in an application. Note that the zero padding is needed to match the scaling effect from different wavelengths or for chromatic aberration compensation. There are also many other techniques or methods in DWDH reconstruction, such as transfer function approach102, Shen-Wang convolution method108, chirp Fourier transform109, etc. These methods still need “zero-padding” due to sampling requirement of fast Fourier transform algorithm. However, this is different from the zero-padding mentioned in Eq. 12. Also, the holographic imaging is only one of the methods which can implement DWT. These methods including interferometry, CDI, ptychography, Fourier ptychography, FPP, will be introduced in the next section of this paper.
It is worth mentioning that phase-shifting techniques are also commonly adopted in DWDH110,111. By modulating the reference path with several constant phase shifts, a phase-shifting algorithm can be applied to retrieve the phases of static objects and remove the twin image, zeroth-order components, with trade-off in extra captures of holograms or interferograms.
The other direction of DWT is to use the sum of two phase maps. The sum of the phase map, similarly can generate a wavelength
$ {{\rm{\Lambda}}}_{+}={{\lambda }_{1}{\lambda }_{2}}/({{\lambda }_{1}+{\lambda }_{2}}) $ smaller than each of the wavelengths. Noted that when$ {\lambda }_{1}\approx {\lambda }_{2} $ , the$ {{\rm{\Lambda}}}_{+}\approx {{\lambda }_{1}}/{2} $ . Together with the synthetic wavelengths generated from the phase difference (Eq. 4),$ {{\rm{\Lambda}}}_{+} $ can be used to retrieve the phase with high accuracy or low noise performance, in the meantime, still can achieve the extended height/phase measurement43. To retrieve the phase, a two-sensitivity temporal phase-unwrapping technique has been developed112. The essence of the algorithm lies in the formula:$$ {{\tilde \phi}}_{S}=G{{\tilde \phi}}_{D}+W\left[{\phi }_{S}-G{{\tilde \phi}}_{D}\right] $$ (14) where
$ \left\{{\phi }_{D},{\phi }_{S}-G{{\tilde \phi}}_{D}\right\}\in \left(-\pi ,\pi \right]; $ $ {{\tilde \phi}}_{S} $ and$ {{\tilde \phi}}_{D} $ are unwrapped phases of phase sum and phase difference wavelengths ($ {{\rm{\Lambda}}}_{+},{\rm{\Lambda}} $ ), respectively;$ G={{\rm{\Lambda}}}/{{{\rm{\Lambda}}}_{+}} $ ;$ {\phi }_{S} $ is the wrapped phase of the phase sum wavelength;$ W\left[x\right]={\rm{arg}}\left\{{e}^{jx}\right\} $ is a wrapping function. From Eq. 14, the unwrapped phase can be obtained. Need to mention that even though the technique is named as a phase unwrapping technique, the phase map resulting from Eq. 14 may still need extra phase unwrapping step, when the phase/height jump is larger than the synthetic wavelength Λ. Despite this, the two-sensitivity temporal phase-unwrapping technique can possibly achieve a better signal-to-noise ratio (SNR) than the traditional phase difference mathematical framework. There is a SNR gain of$ {G}^{2} $ between phase sum and phase difference43. -
The abundant choice of wavelengths in the visible range from laser sources has facilitated a wide range of synthetic wavelengths. In 1984, Cheng and Wyant used Argon-ion and He-Ne lasers to create synthetic wavelengths from 6.45 to 28.5
$ \mu m $ in phase shifting interferometry12. Abeywickrema et al. applied dual-wavelength technique to the 3D topography for fingerprints75. Fingerprints were preserved by depositing 1000-nm-thick columnar thin films (CTFs) of chalcogenide glass of nominal composition$ {\rm{Ge}}_{28}{\rm{Sb}}_{12}{\rm{Se}}_{60} $ . Argon ion laser with wavelengths 514.5 nm and 457.9 nm are used to generate a synthetic wavelength of 4.16$ \mu m $ . With this synthetic wavelength the level-3 feature (pores on the ridges of the fingerprints) can be resolved with a depth around 1-2$ \mu m $ , as shown in Fig. 3. This work reported both transmission and reflection mode setups. The transmission mode is achieved by a Mach-Zehnder interferometer; while the reflection mode is designed with a Michelson-type interferometer75. Gass et al. used a He-Ne laser and a ND:YAG laser with wavelengths of 632.8 nm and 532 nm, respectively113. The 3.3 μm synthetic wavelength is used to reconstruct the 3D topography of reflective resolution targets and spherical mirrors. The same wavelengths from a He-Ne laser and a diode-pumped solid state laser are adopted in common-path digital holographic microscopy65. The wrapped phase map corresponding to the synthetic wavelength has sparser fringes than single wavelength case for ablated pits and grooves specimens (Fig. 4). This can help reduce the computational efforts in the phase unwrapping process. The above examples discussed are using dual wavelengths to generate a micron scale synthetic wavelength.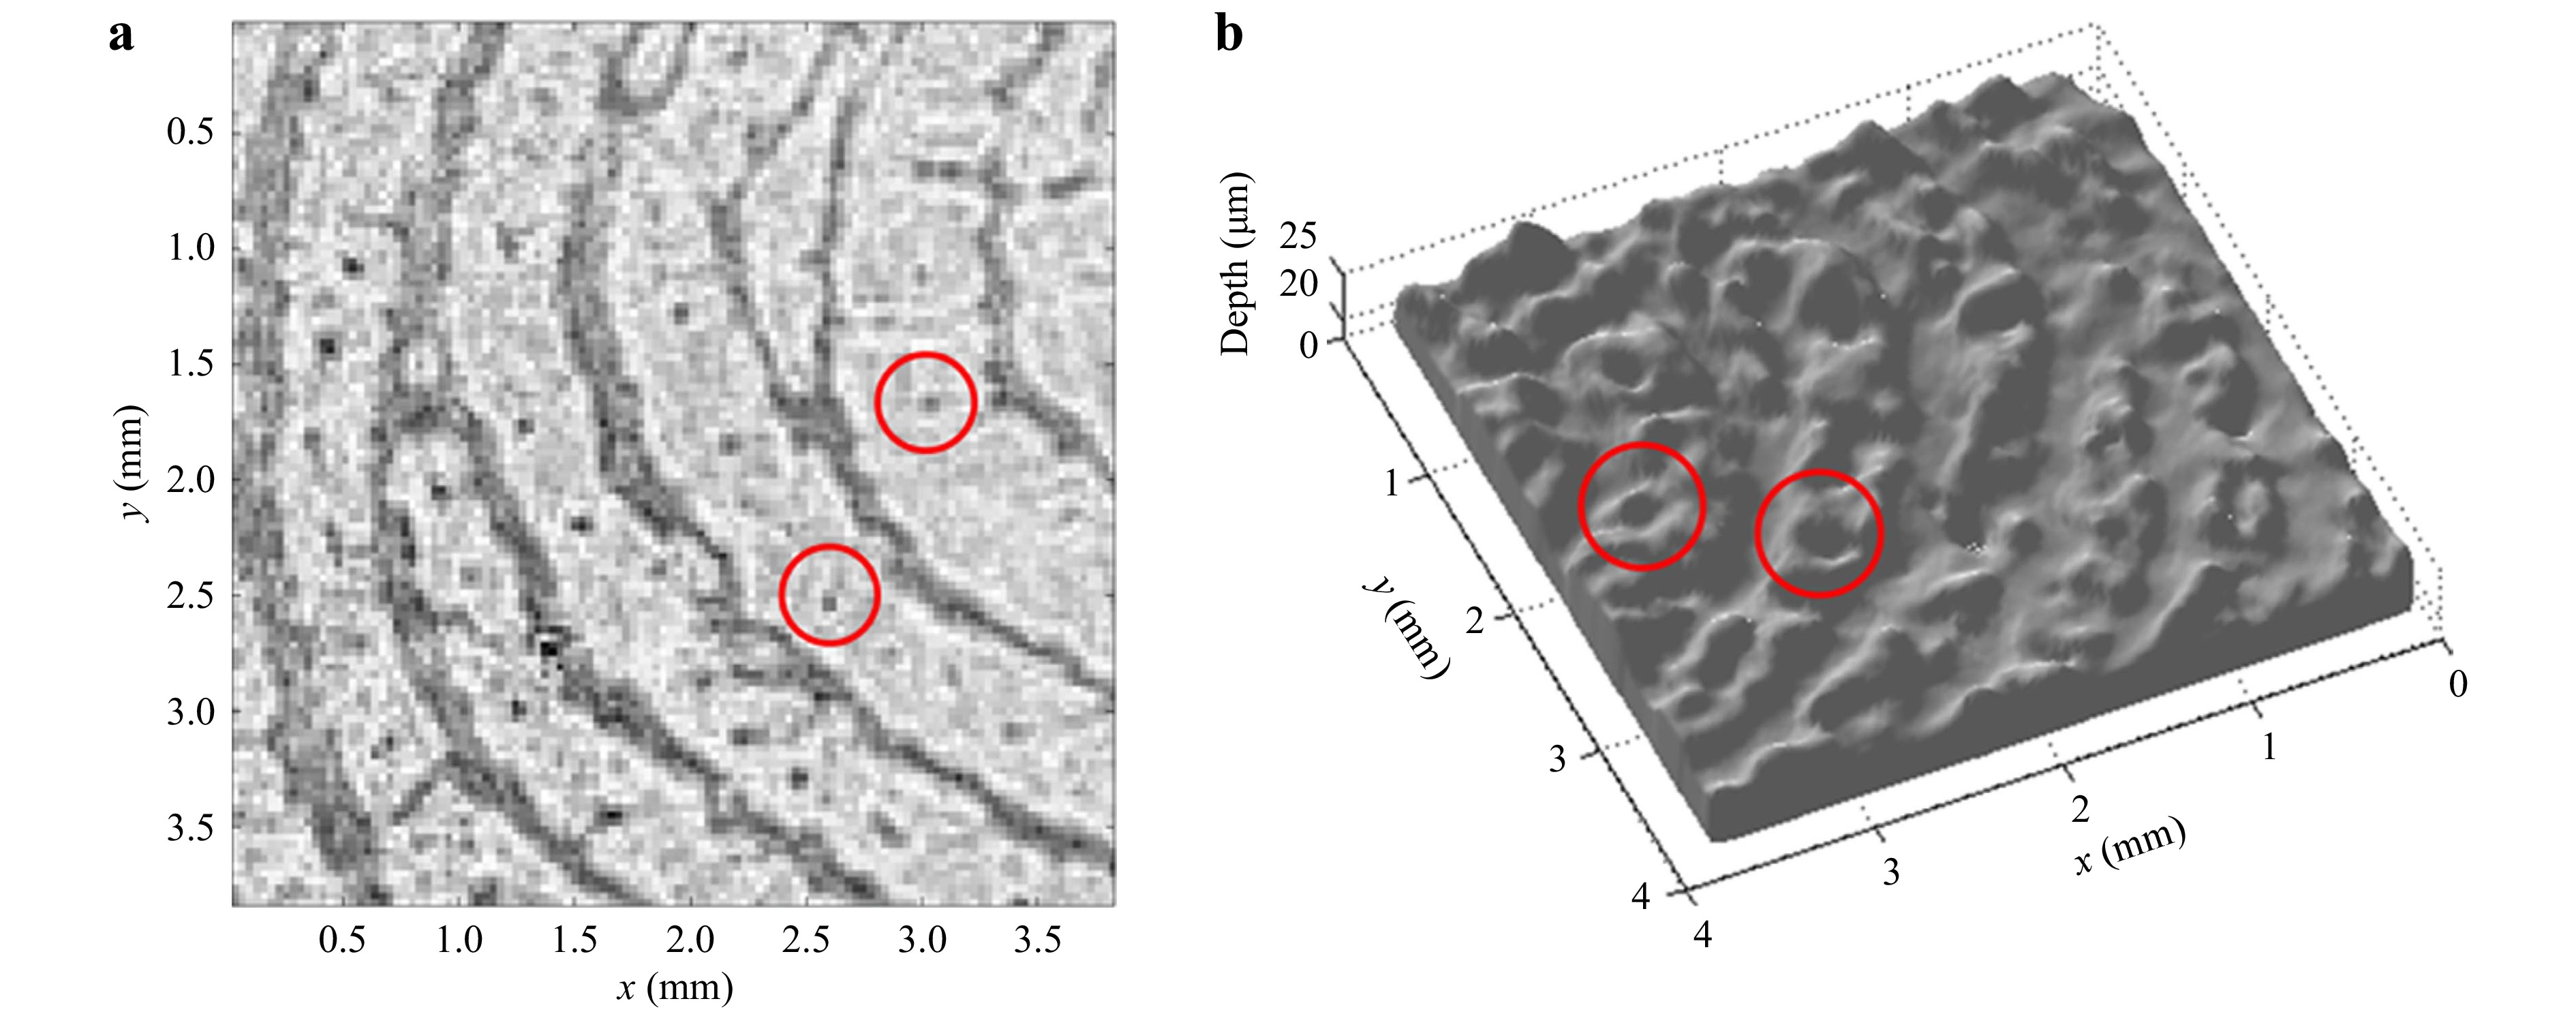
Fig. 3 a Reconstructed amplitude
$ \left|{{E}_{\lambda }}_{1}\left(x,y\right)\right| $ , at wavelength$ {\lambda }_{1} = $ 514.5 nm of a CTF developed fingerprint on a blackened glass slide and b topogram of the CTF-developed fingerprint. The red circles identify level-3 details (pores). The hologram was recorded at a recording distance d = 40 cm using the Michelson geometry in the reflection mode (Fig. 7 in ref. 75).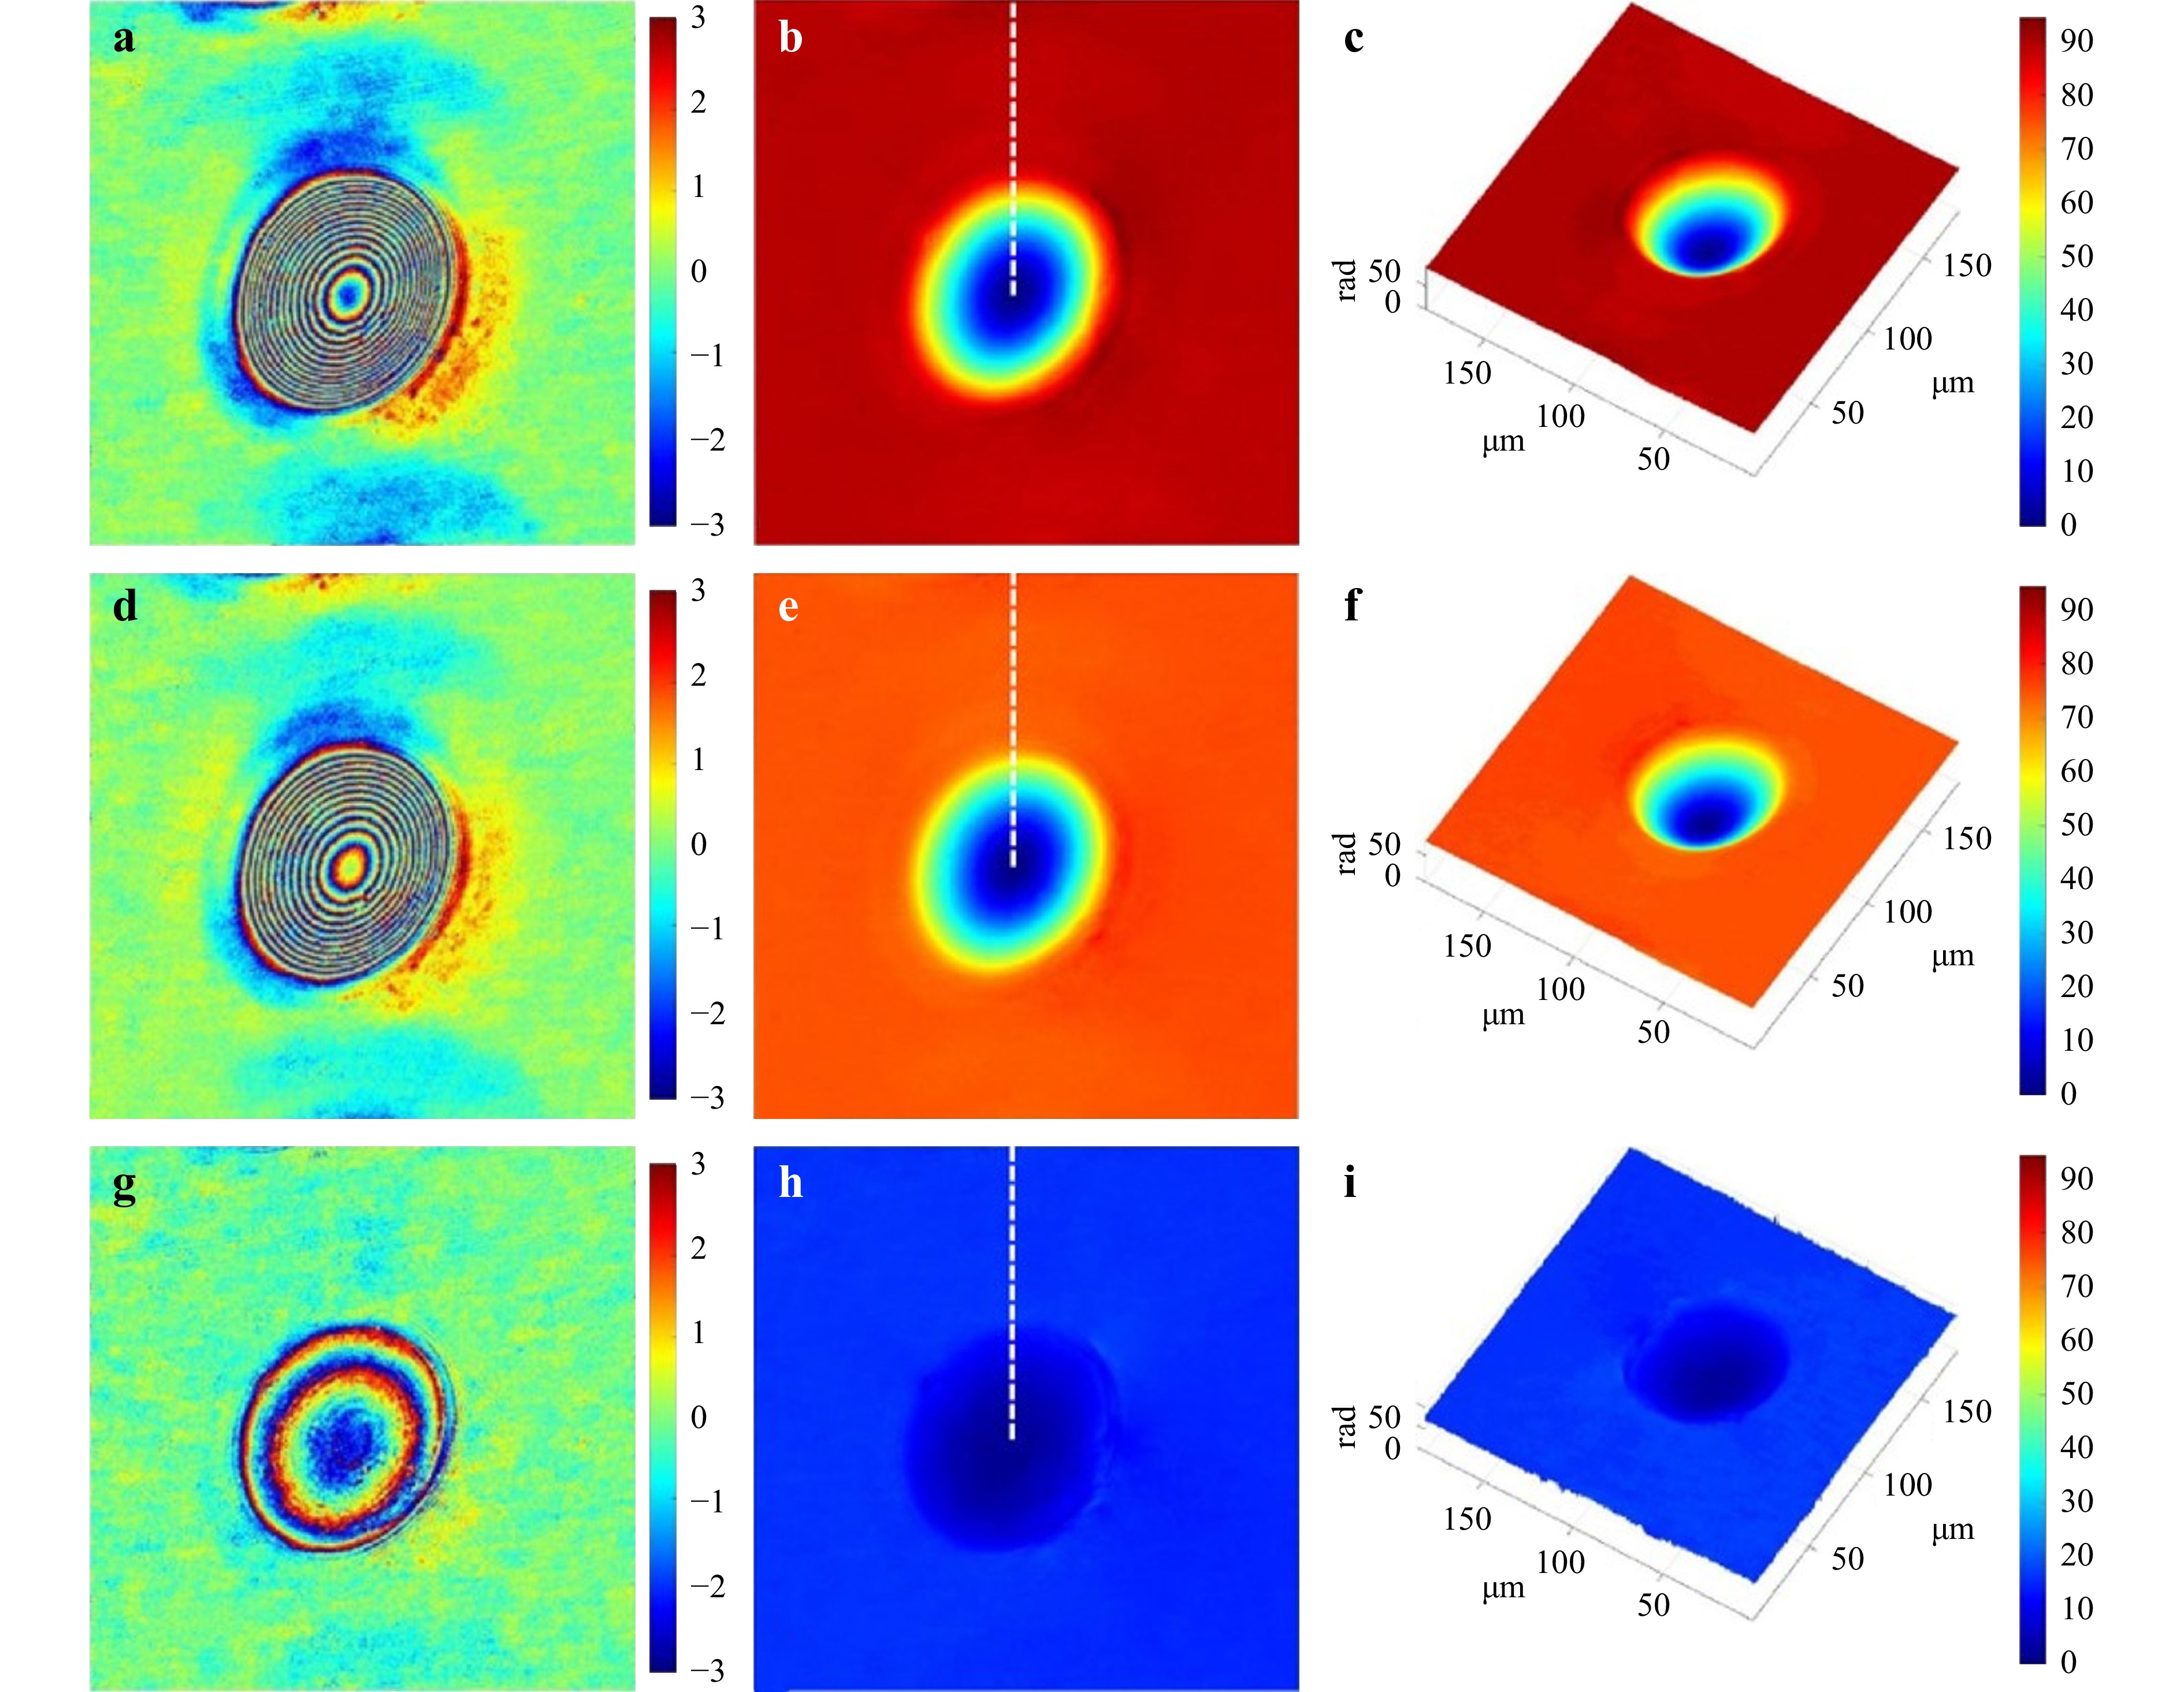
Fig. 4 Measurement results for the ablated pit specimen. a, d, g Reconstructed wrapped phase maps for
$ {\lambda }_{1} = $ 532 nm,$ {\lambda }_{2} = $ 632.8 nm, and Λ = 3339.8 nm; b, e, h unwrapped phase maps for$ {\lambda }_{1} $ ,$ {\lambda }_{2} $ and Λ; and (c, f, i) 3D surface topography of the specimen for$ {\lambda }_{1} $ ,$ {\lambda }_{2} $ and Λ (Fig. 4 in ref. 65).For micron scale synthetic wavelengths, the two wavelengths can be easily obtained from different lasers. For a millimeter scale or even centimeter scale synthetic wavelength, a narrow spacing between different wavelengths is required. A common way is to use the dual-longitudinal-mode He-Ne laser64,83,114 around 632.8 nm with a
$ ~ 1\;GHz $ spectrum separation, which yields a synthetic wavelength around$ 30\;cm $ . By using tunable lasers or acoustic-optic methods29,74,77,79, similar synthetic wavelengths can be achieved, suitable for 3D imaging of large object features. However, the stability and linewidth of the laser modes can be an impediment to achieving very high synthetic wavelengths. In addition, structured light imaging methods has a significant advantage in imaging macro objects, by projecting wide fringe patterns to the targets51,52,56.In the works described above, dual-wavelength acquisitions were performed sequentially. To further apply DWT in high-throughput applications, single capture dual-wavelength 3D topography has been studied. In 1998, Onodera et al. proposed a single acquisition method in Fourier interferometry with a single interferogram recorded in two different wavelengths115. In 2007, Kuhn et al. applied the single acquisition in real-time DWDH applications66. The idea is based on spatial multiplexing of hologram by incoherent addition of two single-wavelength interferograms on the same image sensor. The optical setup has two Mach-Zehnder interferometers built around the sample and creating two separate reference paths for two wavelengths (see Fig. 5). The camera obtains two off-axis interferograms of the sample simultaneously with two fringe patterns in a 90-degree rotation relation. This multiplexing method has also been developed for dynamic measurement67,76 and a dual-wavelength interferometry external module for simultaneous phase unwrapping71. Single capture of the dual-wavelength hologram can also be achieved by using color channels of a Bayer mosaic camera116. From different color channels, the interferograms can be recorded simultaneously. Polarization multiplexing is the other way to perform real time DWT69. A combination of Bayer filter and linear micro-polarizers has also been proposed recently to obtain a single snapshot91.
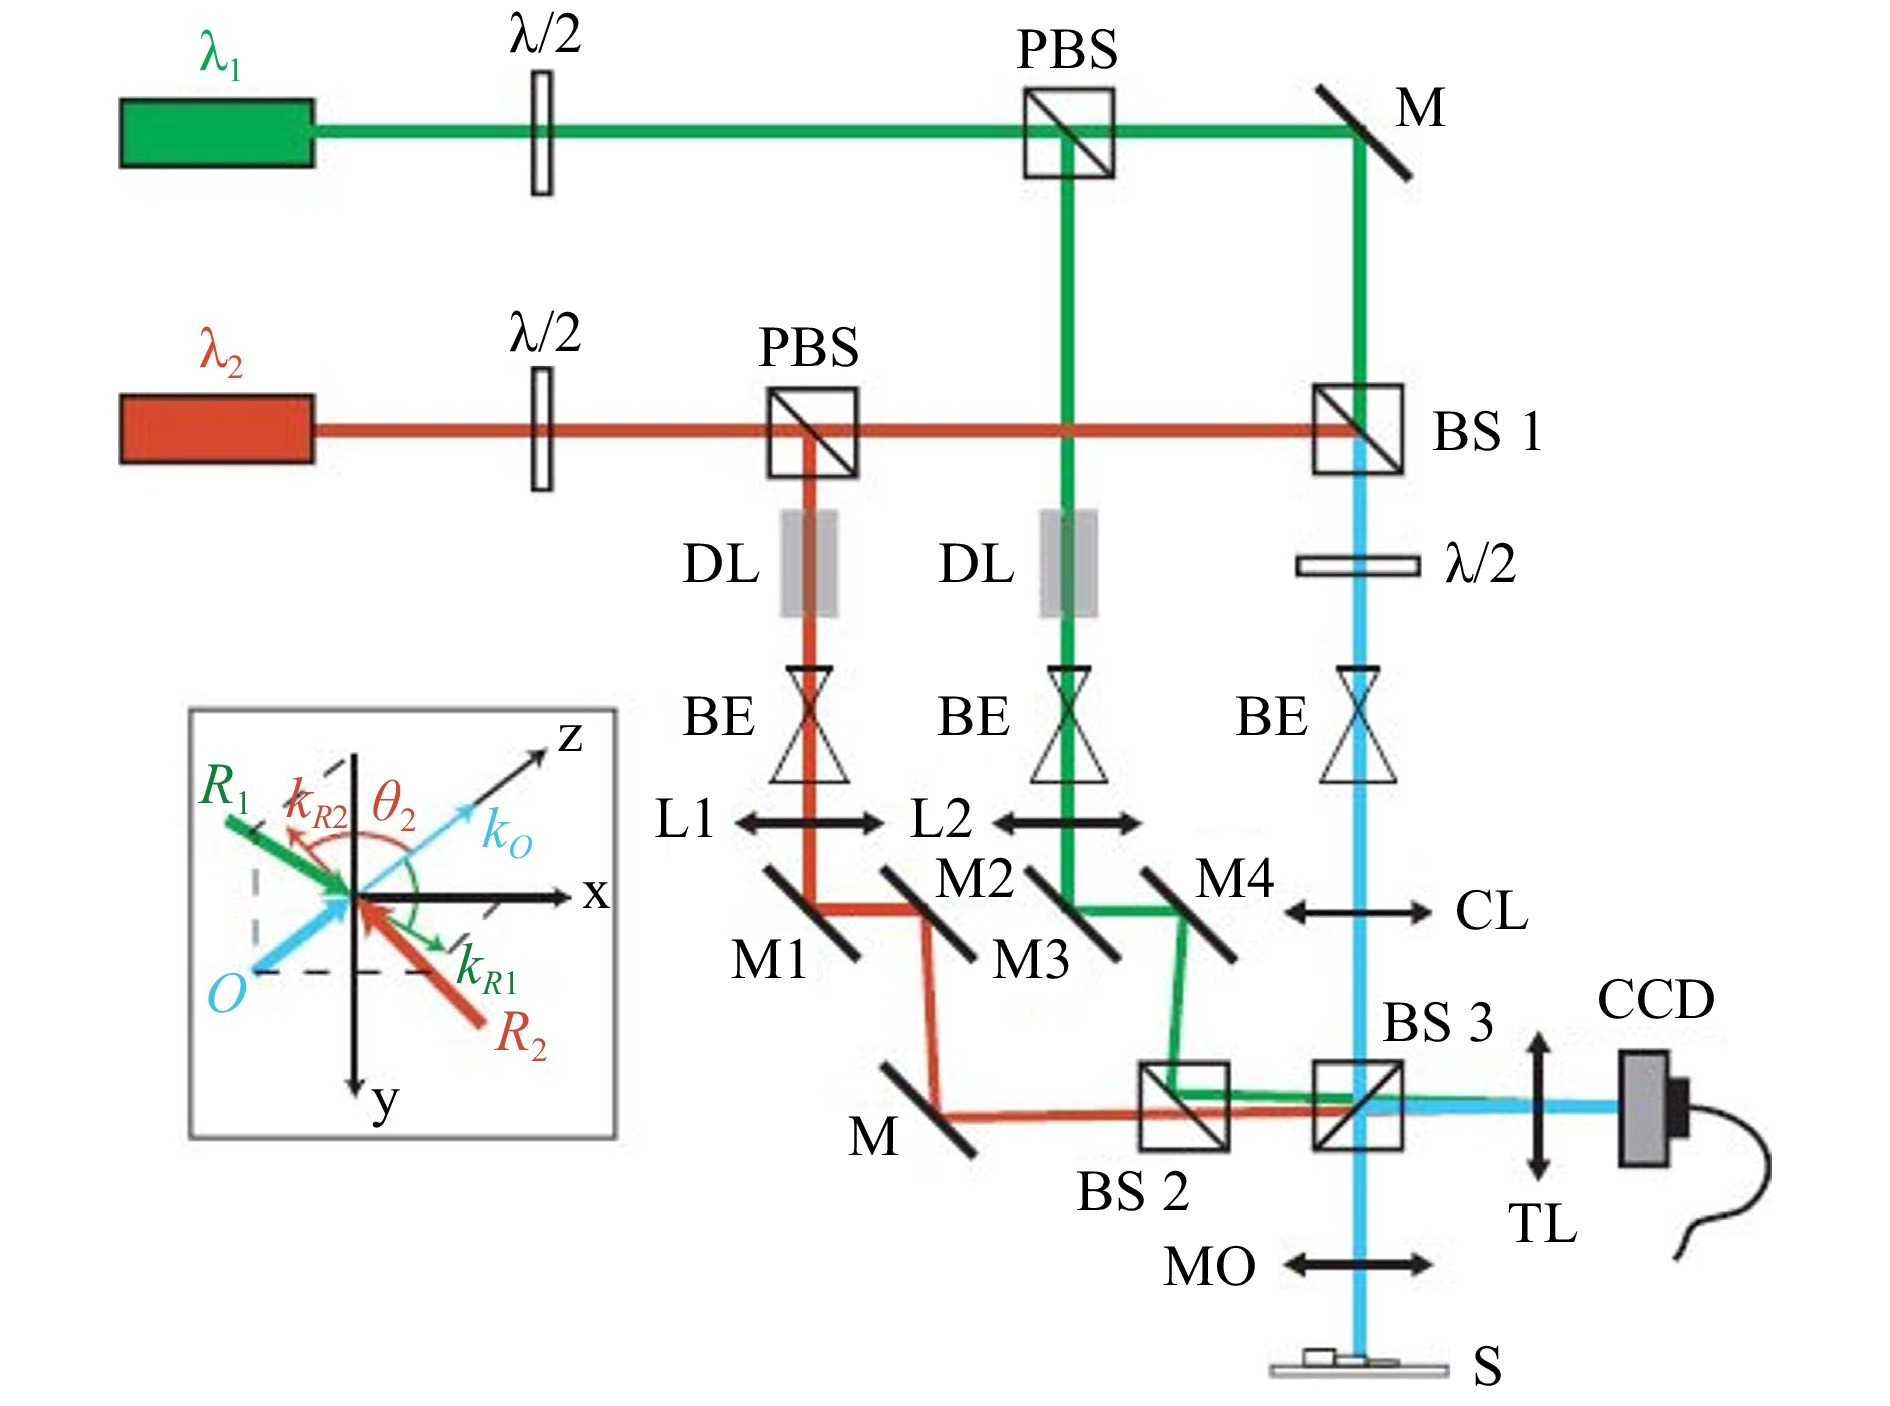
Fig. 5 Two-wavelength DH microscopy setup. λ/2: half-waveplate, M: mirrors, PBS: polarizing beamsplitter, BS: non-polarizing beamsplitter, DL: delay line, BE: beam-expander, L: lens, CL: condenser lens, MO: x3 achromatic microscope objective, 0.1 NA, S: specimen, TL: tube lens; Inset: 3D distribution of the incident waves propagation directions upon the CCD plane,
$ {\boldsymbol{k}}_{\boldsymbol{R}1} $ and$ {\boldsymbol{k}}_{\boldsymbol{R}2} $ are the propagation vector directions of the reference waves$ {\boldsymbol{R}}_{1} $ for wavelength$ {\lambda }_{1} $ and$ {\boldsymbol{R}}_{2} $ for$ {\lambda }_{2} $ (Fig. 1 from ref. 66).The other limit of using DWT is to resolve nanometer/sub-nanometer features. These nanometer scale features are hard to reconstructed by single wavelength, due to the small variations in height displays tiny displacement in lateral fringes. Therefore, noise can be dominant in topography maps. Theoretically, Eq. 4 implies that the synthetic wavelength cannot be smaller than either of the single wavelength. Using a fringe subdivision method117 together with synthetic wavelength method, the nanometer level accuracy reconstruction can be achieved. In 2002, Chen et al. proposed to employ a large synthetic wavelength to subdivide fringes formed by a small single wavelength64. Two Michelson interferometers for two different wavelengths from two orthogonal polarized He-Ne laser modes are used to obtain the phase difference,
$ \Delta \Phi =2\pi \left(({L}/{\Lambda })-({{L}_{2}}/{{\lambda }_{2}})\right) $ . A piezoelectric transducer (PZT) is used to introduce nanometer scale optical path difference for one of the wavelengths; an optical path difference is also introduced to the other interferometer to keep the phase difference$ \Delta {\rm{\Phi }} $ as a constant. Then, from setting$ 2\pi \left({L}/{\Lambda }-{{L}_{2}}/{{\lambda }_{2}}\right)=2\pi (({L+\Delta L})/{\Lambda }-({{L}_{2}}+ {\Delta {l}_{2}})/{{\lambda }_{2}}) $ ,$ \Delta {l}_{2}={{\lambda }_{2}}/{\Lambda }\Delta L $ . This yields to a fringe subdivision factor$ {{\lambda }_{2}}/{\Lambda } $ . From the fringe subdivision factor the small fringe displacement from single wavelength can be amplified in the large synthetic wavelength. A similar method has also been applied together with self-mixing interference or signal processing to achieve nanometer accuracy83.DWT can also be adapted to CDI techniques. CDI requires no lenses or reference beams and only collects diffracted intensity patterns118. CDI was first developed for electron beams for which aberration-free focusing tools did not exist. For this reason, CDI technique can also be very useful in the wavelength range where no good optics exist, e.g., X-ray, deep UV. Since CDI only collects the intensity patterns off an object due to diffraction, the technique uses the physics of beam propagation to iteratively calculate the phase pattern. CDI-related techniques can be categorized as single-shot CDI and Ptychography/Fourier Ptychography.
The single-shot CDI method to retrieve phase is well-known in optics, X-rays, electron imaging and crystallography118-121. In single-shot CDI, only one diffraction pattern is collected at the far-field. The phase is retrieved by iteratively performing Fourier/inverse-Fourier transforms. In each iteration the intensity pattern is substituted with the collected intensity together with the constrained values. The algorithm finally converges to an optimal result. However, single-shot CDI heavily depends on the efficacy of the chosen algorithm122. Recently, dual-wavelength CDI has been realized by exploiting the wavelength-dependent scaling of the support domain to recover separate reconstructions for each wavelength123. Other phase retrieval algorithms124-131 are based on the Gerchberg–Saxton (GS) algorithm124, for example, error reduction (ER)125, hybrid input output (HIO)124, etc.
Ptychography records multiple diffraction patterns from the same object by shifting the aperture placed before the object (Fig. 6a)132. Collimated light hits the aperture and the field distribution after the aperture is called the ‘probe field’,
$ {P}_{n}(x,y) $ , where n represents the$ {n}^{th} $ position of the aperture. For an object transparency$ T\left(x,y\right) $ , the ‘exit field’ is$ E\left(x,y\right)={P}_{n}\left(x,y\right)T\left(x,y\right) $ . After propagation to the far-field, this transforms into the$ {n}^{th} $ detected field$ {D}_{n}\left(x,y\right) $ . Fig. 6b shows a modified setup for ptychography that can be used for reflective phase objects. Wigner distribution deconvolution method133 can be used to extract the phase of$ T\left(x,y\right) $ . However, this method requires a large n with smaller step-size from aperture to aperture. A widely used algorithm, the extended ptychographic iterative engine, iteratively determines the phase of$ T\left(x,y\right) $ . In Fourier ptychography, the aperture scans the Fourier space instead of the object space134. It also has other modality to achieve synthetic aperture by angular illumination60. DWTs have also been adopted in ptychography135 and aperture scanning Fourier ptychography136. By applying DWT, the absolute height or phase measurement can be greatly enhanced. DWT can also be a good combination with other modern imaging modalities to extend the height and phase measurement range, e.g. non-line-of-sight imaging77. Other possible directions of applications will be further discussed in the conclusion and future direction section.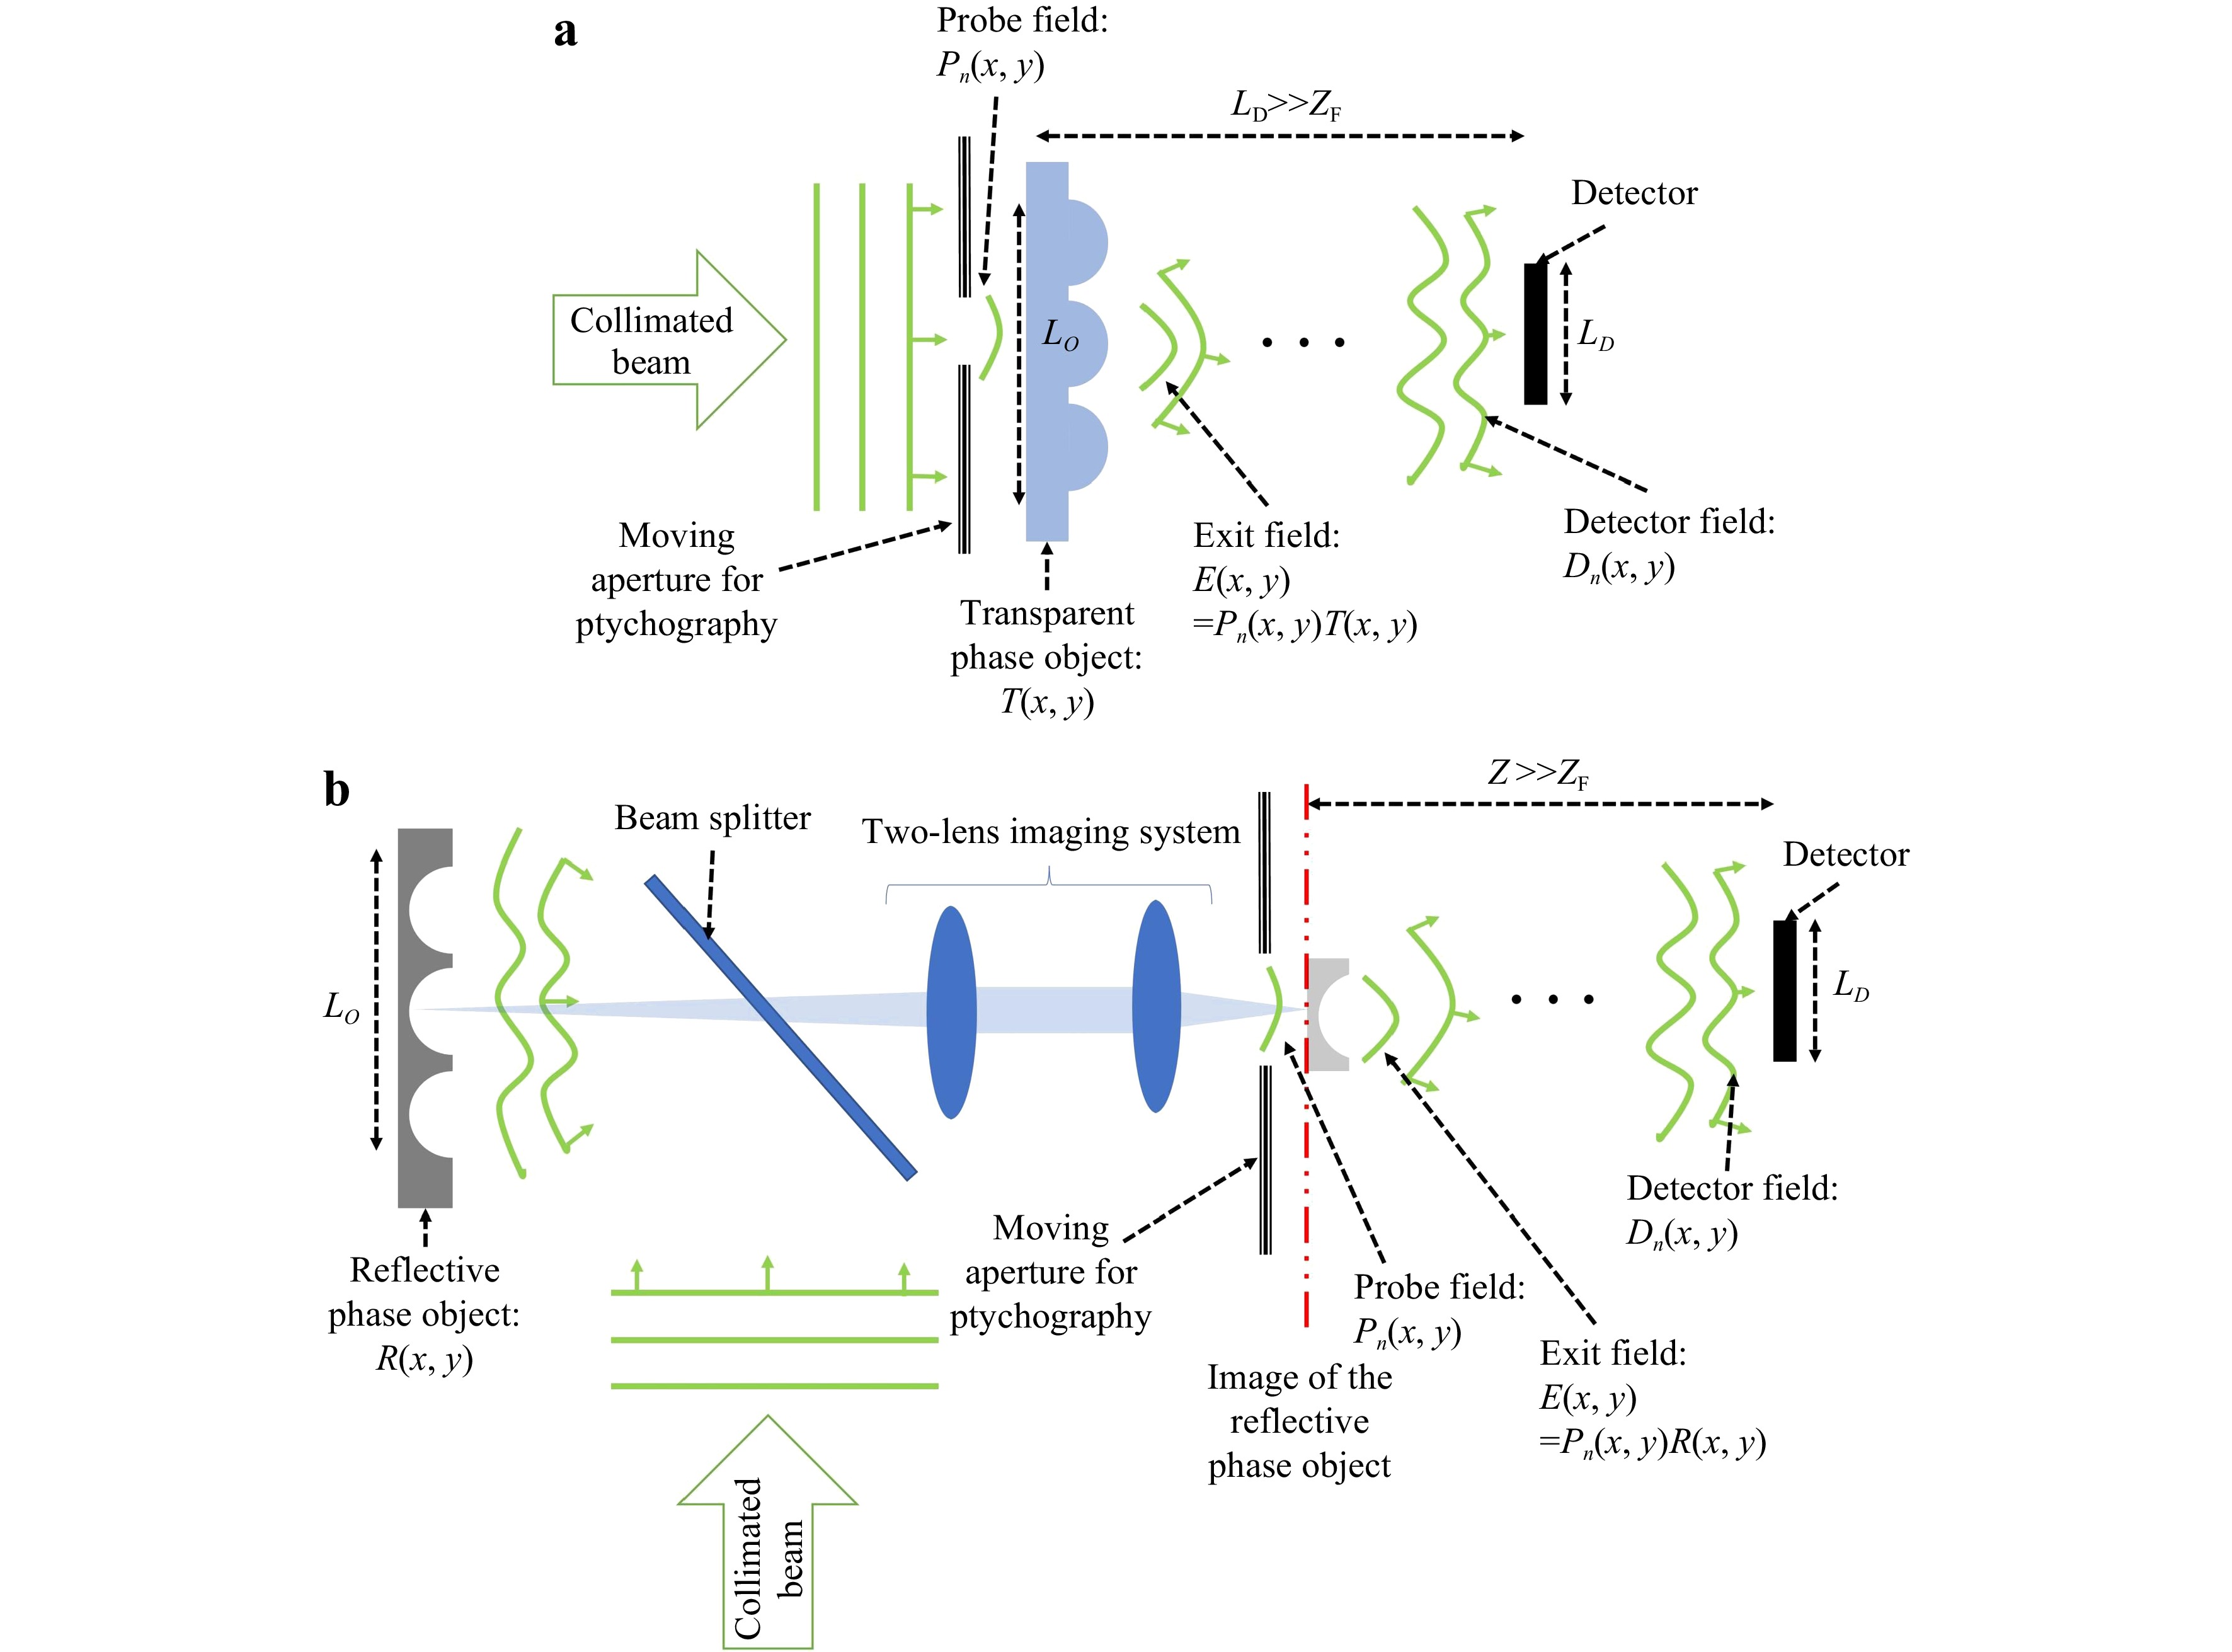
Fig. 6 a An experimental setup for ptychographic CDI for a transparent (phase) object. b A modified experimental setup for ptychographic CDI for a reflective object (with no absorption).
As mentioned in the introduction and principle sections, the other mathematical framework of DWT is to use the sum of the two phase maps. The two-sensitivity temporal phase-unwrapping technique has been applied to phase metrology with FPP. The algorithm is shown in Eq. 14. The SNR for the measurement of a fluorescent spiral lamp using phase sum is higher than the phase difference by a factor of
$ {G}^{2}={\left({{\rm{\Lambda}}}/{{{\rm{\Lambda}}}_{+}}\right)}^{2}=289 $ . Fig. 7 (adopted from Figs. 9 and 11 in Ref. 43) shows the difference and the sum of the phase maps, and the super-sensitive phase-sum method shows a clear depression in noise (blue solid line). The flexibility and the ease of implementation of this method is promising in the future applications.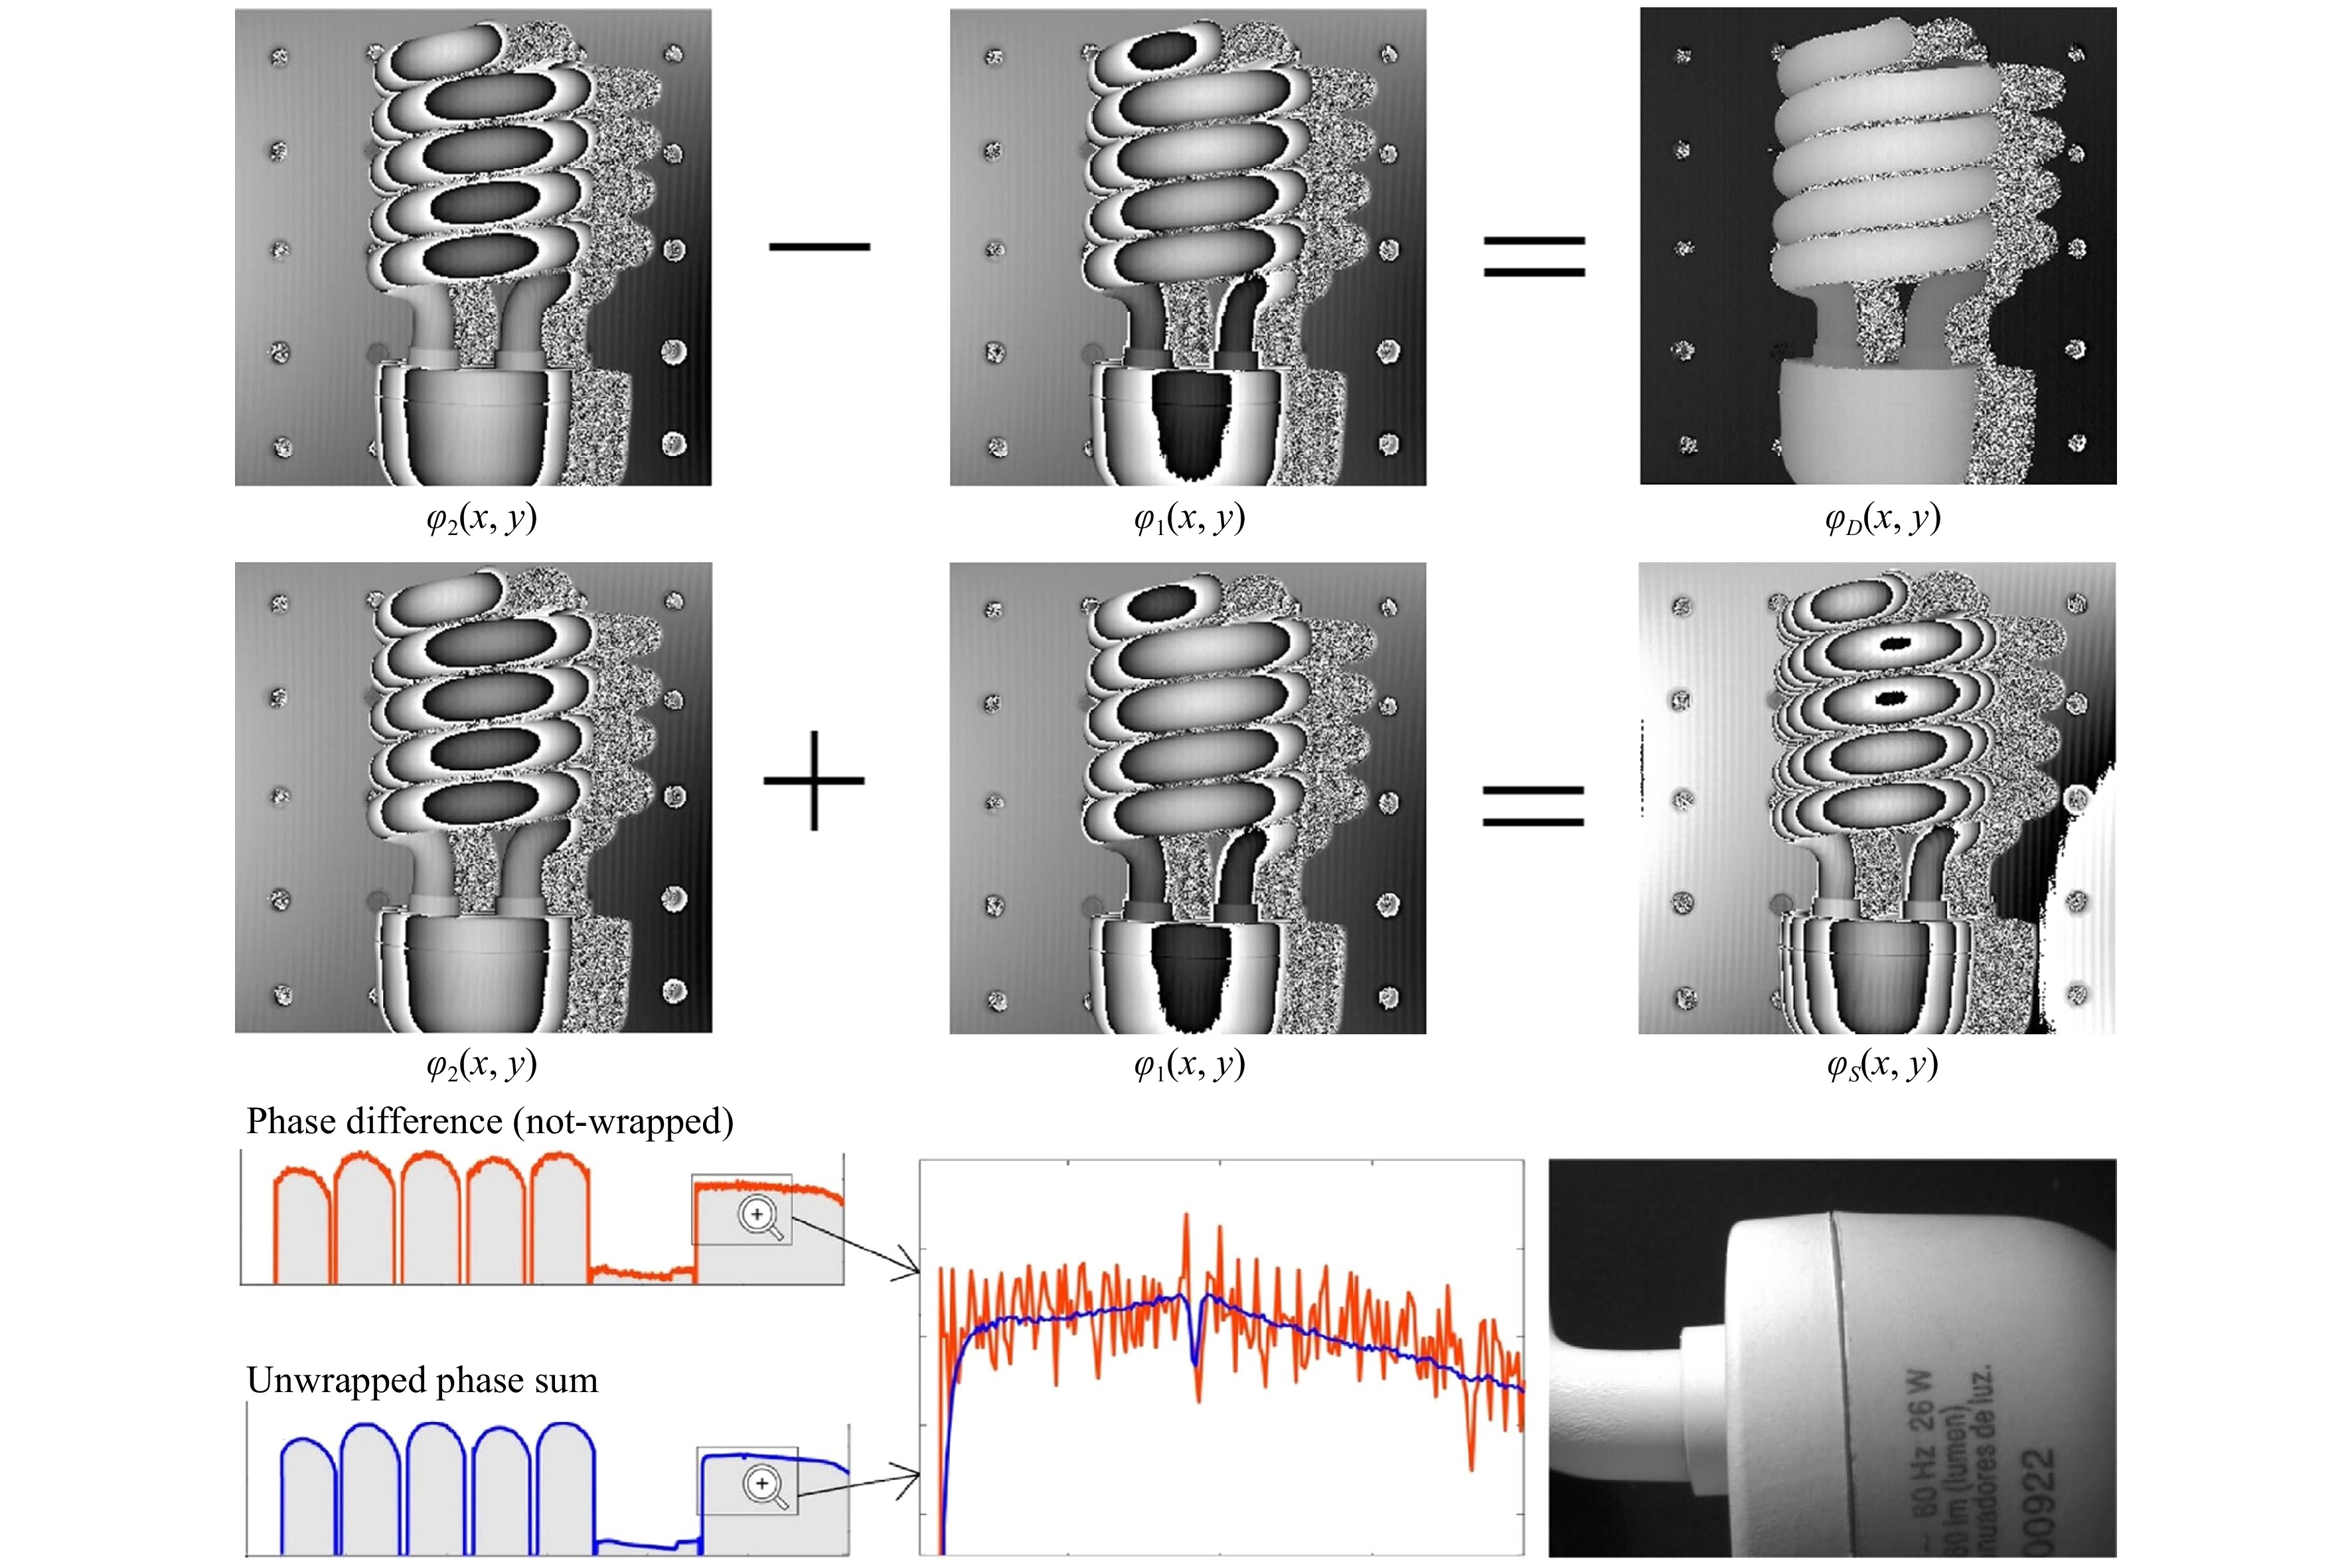
Fig. 7 The upper row shows the non-wrapped phase-difference while the middle row shows the highly wrapped phase-sum. The phase-sum has much higher sensitivity, so it is highly wrapped. The lower row: comparsion of the SNR between the phase-difference (in red), and the super-sensitive phase-sum (in blue). We have zoomed-in to clearly see the depression at the joining of the two plastic pieces shown in the photograph-detail (Figs. 9 and 11 in ref. 43).
-
The DWT shows great advantage in avoiding phase unwrapping ambiguity, achieving sub-wavelength longitudinal resolution imaging with fringe subdivision, single-shot imaging, and adapting to various coherent/incoherent imaging techniques. However, it still has limitations. Here, we analyze:
(a) the limit of maximum resolvable phase or height based on selection of system parameters (Itoh condition),
(b) choice of optimum detector size based on truncation ratio, which is the ratio of the object size to the detector size (truncation condition), and
(c) possible noise sources degrading the reconstruction results.
To systematically investigate the first two conditions mentioned above, the following assumptions are made:
(1) to quantify the performance improvement due to dual-wavelength measurements, the phase retrieval algorithms are assumed to be accurate. For this analysis, the PUMA algorithm developed by Bioucas-Dias and Valadao104 is used; however, any phase unwrapping algorithm could have been used. In actual experiments, the final performance has dependency on both phase retrieval and phase unwrapping algorithms;
(2) for any wavelength
$ {\lambda }_{1} $ , an object of size$ {L}_{O} $ and a detector placed at a distance of Z away from the object (Fig. 8). The object can be transparent (Fig. 8a) so that it can be placed directly in the path of a collimated beam to collect the diffracted light (represented by the deformed wavefronts), or reflective (Fig. 8b) so that a beam splitter can be used to illuminate it and then collect the diffracted light. The assumption is:$ Z\gg {Z}_{F} $ , where the Fraunhofer distance,$ {Z}_{F}=2{{L}_{O}}^{2}/{\lambda }_{1} $ . For a detector of size$ {L}_{D} $ placed in the far-field region$ (Z\gg {Z}_{F}) $ , the minimum detectable feature size of the object is,$ \Delta {x}_{O}=({{\lambda }_{1}Z})/({N\Delta {x}_{D}} )$ (from Eq. 11). Here,$ {L}_{D}={\Delta x}_{D}N $ is the detector size,$ {\Delta x}_{D} $ is the pixel pitch of the detector and N is the number of pixel along x-axis. Note that this can also be valid in near field using Eq. 7. For simplicity, the simulations below are performed assuming far-field. Since features smaller than a pixel also cannot be detected (due to aliasing),$ {\Delta x}_{O} $ is equivalent to pixel size in object plane.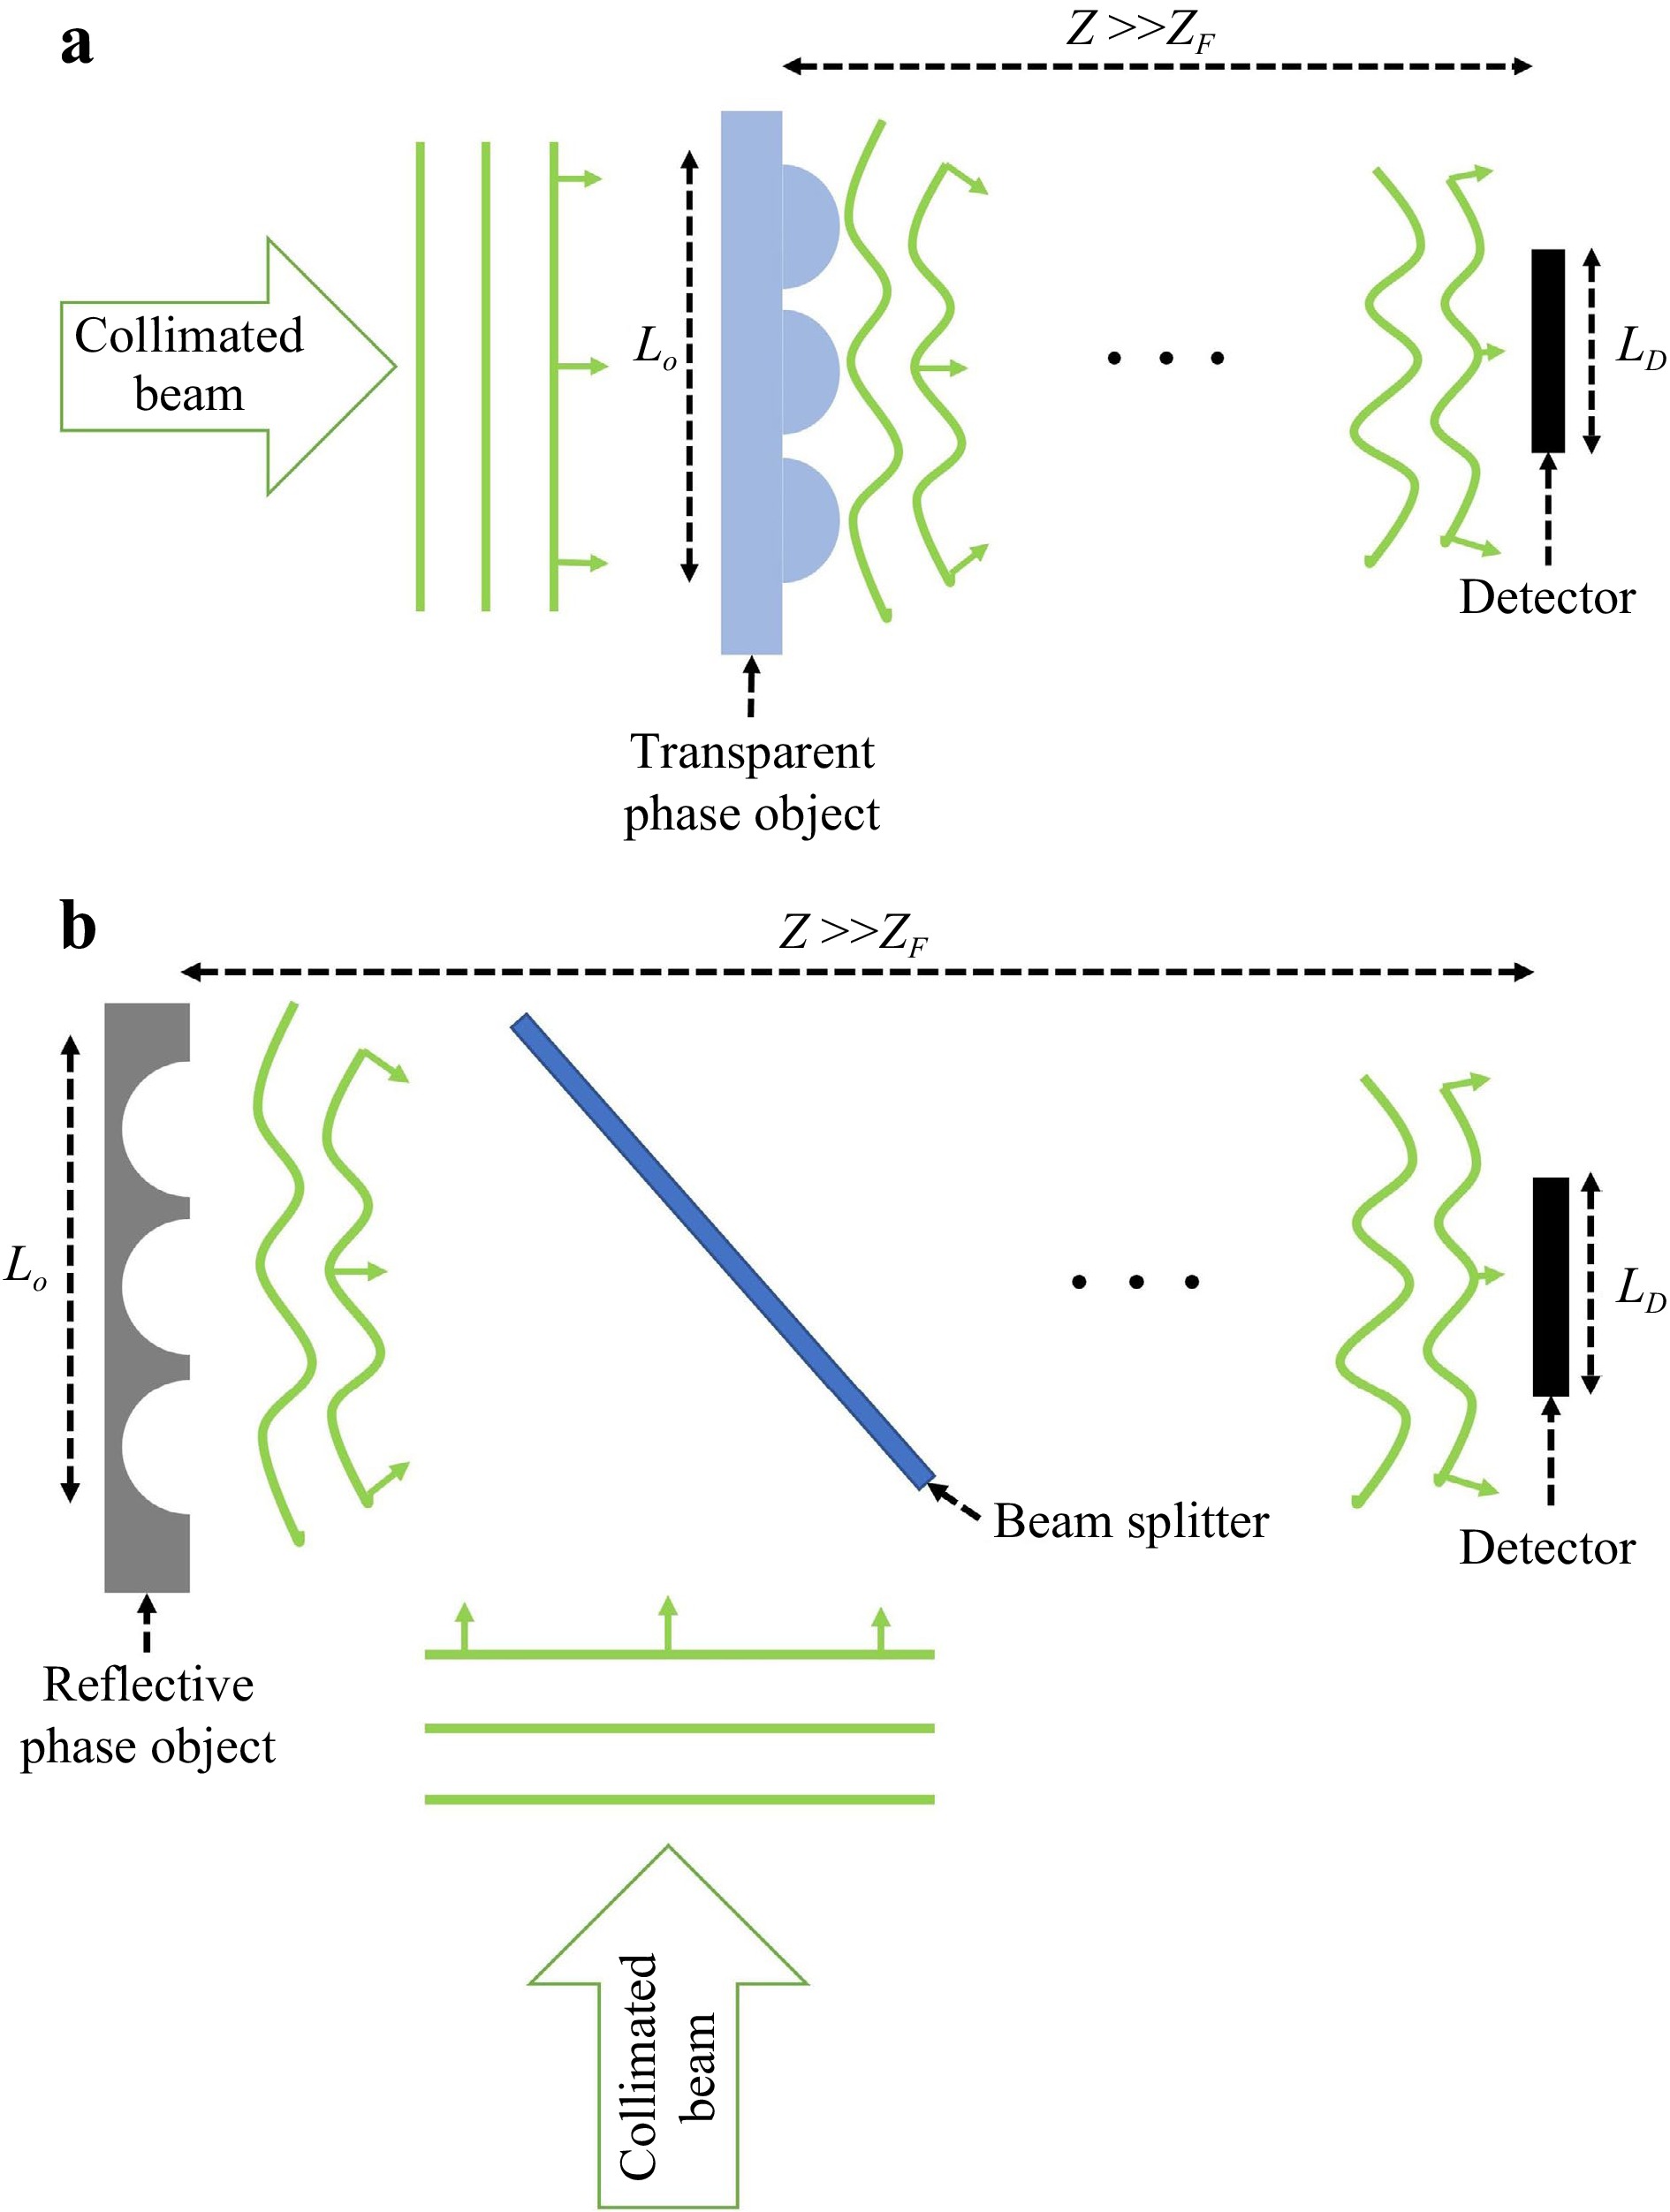
Fig. 8 A simplified setup that records the diffraction pattern off of a a transparent (phase) object and b reflective object (with no absorption) illuminated with a collimated beam. For both cases the object-to-detector distance Z is such that
$ Z\gg {Z}_{F} $ . The reflective setup uses a beam splitter to illuminate the object. The features on the objects are arbitrarily chosen.As long as the above assumptions are satisfied, the following two conditions must be met for successful unwrapping using synthetic wavelength.
-
The Nyquist limit137, also known in literature as the Itoh condition104,138, states that the maximum phase slope (i.e. change of phase per pixel) that can be successfully unwrapped is
$$ {{\tilde S}}_{Itoh}=\pi \left[\frac{rad}{pixel}\right] $$ (15) A π radian phase can be achieved by propagation of a distance
$ {\lambda }_{1}/2 $ along the z-axis. Meanwhile, Eq. 11 provides the effective pixel pitch on the object plane. For single-wavelength measurement, this becomes$$ {{S}_{Itoh,{{\lambda }_{1}}}}=\frac{{}^{{{\lambda }_{1}}}\diagup{}_{2}\;}{{}^{Z*{{\lambda }_{1}}}\diagup{}_{{{L}_{D}}}\;}=\frac{{{L}_{D}}}{2Z}\left[ \frac{\mu m}{\mu m} \right] $$ (16) The maximum phase slope anywhere in the object plane must be smaller than the Itoh phase slope, i.e.
$ {{S}_{max}\le S}_{Itoh}. $ For a given optical system design, the Itoh slope,$ {S}_{Itoh} $ (in units of$ {\mu m}/{\mu m} $ ), serves as a system parameter since it can be determined in terms of wavelengths, detector size, object-to-detector distance etc. A higher$ {S}_{Itoh} $ corresponds to a more capable optical system that can handle surfaces with a relatively sharper height jump.From Eq. 16,
$ {S}_{Itoh,{\lambda }_{1}} $ has no dependency on the wavelength used for measurement. The benefit of using a larger$ {\lambda }_{1} $ could be a better phase resolution in the z-axis. However, this benefit is counteracted by the larger pixel size in the transverse plane. In the far-field, the diffraction pattern is the Fourier transform of the object phase distribution. Experimentally, only a portion of the diffraction pattern can be collected due to the finite size of the detector. The process of omitting the higher spatial frequencies (at the outskirts of the diffraction pattern) is called “apodization”. From Eq. 16, it is apparent that both a larger detector size$ {L}_{D} $ and a smaller object-to-detector distance Z (assuming$ Z\gg {Z}_{F} $ still holds) reduce apodization and cause a higher value of$ {S}_{Itoh,{\lambda }_{1}} $ .DWT uses a synthetic wavelength Λ (Eq. 4). For this case, the new Itoh condition becomes
$$ {{S}_{Itoh,\Lambda }}=\frac{{}^{\Lambda }\diagup{}_{2}\;}{{}^{Z*{{\lambda }_{2}}}\diagup{}_{{{L}_{D}}}\;}=\frac{{{L}_{D}}}{2Z}\frac{{{\lambda }_{1}}}{{{\lambda }_{1}}-~{{\lambda }_{2}}}\left[ \frac{\mu m}{\mu m} \right] $$ (17) For a given detector size and distance, DWT improves the maximum detectable slope limit by a factor of
$ {{\lambda }_{1}}/({{\lambda }_{1}-{\lambda }_{2}} )$ . In other words, a larger$ {\lambda }_{1} $ and, correspondingly, an increased z-axis resolution, give a higher value of$ {S}_{Itoh,\Lambda } $ . Also, closer separation of$ {\lambda }_{1} $ and$ {\lambda }_{2} $ leads to a larger$ {S}_{Itoh,\Lambda } $ . This improvement is illustrated in the following example, typical of a realistic experiment.Assume that a detector is placed
$ Z=100\;mm $ away from a phase object of size$ {L}_{O} $ (see Fig. 8). The detector has$ 512\;\times \;512 $ pixels and the pixel pitch is$ 5.2\;{\rm{\mu m}} $ . An object size of$ {L}_{ox},{L}_{oy}=2\;{\rm{\mu m}} $ is used and the two wavelengths used for measurement are$ 0.501\;{\rm{\mu m}} $ and$ 0.496\;{\rm{\mu m}} $ . For this scenario, the Fraunhofer distance$ {Z}_{F}=15.96\;{\rm{\mu m}} $ is much smaller compared to the total propagation distance Z. Thus, for SWT,$ {S}_{Itoh,{\lambda }_{1}}=0.13312 $ and for DWT,$ {S}_{Itoh,\Lambda }=1.33386 $ . The object comprises of a Gaussian height profile$ {h}_{in}\left(x,y\right)= $ $ {h}_{0}{e}^{({{x}^{2}+{y}^{2}})/{{{\sigma }_{0}}^{2}}} $ with a peak height,$ {h}_{0}=10\;\mu m $ , and a width$ {\sigma }_{0}=400\;\mu m $ as in Fig. 9a. The truncation ratio T is defined as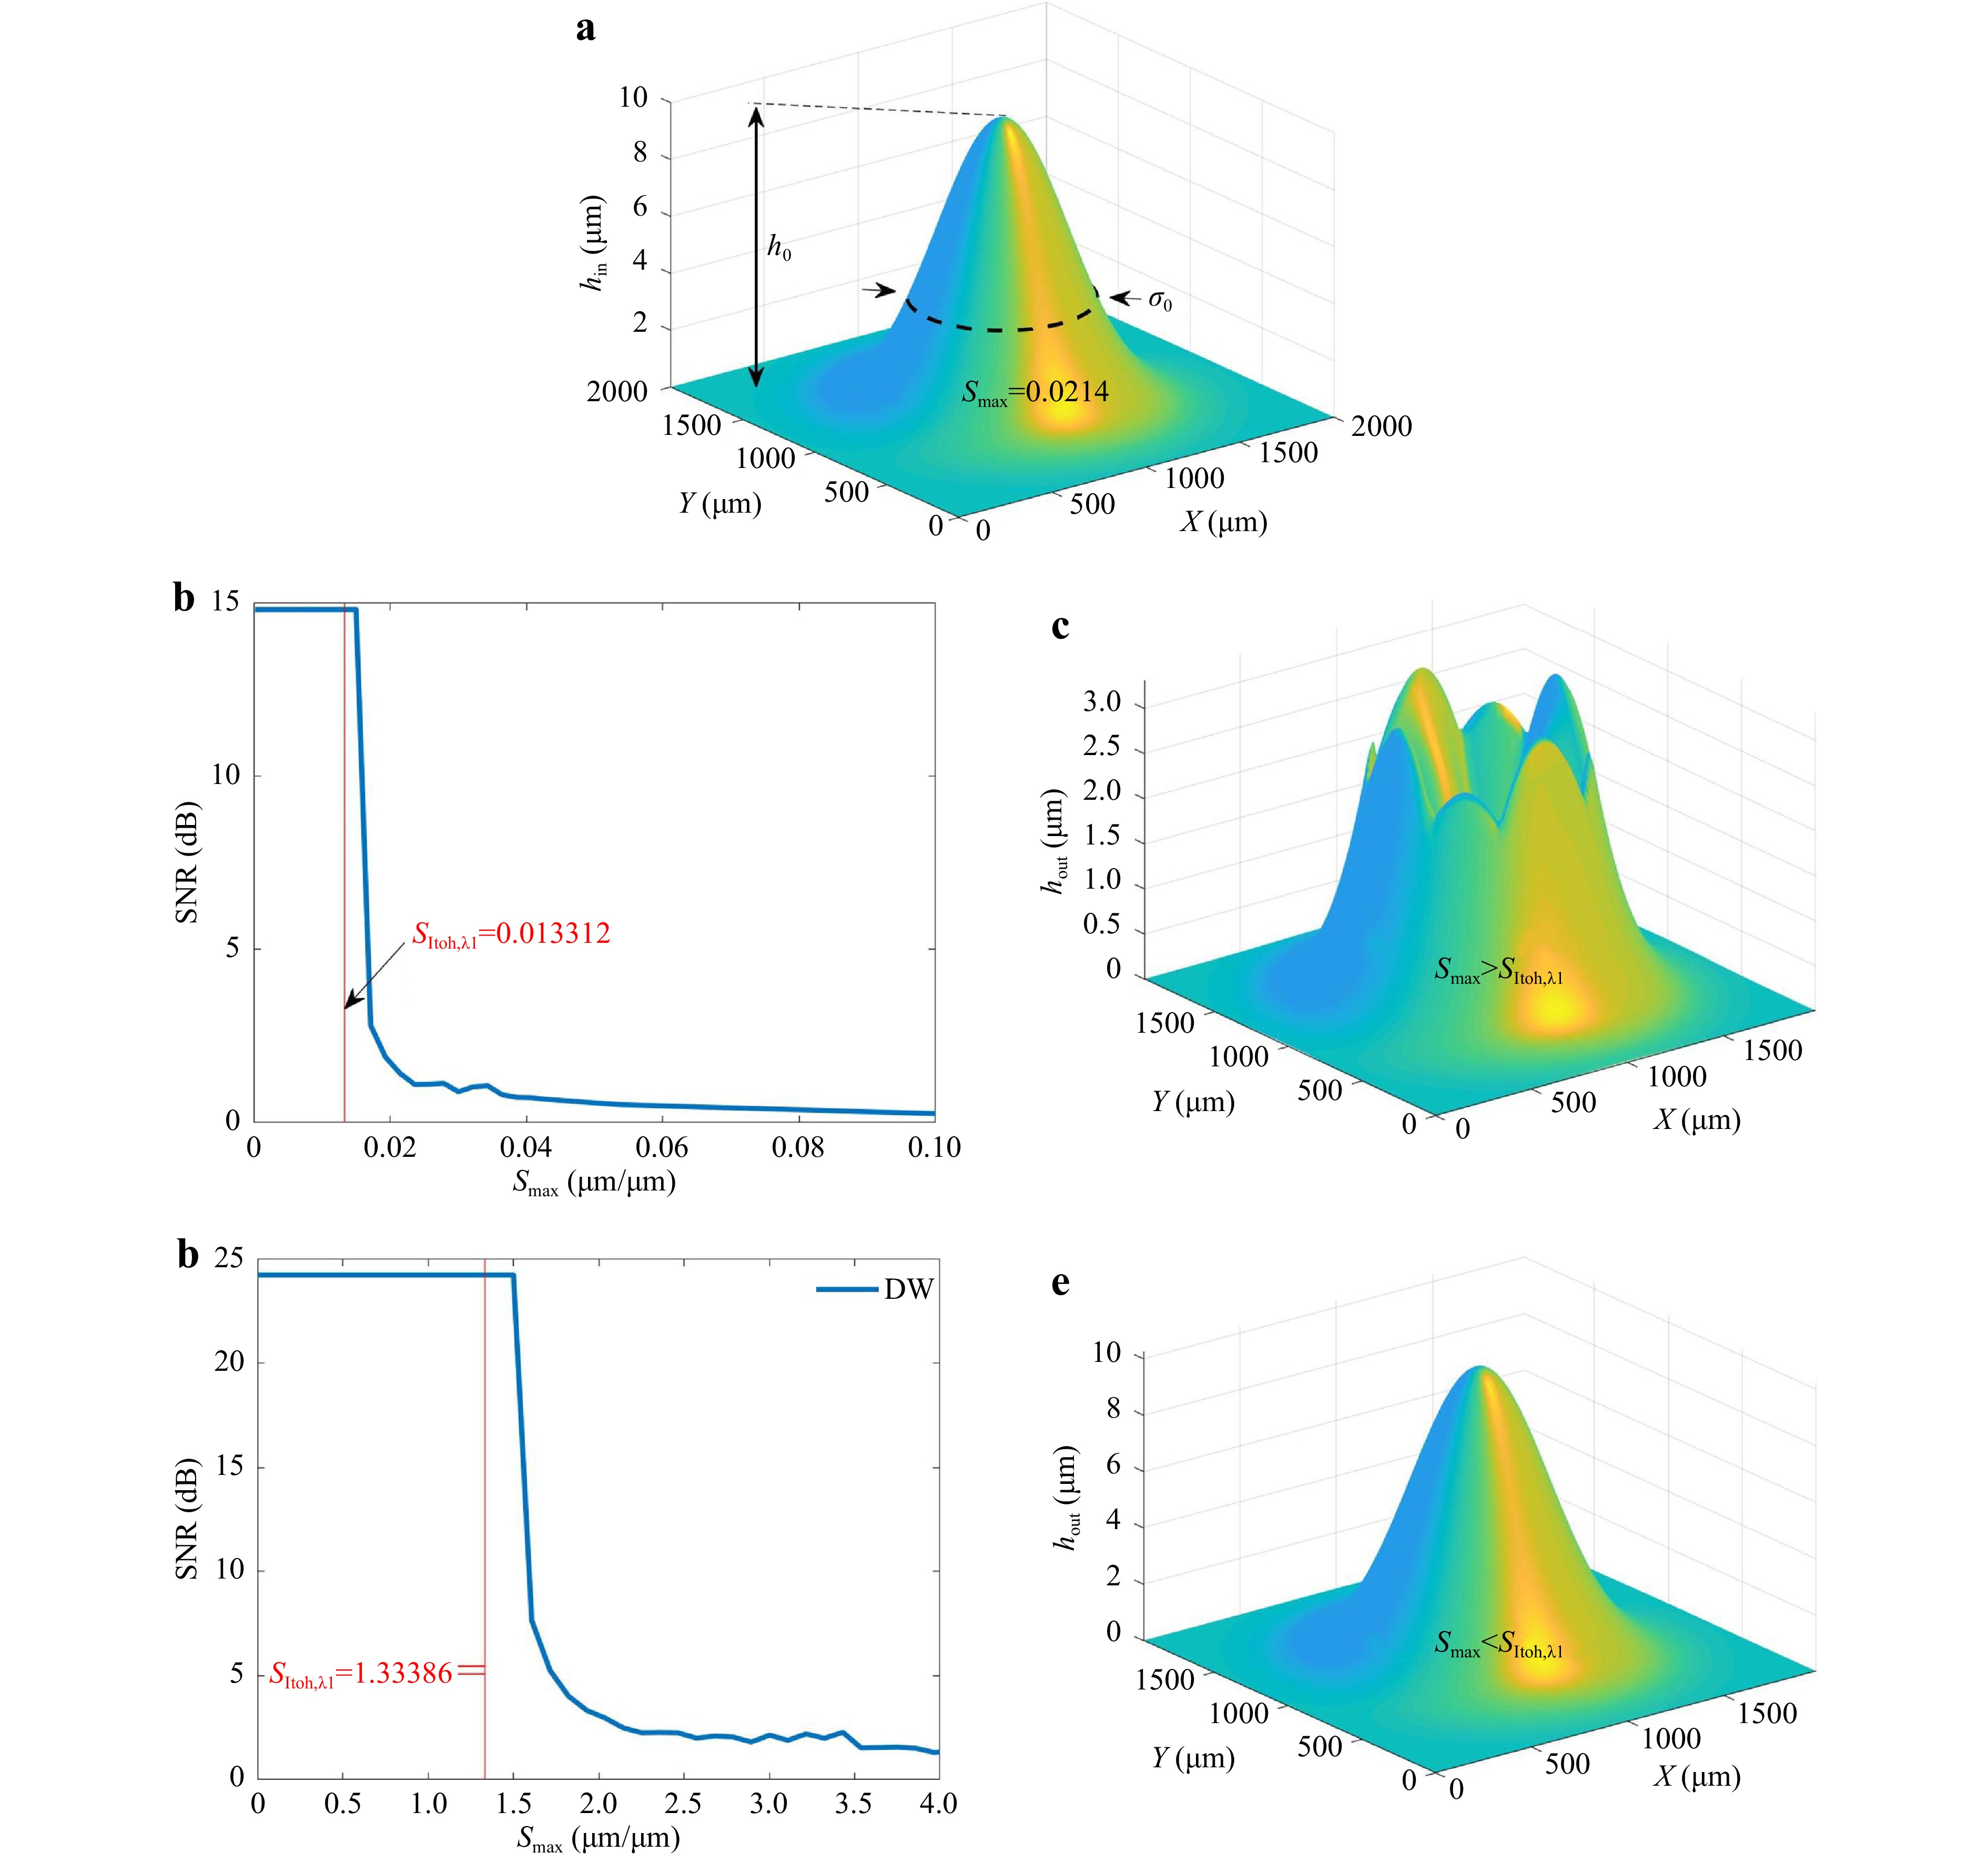
Fig. 9 a True height profile for a reflective object at the object plane. It is a Gaussian height profile with peak height
$ {h}_{0}=10\;\mu m $ , and width$ {\sigma }_{0}=400\;\mu m $ . The black dotted line denotes the waist of the Gaussian where the maximum slope$ {S}_{max} $ is located. b For single wavelength measurement,$ SNR\;{\rm{vs}}\;{S}_{max} $ . For$ {{S}_{max} > S}_{Itoh,{\lambda }_{1}} $ , the$ SNR $ drops. c When$ {{S}_{max} > S}_{Itoh} $ , the phase unwrapping fails. d The$ SNR\;{\rm{vs}}\;{S}_{max} $ with dual wavelength measurement. Under the condition$ {{S}_{max} > S}_{Itoh,\Lambda } $ ,$ SNR $ drops. e When$ {{S}_{max} < S}_{Itoh} $ , the phase unwrapping was successful.$$ T=\frac{{\sigma }_{x}}{{L}_{ox}} $$ (18) For these parameters of the optical system, the performance of PUMA is simulated. In a physical experiment, the diffraction pattern would be collected by a detector. Since the detector has finite size, the object plane is effectively pixelated, according to Eq. 11. The pixel size depends on the illumination wavelength. Analogous to the experiment, the object plane is sampled to match the effective pixelation. A resampling algorithm is used to achieve slightly different pixelations at two wavelengths. Experimentally, using some phase retrieval algorithms, a wrapped phase profile on the object plane can be recovered. For simulation purpose, a modulo-
$ 2\pi $ function is used to wrap the resampled input phase profile. Then, PUMA is used to unwrap the phase. Using appropriate wavelength, the phase profile is converted to a height profile and compared against the input height profile. The SNR is defined using the relation$$ SNR=10\log_{10}\left(\frac{{h}_{in,rms}}{{h}_{err,rms}}\right) $$ (19) where,
$ {h}_{in,rms} $ is the root-mean-squared (RMS) height of the object and$ {h}_{err,rms} $ is the RMS error between actual height$ {h}_{in}(x,y) $ and measured height$ {h}_{out}(x,y) $ :$$ {h}_{in,RMS}={\left(\frac{1}{{L}_{ox}{L}_{oy}}{\iint }_{x=0,y=0}^{{x=L}_{x},{y=L}_{y}}{\left({h}_{in}\left(x,y\right)\right)}^{2}dxdy\right)}^{1/2} $$ (20) $$ {h}_{err,RMS}={\left(\frac{1}{{L}_{ox}{L}_{oy}}{\iint }_{x=0,y=0}^{{x=L}_{x},{y=L}_{y}}{(h}_{out}\left(x,y\right){-{h}_{in}(x,y))}^{2}dxdy\right)}^{1/2} $$ (21) For a given truncation ratio (
$ T=0.2 $ for this case), the peak of the height profile is varied and the maximum slope of that height profile$ {S}_{max} $ (i.e. the slope at the inflection point which is$ 1{\sigma }_{0} $ away from the peak location) is determined. For each peak height, the SNR is also calculated using Eqs. (19-21). As predicted by the Itoh condition, the SNR drops when$ {{S}_{max} > S}_{Itoh} $ . Fig. 9b demonstrates these phenomena for single wavelength measurement. For one input height profile (Fig. 9a), the measured height profile is shown in Fig. 9c. The measurement fails (as indicated by a very low SNR in Fig. 9b) due to$ {{S}_{max} > S}_{Itoh,{\lambda }_{1}} $ . Then, the measurement is repeated using dual wavelengths. This increases the$ {S}_{Itoh} $ limit to$ {S}_{Itoh,\Lambda }=1.33386 $ . Fig. 9d indicates that the SNR keeps at a higher value until$ {S}_{Itoh,\Lambda } $ . Fig. 9e shows the measured height profile with high SNR. This example illustrates how the dual wavelength measurement pushes the$ {S}_{Itoh} $ limit higher and makes a high SNR measurement possible for a height profile that clearly has low SNR for a single wavelength measurement. -
For a successful phase unwrapping (
$ SNR > 10\;dB $ ), the Itoh condition (i.e.$ {{S}_{max} < S}_{Itoh} $ ) is a necessary but not sufficient condition. The truncation ratio T also needs to be within certain range. From Fig. 10, the$ SNR $ peaks within the range$ 0.05 < T < 0.5 $ . For an optical system (i.e. given$ {S}_{Itoh} $ limit) and certain input object size, a smaller T produces less resolved object plane causing lower$ SNR $ . On the other hand, for the same system and input object size, a larger T introduces apodization artifacts such as ripples at the edge of the measured object height. The range of T will be further investigated in the future.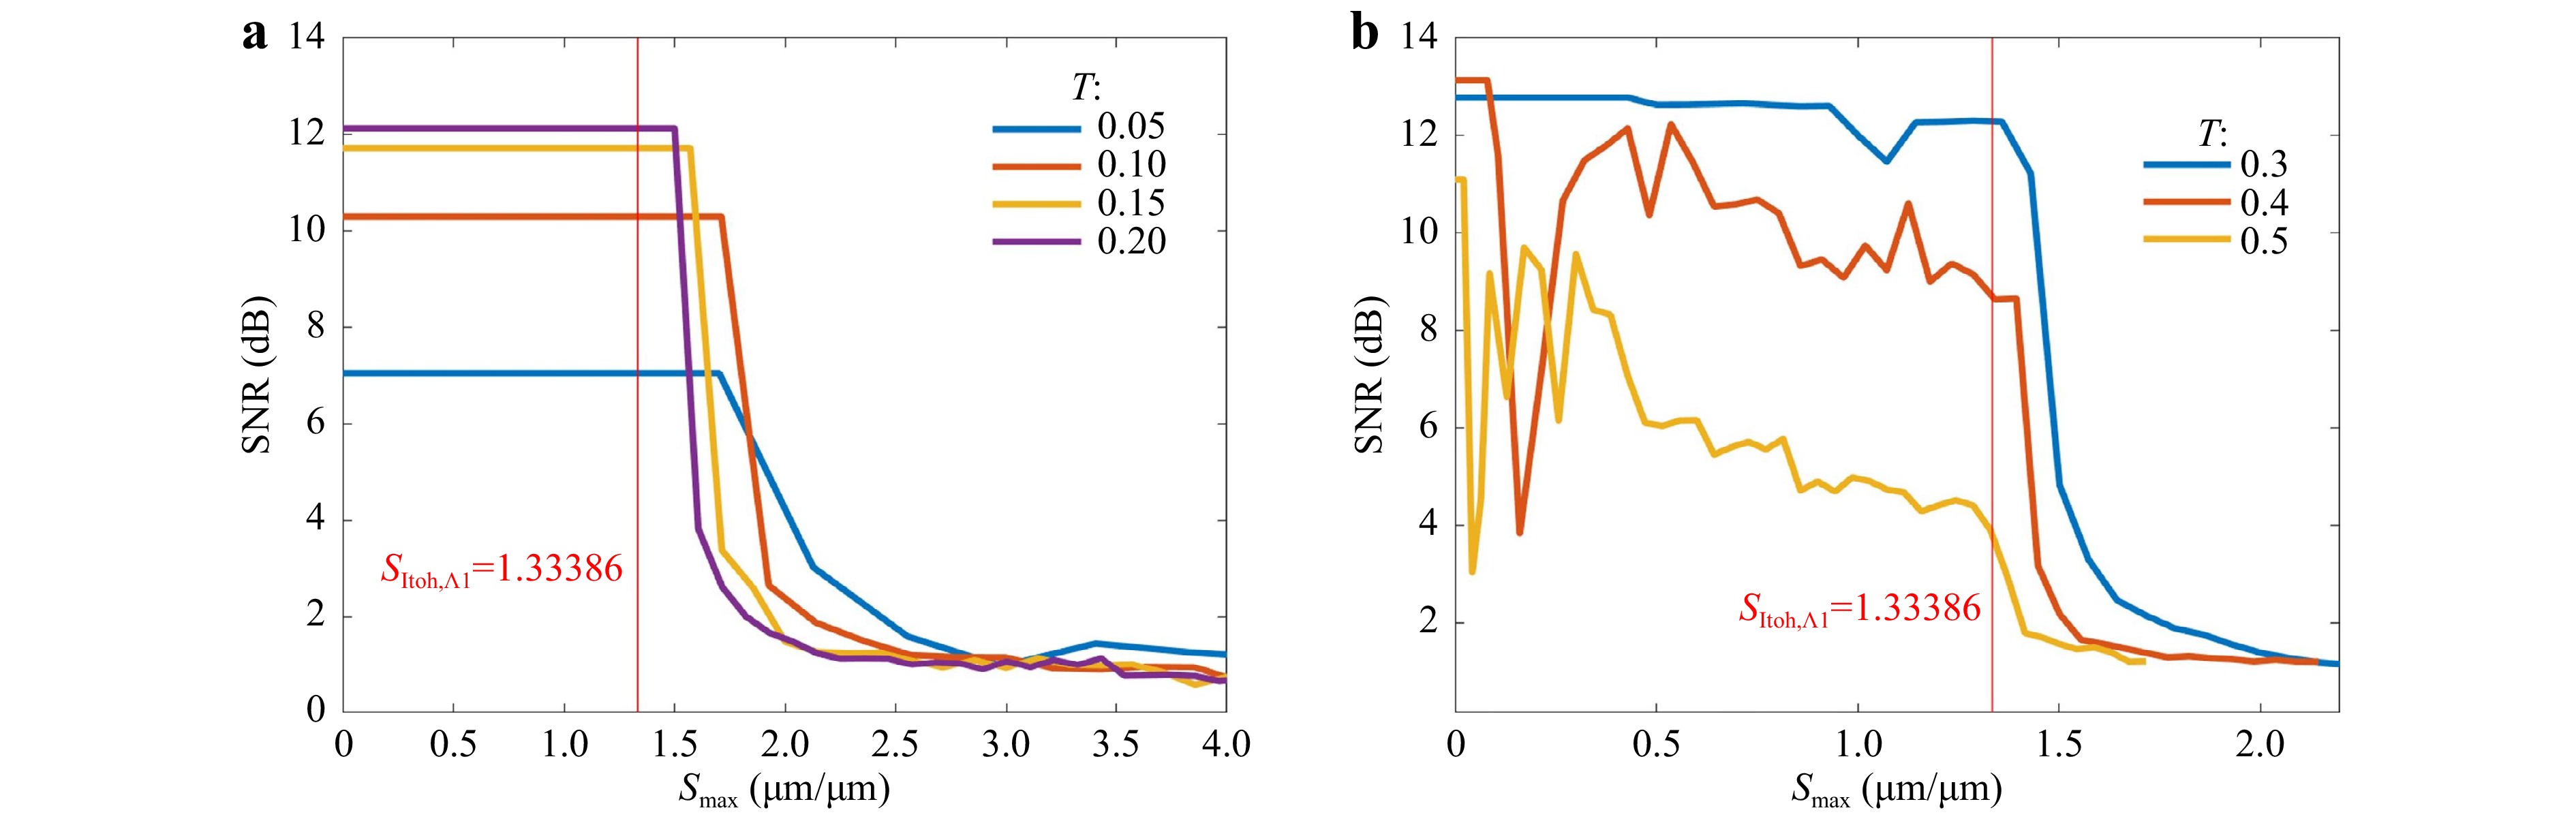
Fig. 10 The
$ SNR\;{\rm{vs}}\;{S}_{max} $ with dual wavelength measurement for different truncation ratios a T = 0.05, 0.10, 0.15 and 0.20 b T = 0.3, 0.4 and 0.5.Fig. 11 shows an actual and computed height profile when the two conditions (i.e. the Itoh condition and truncation condition) are met. Four Gaussian height profiles are placed in an array to mimic a physical object with surface variations. The output
$ SNR $ is ~12 dB for this simulation which represents successful unwrapping.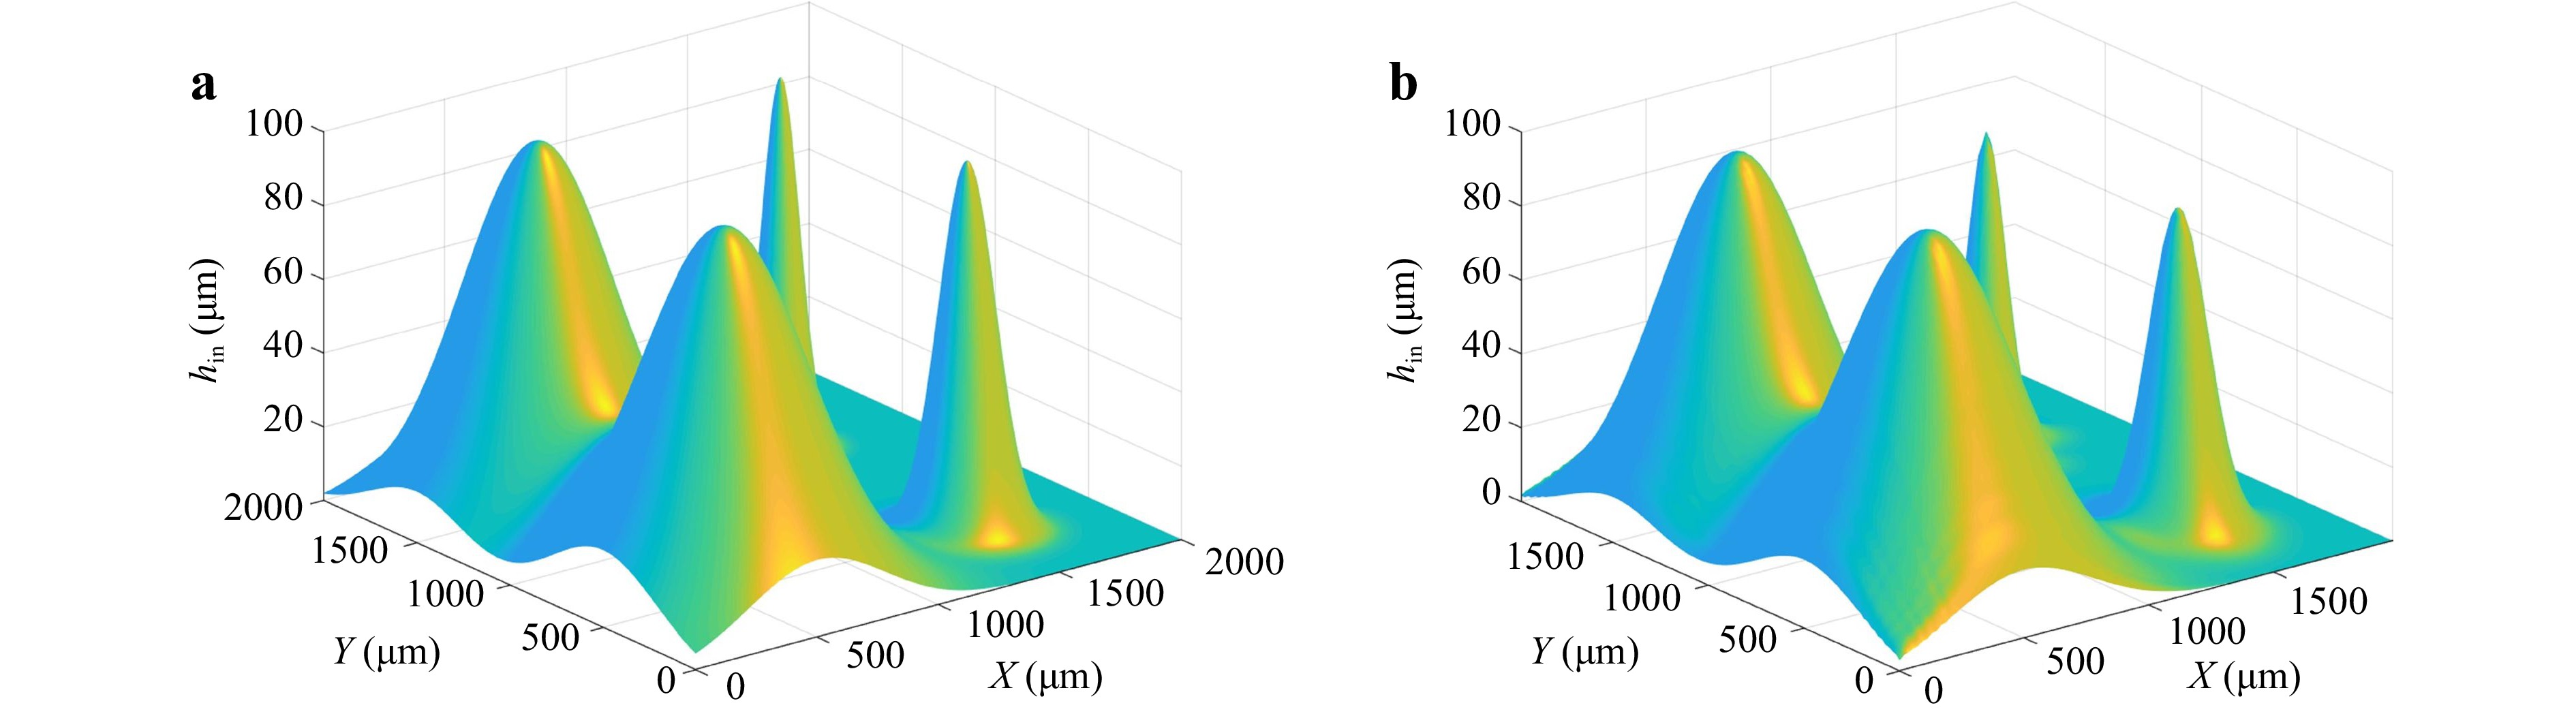
Fig. 11 a The actual input height profile and b the computed height profile using DWT. Both Itoh condition (
$ {{S}_{max} < S}_{Itoh} $ ) and truncation condition ($ 0.05 < T < 0.5 $ ) are met. Measured$ SNR $ is$ 12.1\;dB $ . -
Compared to SWT, DWT usually has a noisier performance30,68, since using the synthetic wavelength imposes an amplification to the noise. The error sources are briefly summarized here. Possible reasons for noises are wavelength drifts (linewidth of each of the illumination wavelength), chromatic aberrations, dispersion, speckle noise, speckle decorrelation noises, retrace errors, and air turbulence. The noise sources also become limiting factors to achieve very large unambiguous distance measurements experimentally. Currently, the reported achievable synthetic wavelengths are in the order of tens of centimeters78,114.
The stability of laser central wavelengths may not directly affect the noise performance, however, this effects the accuracy of the synthetic wavelength’s calculation139. The accuracy of the synthetic wavelength becomes essential especially for large synthetic wavelengths. Fabry–Perot etalons have been used to perform mode selection/stabilization at the laser output89. The expected error
$ {\sigma }_{\Lambda } $ in Λ due to wavelength selection can be determined using73$$ {{\sigma }_{\Lambda }}^{2}={\left(\frac{\partial \Lambda }{\partial {\lambda }_{1}}\right)}^{2}{{\sigma }_{{\lambda }_{1}}}^{2}+{\left(\frac{\partial \Lambda }{\partial {\lambda }_{2}}\right)}^{2}{{\sigma }_{{\lambda }_{2}}}^{2} $$ (22) where
$ {\sigma }_{{\lambda }_{1},{\lambda }_{2}} $ denote the errors in$ {\lambda }_{1},{\lambda }_{2} $ . This yields$$ {\left({\sigma }_{\Lambda }/{\Lambda }^{2}\right)}^{2}={\left({\sigma }_{{\lambda }_{1}}/{{\lambda }_{1}}^{2}\right)}^{2}+{\left({\sigma }_{{\lambda }_{2}}/{{\lambda }_{2}}^{2}\right)}^{2} $$ (23) indicating that the error increase quadratically with Λ, This wavelength selection error can lead to significant uncertainty in the synthetic wavelength as
$ {\lambda }_{1}\to {\lambda }_{2} $ . Thus, for short synthetic wavelengths, any single phase (height) measurement can be assumed to have reasonably high accuracy, limited primarily by shot and coherence noise66. However, wavelength drift errors quickly begin to dominate at long synthetic wavelengths. The fractional error, which is proportional to$ {\sigma }_{\Lambda }/\Lambda $ , increases linearly with Λ.For contribution to errors from the laser linewidth, since DWT usually has a small separation between different wavelengths, each of the illuminating lasers is supposed to have a narrow bandwidth. For SWT, the phase corresponding to a height h is given by
$ {\phi }_{\lambda }={2\pi h}/{\lambda } $ . Hence, the magnitude of error in phase is$ \left|{\delta \phi }_{\lambda }\right|={2\pi h}/{{\lambda }^{2}}\left|\delta \lambda \right| $ . Therefore, fractional error in measurement of phase is$ {\left|{\delta \phi }_{\lambda }\right|}/{{\phi }_{\lambda }}={({2\pi h}/{{\lambda }^{2}}})/{({2\pi h}/{\lambda })}\left|\delta \lambda \right|={\left|\delta \lambda \right|}/{\lambda } $ , where$ \left|\delta \lambda \right| $ may arise from the linewidth of the laser. In DWT, the phase corresponding to a height h is given by$ {\phi }_{\Lambda }={2\pi h}/{\Lambda } $ . Hence,$ \left|{d\phi }_{\Lambda }\right|={2\pi h}/{{\Lambda }^{2}}\left|\delta \Lambda \right| $ . The fractional error in measurement of phase is$ {\left|{\delta \phi }_{\Lambda }\right|}/{{\phi }_{\Lambda }}={\left|\delta \Lambda \right|}/{\Lambda } $ . We need to re-express this in terms of$ \left|\delta \lambda \right| $ for a fair comparison with the result for SWT. Now$ \Lambda ={{\lambda }_{1}{\lambda }_{2}}/({\left|{\lambda }_{1}{-\lambda }_{2}\right|})\approx {{\lambda }^{2}}/{\Delta \lambda } $ , as two similar wavelengths are commonly used. Then,$ d\Lambda =\left(({2\lambda \Delta \lambda -{\lambda }^{2}({d\Delta \lambda }/{d\lambda }}))/{{\left(\Delta \lambda \right)}^{2}}\right)d\lambda $ , and the magnitude of the maximum error is$ \left|\delta {\rm{\Lambda}}\right|=(({2\lambda \Delta \lambda +{\lambda }^{2}\left|{d\Delta \lambda }/{d\lambda }\right|})/ $ $ {{\left(\Delta \lambda \right)}^{2}})\left|\delta \lambda \right| $ . Therefore,$ {\left|{\delta \phi }_{\Lambda }\right|}/{{\phi }_{\Lambda }}={\left|\delta \Lambda \right|}/{\Lambda }=2{\left|\delta \lambda \right|}/{\lambda }+ $ $ \left|{d\Delta \lambda }/{d\lambda }\right|({\left|\delta \lambda \right|}/{\Delta \lambda }) $ . Note that$ \left|{d\Delta \lambda }/{d\lambda }\right| \sim 1 $ , since the change in$ \Delta \lambda =\left|{\lambda }_{1}{-\lambda }_{2}\right| $ is equal to the change in either wavelength$ {\lambda }_{1,2} $ . The ratio of the fractional error of DWT to that of SWT is$$ \frac{{Error}_{DWT}}{{Error}_{SWT}}=\frac{\dfrac{\left|{\delta \phi }_{\Lambda }\right|}{{\phi }_{\Lambda }}}{\dfrac{\left|{\delta \phi }_{\lambda }\right|}{{\phi }_{\lambda }}}=\frac{2\dfrac{\left|\delta \lambda \right|}{\lambda }+\dfrac{\left|\delta \lambda \right|}{\Delta \lambda }}{\dfrac{\left|\delta \lambda \right|}{\lambda }}=2+\frac{\lambda }{\Delta \lambda } $$ (24) Using
$ \lambda =500\;nm $ ,$ \Delta \lambda =20\;nm $ , Eq. 24 shows that the error in DWT due to laser linewidth is at least 25 times more than the error in SWT.The usage of more than one wavelength is usually accompanied with chromatic aberrations and dispersions in the optical system. These factors have also become the noise sources of DWT. Strategies have been proposed to correct chromatic aberrations. One way is to convert the wavelength-dependent phase term into the scaling effect in the lateral plane. As discussed in the “Principle of DWT” section, the pixel size at the reconstruction plane is rescaled by Eq. 11 and then matched for pixel-to-pixel subtraction with zero-padding (Eq. 12). The advantage of this method is it is convenient and easy to determine, but may suffer from the imperfection of pixel match. As shown in Eq. 12, due to the discrete nature of pixels, the calculation results of padsize need to be rounded to the nearest integer. This rounding process also contribute to the noise. This can be reduced by carefully selecting the number of pixels of the phase maps and also the wavelengths to make
$ {N}/{2}\left({{\lambda }_{1}}/{{\lambda }_{2}}-1\right) $ close to an integer in sacrifice of imposing another constrain to the wavelength selection. Thanks to the advancement of signal processing techniques, the matching issue can be resolved by rescaling the pixel size with chirped scaling algorithms and fast Fourier transform140,141. The other way to deal with the chromatic aberration is to digitally refocus the optical field of the corresponding wavelength to the focused plane18. The nature of chromatic aberration is that the focal plane is shifted along optical axis for different wavelengths. This can be interpreted as a spherical aberration is added to each of the wavelength. Since the intensity and phase of the complex field can be obtained by all the quantitative phase imaging methods, the digital propagation can be performed to refocus the complex optical field to the focal plane. This technique is easy to implement and free of pixel matching, but determining when the object is in focus is tricky and may vary among human visual identifications or different in-focus evaluation metrics142,143. The dispersion errors, as the other wavelength-dependent error source caused by the dispersion of optical components (e.g. beam splitter), can be monitored and managed by numerical algorithms mentioned above or by modeling the static dispersion of the optical components and compensating with numerical calculations15.Speckle noise exists in all coherent imaging techniques. Due to the noise amplification shortcoming of DWT, the speckle noise has been significantly amplified in DWT, especially for large synthetic wavelengths. Thus, to mitigate the speckle noise effect is of great importance. A common way to reduce the speckle noise in SWT is to take multiple shots and average them, or equivalently, using a rotating diffuser whose spinning period is much smaller than the camera’s exposure time. For DWT, averaging two phase difference maps is possible84. Other methods to reduce speckle noise in SWT144 can also be applied to DWT. As we discussed the speckle noise here, it is worth mentioning that the DWT can be applied to both diffuse or specular reflecting surfaces. We have used DWT with reference beams using diffuse surfaces such as screwheads, dents, fingerprints, etc. using synthetic wavelengths in the order of tens, hundreds and thousands of microns73,75,145, partly diffuse and partly specular surfaces such as silicon wafer samples with photoresist features coated with aluminum using synthetic wavelengths in the order of microns145, of as well as for (specular) reflecting surfaces, such as mirrors separated by distances in the order of centimeters using synthetic wavelengths in the order of tens of centimeters (achieved using acousto-optic modulators at 1 Ghz for frequency shifting)78.
Speaking of diffuse surfaces, the speckle decorrelation noise is common during diffuse surface measurement. There are a few possible origins of the speckle decorrelation noise: the modifications at the object surface between two measurements (e.g. mechanical shifts, heating), laser wavelength changes, reduced number of camera pixels, defocusing in reconstruction (mostly from inaccurate propagation distance), saturation of camera pixels in hologram recording, insufficient bit-depth of the camera (shot noise induced) and so on146-150. For DWT, the major cause of speckle decorrelation noise in diffuse surface measurement is from recording two holograms with two different wavelengths. Possible ways of reducing the speckle decorrelation noises are: averaging over multiple captures148, or digital filtering. Numerous digital filtering techniques have been proposed to reduce the speckle decorrelation noise: spatial filtering (viz., moving average filter, medium filter, Gaussian filter), Wiener filter, adaptive filter151, wavelet approaches152,153, and so on. An exhaustive performance analysis and comparison among these digital filter techniques (a number of 34 algorithms) in reducing speckle decorrelation noise have been made quantitatively by Montresor and Picart150. Retrace errors, existing in specular surface testing, are due to presence of nonnull aspherical surface during interferometric testing, and specially in systems like the traditional interferometers, where the test surface is at a focal distance past the focus of a perfect focusing lens. This type of noise can be calibrated by ray tracing the testing system model19,154. Air turbulence is another source of noise. The turbulence in air can lead to the inhomogeneous distribution of refractive index in space. This non-uniform distribution will add different phase maps to the object and reference beam phases. Currently, no perfect solution has been proposed to solve this issue. One potential way to compensate for air turbulence is to store a hologram of the turbulence and read it out with the optical field from the object under investigation that passes through the same turbulence155. Other correction methods using sharpness metrics have also been employed in DH and in holographic aperture ladar156,157. The other way can possibly be using adaptive optics methods to compensate the turbulence induced phase in real-time158-161. Attempts have been made to compensate for errors introduced due to non-uniform and random refractive index changes of air with post processing of data from holographic interferometry measurements. One approach, which uses a purely temporal interference filter, reduced the noise from the refractive index errors from air disturbance over a rather limited spatial region162. A more complete spatio-temporal filter requires that the spatio-temporal statistics of the noise from the air can be measured163. The method has been applied to the case of locally homogenous/isotropic refractive index fluctuations in a wind tunnel.
-
In this paper, we have reviewed the early and recent developments of DWT and its applications in different scenarios. The essence of DWT is to employ an extra wavelength in the imaging process and form a large synthetic wavelength. The significant advantage of the synthetic wavelength is to avoid the phase ambiguity in the phase retrieval and phase unwrapping. This feature can extend the measurement ability from optical wavelength scale to tens of centimeters scale. In the meantime, with the help of fringe subdivision method, DWT can also achieve nanometer-level accuracy in 3D topography. The large measurement dynamic range is appealing to numerous industry applications. For high-throughput applications, single-shot DWT has been achieved by using spectra-multiplexing, polarization-multiplexing, or different color channels of a color camera. For early developments and applications of DWT, the technique mainly focuses on the implementation in holography and interferometry. With fast advances in 3D/phase coherent imaging techniques, DWT can also be adapted to various novel optical modalities, viz. CDI, ptychography, aperture-scanning Fourier ptychography, non-line-of-sight imaging, etc. In this review, a comprehensive summary of DWT performance and error sources is made. Error sources from such as system design (Itoh condition), wavelength drift, chromatic aberration, dispersion, speckle noises, retrace errors, and air turbulence, have been discussed. Also, the existing or potential correction and compensation methods have been pointed out.
The unambiguity range measurements with DWT, as mentioned before, can be varied from nanometer scale to tens of centimeters scale with synthetic wavelengths from micro level to tens of centimeters level. These measurement ranges can satisfy most of the industry applications. For even larger height jumps (meter scale), structured light techniques, time-of-flight, or FPP techniques can be adopted. The future direction of DWT, instead of increasing the synthetic wavelength, should aim to achieve large unambiguous height measurement range and high accuracy at the same time, i.e. a kind of low-noise DWTs. This is critical to phase imaging and 3D topography, and its biomedical or industry applications. One potential way to fulfill the demand for large unambiguous height measurement and high accuracy simultaneously is to employ the idea of phase sum, as discussed in the “Principle of DWT” section. This idea was implemented five decades ago in holography and interferometry36-38, and recently only used in FPP43. No recent work has reported its application in holography, interferometry or any other coherent imaging techniques. Further investigations on phase sum and difference usage can be done to achieve high sensitivity and large unambiguous measurement range. Another direction to establish low-noise DWT is to minimize the noises from different noises sources. As discussed in the “Noise performance” section, there are some error sources that can be solved with reported method, but air turbulence remains a challenge. Adaptive optics methods can potentially help with the turbulence correction in real time. Instead of real-time correction, the other way to compensate turbulence can be to fix the fluctuation first, and then correct it. Speckle interferometry can freeze the turbulence variations in short exposure time164. DWT can also be applied to speckle interferometry. Two-wavelength microscopic speckle interferometry using a single-chip color camera for characterization of micro level samples has been demonstrated by Upputuri et al.165. The system allows quantification of large deformations and shapes of specimens with a rough surface. Further research, such as dealing with air turbulence with the help of speckle imaging, should be considered.
From an application perspective, DWT can be adapted to different novel optical modalities. Aperture scanning type Fourier ptychography together with DWT, as an example, using a LED source and appropriate band-pass filters has been proposed for topographic measurement136. The use of DWT extends the axial measurement range, provides a speckle-free phase image, and reduces the possibility of a systematic error, which yields a high-quality topographic image. The proposed system can measure the surface topography of nano- to micro-structures. Because the LED has a relatively wide spectral bandwidth, it is easy to obtain the two wavelengths required for the proposed method by applying appropriate bandpass filters. Need to mention that other aperture scanning type Fourier ptychography modalities166 can also be used to implement DWT; however, angular illuminated Fourier ptychography may not be suitable for thick samples. Another example is non-iterative coherent complex imaging based on Kramers-Kronig relations. The methodology has been recently proposed and developed167. It can achieve large space-bandwidth-product with non-iterative reconstruction and a minimum of two captures168. This newly proposed method can be a good candidate for topography applications with DWT.
Some other non-traditional applications and future directions are now discussed. DWT can potentially be used for aberration corrections. This recent work by Willomitzer et al.77 is inspired by Gabor’s original idea of “analysis, synthesis, and correction” for improving the resolution of electron microscopes. Gabor envisioned recording electron waves with aberrated electron microscope optics (analysis at electron wavelength
$ {\lambda }_{e} $ ), then reconstructing this electron image by playing the hologram back with an optical wave (synthesis at optical wavelength$ {\lambda \gg \lambda }_{e} $ ) while exploiting optical wavefront correction (correction, at wavelength λ). Likewise, DWT can be used to correct unknown wavefront aberrations introduced when visible light is transported through scenes with strong scattering. By capturing two holograms at two closely spaced wavelengths (analysis), each showing random aberrations and computationally beating the two signals together, a low frequency synthetic wavelength hologram (correction) can be achieved. The synthetic wavelength hologram, which contains information of the order of the synthetic wavelength Λ, is virtually impervious to the effects of scattering at the optical wavelengths. Similar to Gabor’s idea, during synthesis, the object is reconstructed by playing back the computationally corrected hologram with the much larger synthetic wavelength Λ. As shown by Willomitzer et al.77, DWT also potentially offers a “novel solution to image hidden objects through scatters or non-line-of-sight geometries at the physical space-bandwidth limit”. By applying full-field lock-in detector technology, it is possible to capture a synthetic hologram of the hidden object within milliseconds. Since the synthetic wavelength can be readily changed, the captured hologram provides a window to fully reconstruct the 3D light field of the hidden scene at high space-bandwidth-product. The idea of DWT may also be implemented in holography with applications in dynamic interferometry, beam-steering, holographic display etc. Here are some additional thoughts listed:(a) one can write a hologram at one wavelength and reconstruct at certain shifted wavelength, for dynamic interferometry. Optically addressed liquid crystal spatial light modulators can be used to record thin dynamic holograms for dynamic two-wavelength holography159. One can thus realize a dynamic interferometer, providing arbitrary scaling of the wavefront distortions. Such interferometers can be useful in adaptive optics, viz., for simplification in measurement of wavefront distortions, for recording of dynamic holographic correctors, working in spectral ranges where direct holographic recording is impossible, in particular, mid-IR, etc.;
(b) another idea is writing a transmission grating at one wavelength in a volume holographic recording medium (e.g., photorefractive material), and reading out using a longer wavelength in a reflection grating geometry, with possible applications in beam-steering169, image processing, etc.
A review of the dual-wavelength technique for phase imaging and 3D topography
- Light: Advanced Manufacturing 3, Article number: (2022)
- Received: 01 September 2021
- Revised: 28 January 2022
- Accepted: 15 February 2022 Published online: 02 April 2022
doi: https://doi.org/10.37188/lam.2022.017
Abstract: Optically transmissive and reflective objects may have varying surface profiles, which translate to arbitrary phase profiles for light either transmitted through or reflected from the object. For high-throughput applications, resolving arbitrary phases and absolute heights is a key problem. To extend the ability of measuring absolute phase jumps in existing 3D imaging techniques, the dual-wavelength concept, proposed in late 1800s, has been developed in the last few decades. By adopting an extra wavelength in measurements, a synthetic wavelength, usually larger than each of the single wavelengths, can be simulated to extract large phases or height variations from micron-level to tens of centimeters scale. We review a brief history of the developments in the dual-wavelength technique and present the methodology of this technique for using the phase difference and/or the phase sum. Various applications of the dual-wavelength technique are discussed, including height feature extraction from micron scale to centimeter scale in holography and interferometry, single-shot dual-wavelength digital holography for high-speed imaging, nanometer height resolution with fringe subdivision method, and applications in other novel phase imaging techniques and optical modalities. The noise sources for dual-wavelength techniques for phase imaging and 3D topography are discussed, and potential ways to reduce or remove the noise are mentioned.
Research Summary
Dual Wavelength Technique: a convenient way to measure large optical phases
Using optical illumination at two different wavelengths, a synthetic wavelength can be simulated to extract large phases, or height variations from microns to centimeters. This is because optically transmissive/reflective objects may have varying surface profiles, which may translate to arbitrary optical phase profiles. The dual wavelength technique can be adapted to coherent diffractive imaging, ptychography, non-line-of-sight imaging, etc. A summary of the performance of the dual wavelength technique is presented, including error sources from the sampling limit (Itoh condition), wavelength drift, chromatic aberration, dispersion, speckle, retrace errors, and air turbulence.


Rights and permissions
Open Access This article is licensed under a Creative Commons Attribution 4.0 International License, which permits use, sharing, adaptation, distribution and reproduction in any medium or format, as long as you give appropriate credit to the original author(s) and the source, provide a link to the Creative Commons license, and indicate if changes were made. The images or other third party material in this article are included in the article′s Creative Commons license, unless indicated otherwise in a credit line to the material. If material is not included in the article′s Creative Commons license and your intended use is not permitted by statutory regulation or exceeds the permitted use, you will need to obtain permission directly from the copyright holder. To view a copy of this license, visit http://creativecommons.org/licenses/by/4.0/.

 DownLoad: