


-
Trace gas sensors are used in different fields1-5. Laser spectroscopy offers the advantages of high sensitivity and selectivity6-9. With advancement of laser techniques, trace gas detection methods based on laser-absorption spectroscopy are constantly developed and improved10-14. Tunable diode laser-absorption spectroscopy (TDLAS), photoacoustic spectroscopy (PAS), quartz-enhanced photoacoustic spectroscopy (QEPAS), and light-induced thermoelastic spectroscopy (LITES) have attracted extensive research attention15-23. Compared with TDLAS and QEPAS, LITES technology has extremely high sensitivity and offers non-contact measurement21-28.
LITES was invented in 2018 by Ma et al.24 When a modulated laser irradiates a quartz tuning fork (QTF) after gas absorption, the QTF partly absorbs laser energy and converts it into an electrical signal through its light-induced thermoelasticity and piezoelectricity25. In general, the electrical signal amplitude increases linearly with an increase in laser power27,28. However, thermal noise caused by laser irradiation in electrical signals magnifies exponentially as the laser power increases; thus, the signal-to-noise ratio (SNR) and minimum detection limit (MDL) of a LITES sensor are restricted by thermal noise28. A potential solution is demodulating the vibration of the QTF in place of the electrical signal.
Optical interferometers such as the Michelson interferometer, Mach–Zehnder interferometer, and Fabry–Perot (F–P) interferometer (FPI) are safe, remote, sensitive, anti-electromagnetic interference measurement devices for micro-vibration. The FPI is preferred because it has a simple structure, low cost, high sensitivity, and a single probe. Using FPIs as vibration detectors in PAS, QEPAS and LITES has been demonstrated to be effective29-34. For F–P micro-vibration sensors, the intensity demodulation method is typically used as it can respond to rapid signals and is easy to operate35. However, there are some limitations; the vibration (ΔL) must be in the linear region of the interference spectrum and the probe laser wavelength must be located at the quadrature working point (Q-point) for the highest sensitivity. Owing to ambient interference and disturbance of the laser wavelength, the Q-point drifts continuously and the signal becomes unstable. Thus, the Q-point must be frequently recalculated and the probe laser wavelength must be frequently tuned. Several algorithms have been used, including Q-point stabilised technology32-34. With algorithms to stabilise the sensors, the entire system becomes more complex, increasing the number of device constraints.
In this study, F–P-based phase demodulation of heterodyne LITES (H-LITES) is reported for the first time. In contrast to traditional LITES, to prevent thermal noise in electrical signals caused by the QTF, an FPI with an end-face of a single-mode optical fibre (SMF) and a side of the QTF prong was used to measure the periodic vibration of the QTF. With QTF vibration, the length of the F–P cavity changes, resulting in a shift in the FPI phase. The QTF vibration was determined by demodulating the FPI phase. The relationship between the phase and the micro-vibration of the FPI was theoretically and experimentally demonstrated to be linear. It was verified that the phase of the FPI was only related to the micro-vibration, independent of the probe laser power and wavelength, in contrast to the intensity demodulation method. Compared with a traditional intensity demodulation system, this new method of phase demodulation is structurally simple and resistant to interference from light sources and the surroundings.
-
In QTF-based laser-absorption spectroscopy, the deflections of QTF prongs are probably on the order of nanometres, much smaller than the length of the QTF prongs (3.6 mm). Thus, a configuration with an end-face of an SMF and a side of a prong of the QTF can be regarded as a plane-parallel cavity, known as an F–P cavity, as shown in Fig. 1. The laser is reflected back and forth by the end-face of the SMF and the side of the QTF. According to Fresnel reflection, the reflectivity (R) of the F–P cavity was calculated as approximately 0.09. Consequently, the multiple-beam interference was approximately equivalent to the double-beam interference. The reflected laser intensity of the double-beam interference can be expressed as
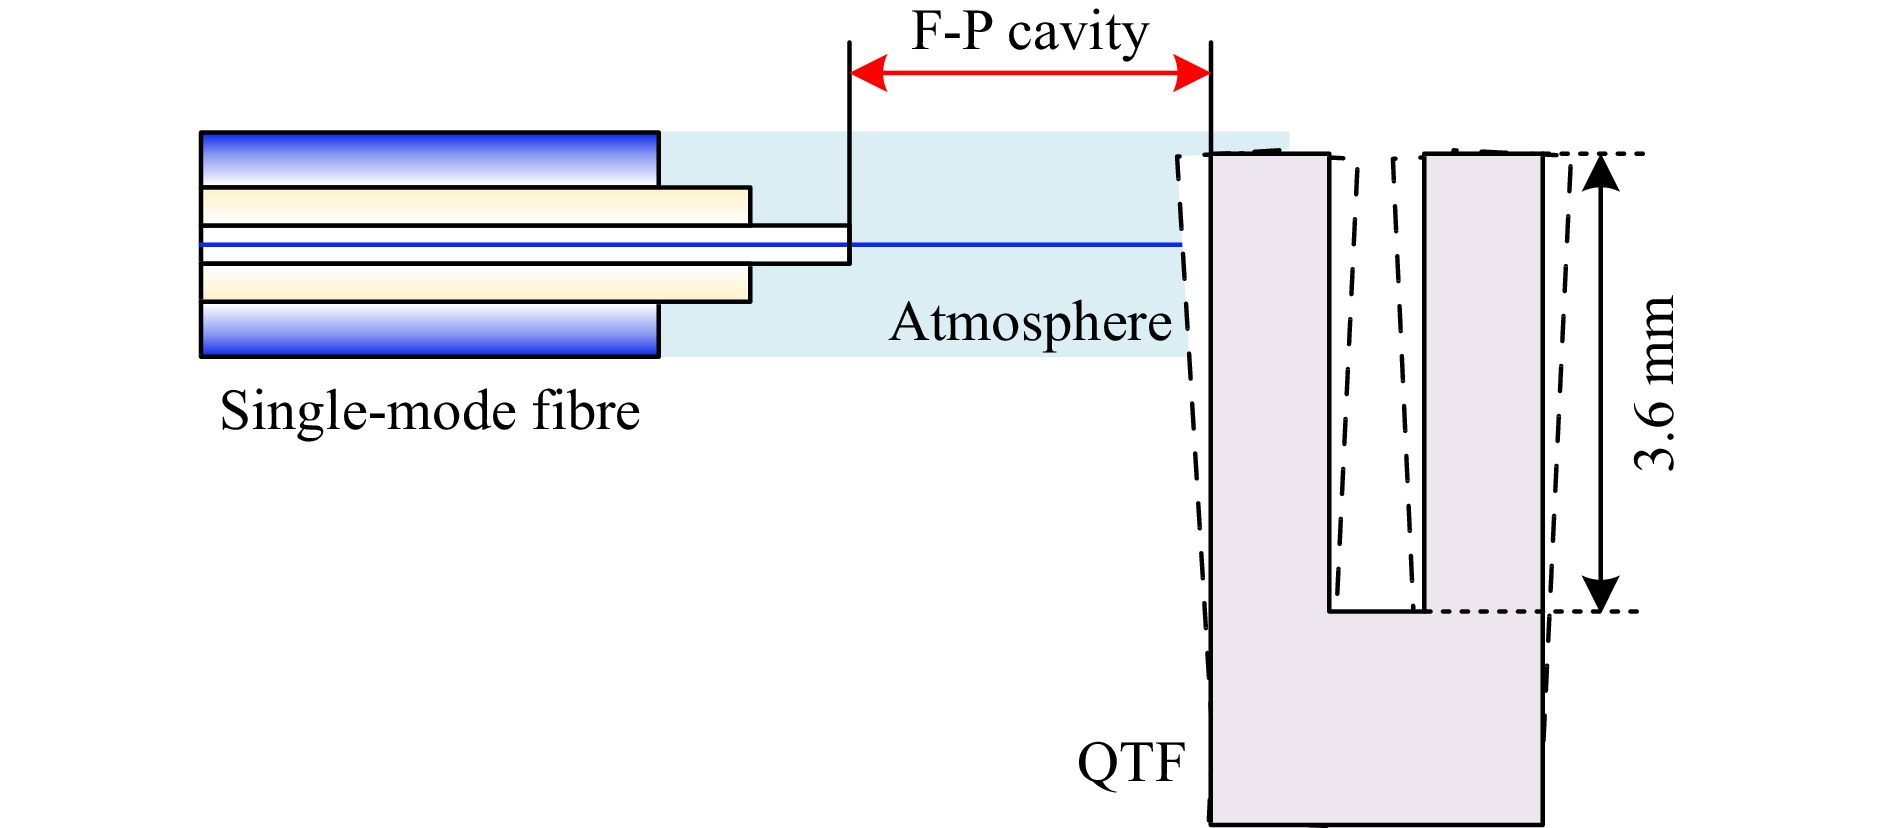
Fig. 1 Configuration of F–P cavity.
$$ {I}_{R}=2R{I}_{0}[1-\mathit{cos}(\varphi )] $$ (1) where $ {I}_{R} $ is the reflected laser intensity; $ {I}_{0} $ is the incident laser intensity, and $ \varphi $ is the phase difference created by the optical path difference (OPD) between two reflected laser beams, expressed as
$$ \varphi =\frac{4\pi L}{\lambda } $$ (2) where $ L $ is the F–P cavity length, approximately 70 μm in this study; $ \lambda $ is the incident laser wavelength, varying from 1530–1560 nm. When the QTF vibrates due to the effect of light-induced thermoelasticity, L varies and the free spectral range (FSR) changes. The interference spectrum drifts with $ \lambda $ reciprocally, creating wavelength drifts ($ \Delta \lambda $). If the tuning wavelength range of the probe laser is much smaller than the central wavelength ($ {\lambda }_{0} $), the FSR of the F–P cavity, $ \Delta \lambda $, and FSR drifts ($ \Delta FSR $) can be characterised as
$$ FSR=\frac{{\lambda }^{2}}{2L}=\frac{{\lambda }_{0}^{2}}{2L} $$ (3) $$ \Delta \lambda =-\frac{\Delta L}{L}\lambda =-\frac{\Delta L}{L}{\lambda }_{0} $$ (4) $$ \Delta FSR=\frac{{\lambda }_{0}^{2}}{2}\left(\frac{1}{L+\Delta L}-\frac{1}{L}\right) $$ (5) where $ \Delta L $ is the change in the F–P cavity, usually on the order of nanometres. It is far smaller than L; $ {1}/({L+\Delta L}) $ can be regarded as equal to $ {1}/{L} $. Thus, $ \Delta FSR $ is considered to be zero and the FSR can be regarded as a constant. Because $ 4\pi L\gg \lambda $ and $ \lambda \gg \Delta \lambda $, $ \varphi $ is considered to be constant, equal to $ 4\pi L/{\lambda }_{0} $. The drift interference spectrum can be described as
$$ {I'_{R}}=2R{I}_{0}\left[1-\mathit{cos}\left(\frac{4\pi L}{\lambda }+\Delta \varphi \right)\right]=2R{I}_{0}\left[1-\mathit{cos}\left(\frac{4\pi L}{{\lambda }_{0}}+\Delta \varphi \right)\right] $$ (6) where $ \Delta \varphi $ is the variation in phase difference between two reflected laser beams resulting from vibration of the QTF, expressed as
$$ \Delta \varphi =\frac{2\pi \Delta \lambda }{FSR}=-\frac{4\pi }{{\lambda }_{0}}\Delta L $$ (7) When $ {\lambda }_{0} $is fixed, $ \Delta \varphi $ is only related to $ \Delta L $, unaffected by the wavelength and power of the probe laser, which differ from the change in reflected laser intensity. Because the vibration of the QTF is proportional to the gas concentration, the concentration can be inverted linearly by demodulating $ \Delta \varphi $.
-
The experimental setup for F–P-based phase demodulation of H-LITES is shown in Fig. 2. Electrical and F–P demodulation systems were used non-synchronously, indicated by the dashed line in Fig. 2. The electrical signal derived from the piezoelectric effect of the QTF was obtained via electrical demodulation. The F–P demodulation system contained a probe laser, circulator, couple, SMF, and photodetector (PD). Using the intensity and phase demodulation methods, the intensity and phase in an F–P demodulation system can be determined. Acetylene (C2H2) with a concentration of 20000 ppm was used to verify the performance of the proposed sensor. According to the HITRAN 2020 database, a strong absorption line with a line-strength (S) of 1.2×10⁻²⁰ cm−1/(mol·cm−2) at 6534.37 cm−1 (1530.37 nm) was selected36. Wavelength modulation spectroscopy (WMS) and first-harmonic (1f) heterodyne phase detection were performed. Commercially available QTFs with a resonance frequency (f0) of 32.768 kHz (in a vacuum) were used in the experiments. A continuous-wave, distributed-feedback (CW–DFB) fibre-coupled diode laser with a centre wavelength of 1.53 μm and a power of 10.3 mW was used as an excitation source. Its output wavelength was tuned using a laser controller to alter the temperature and injected current. The wavelength-modulated signals consisted of two components: a variant sawtooth of 250 mHz generated by a function generator, and a high-frequency sinusoidal wave of f0 produced by a lock-in amplifier. The variant sawtooth was scanned across the targeted gas absorption line and maintained at a constant value to complete signal detection. The modulated laser beam exiting the diode laser was collimated using a fibre-coupled collimator (FC) and passed through an absorption cell with a length of 20 cm. Both end-faces of the absorption cell were equipped with wedged CaF2 windows to prevent optical interference. A lens with a focal length of 20 mm was used to focus the laser beam on the root of the QTF, generating the strongest light-induced thermoelastic effect. A C-band tunable diode laser was used as the probe laser with a tunable wavelength range of 38 nm and a tunable power range from 5–20 mW. The laser emitted from the C-band-tunable diode was sent into a fibre-coupled optical circulator to separate the incident and reflected lasers. Owing to photothermoelastic energy conversion, the prongs of the QTF vibrated at the resonant frequency (f0) when the gas was absorbed. With vibration of the QTF, the length of the F–P cavity changed with f0, resulting in a shift in the FPI phase difference with f0, as described in Principle. Using a lock-in amplifier to demodulate the phase of reflected laser intensity detected by the PD, the vibration of the QTF was determined and the C2H2 concentration could be inverted.
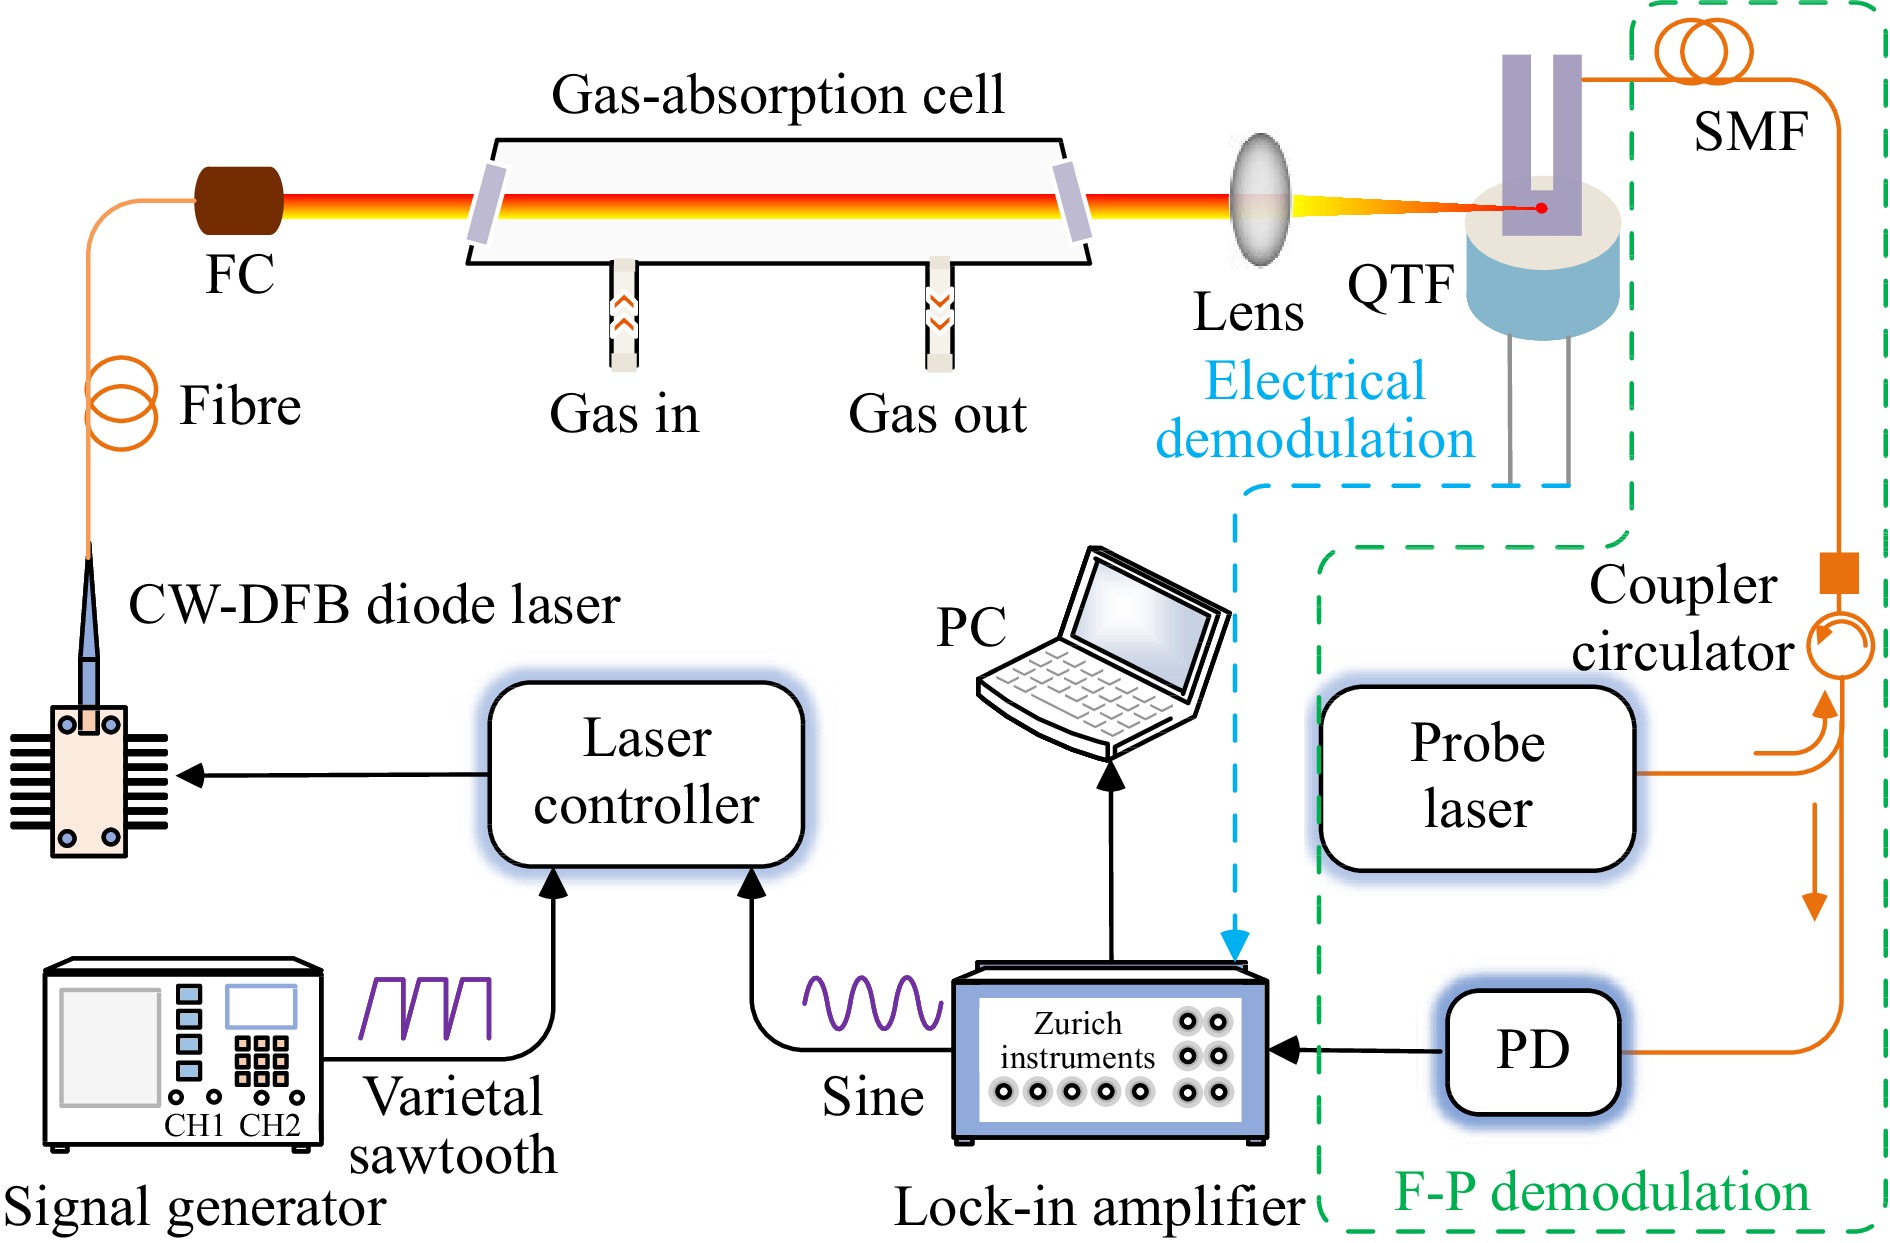
Fig. 2 Diagram of experimental setup: CW-DFB (continuous-wave distributed feedback); FC (fibre collimator); PD (photodetector); QTF (quartz tuning fork); SMF (single-mode fibre).
-
In LITES, f0 should generally be 1/n times the laser modulation frequency for the best sensor performance (where n is the harmonic order). A shift in f0 significantly alters the detection performance of the LITES sensor. Thus, real-time monitoring and adjustment of f0 are crucial. In H-LITES, there is a frequency difference (Δf) between the modulation frequencies (f) and f0. When the laser wavelength is modulated to sweep the gas-absorption line at a high rate, the transient response of the QTF becomes dominant, and the QTF vibrates at f. When the laser wavelength is far from the gas absorption line, the transient response of the QTF disappears, and the QTF begins to vibrate freely at f0. Because the two vibration frequencies are intertwined, a heterodyne signal is generated by demodulating the response of the QTF at f37-40. The gas concentration, f0, and quality factor (Q) of the QTF can be obtained simultaneously by detecting the signal. Because the 1f H-LITES signal had the largest amplitude, 1f harmonic demodulation was performed in the experiment. The performance of the H-LITES sensor is related to the laser modulation frequency, modulation depth, laser wavelength scan rise time, amplitude, and detection bandwidth of the lock-in amplifier. These parameters were optimised to improve the H-LITES signal by directly using the electrical signal from the QTF.
The frequency–response curve of the QTF was accurately measured in advance using the laser excitation method, as shown in Fig. 3. The resonance frequency f0 = 32753.17 Hz and bandwidth Δf0 = 3.05 Hz were determined using Lorentz fitting. According to the definition Q = f0/Δf0, Q was calculated as 10738.74. Optimisation of the modulation frequency within f0 ±20 Hz was conducted, as shown in Fig. 4, with a modulation voltage of 289.4 mV, laser wavelength scan time of 0.3423 s, amplitude of 0.3 V, and detection bandwidth of 7.959 dB. Using 1f-WMS in H-LITES, a background baseline proportional to the laser intensity was superimposed on the signal. To eliminate the impact of the background baseline, the peak-to-peak signal of 1f H-LITES was defined as the signal amplitude in subsequent investigations. As shown in Fig. 4, during continuous and rapid laser wavelength scanning, the obtained signal with a resonance curve envelope is weak far from f0 owing to a small response, and decreases approaching f0 because the heterodyne signal requires a certain frequency difference. When Δf was 6 Hz, the signal amplitude of 1f H-LITES reached its maximum, as shown in Fig. 4. In the following investigations, the optimum Δf (6 Hz) was used.
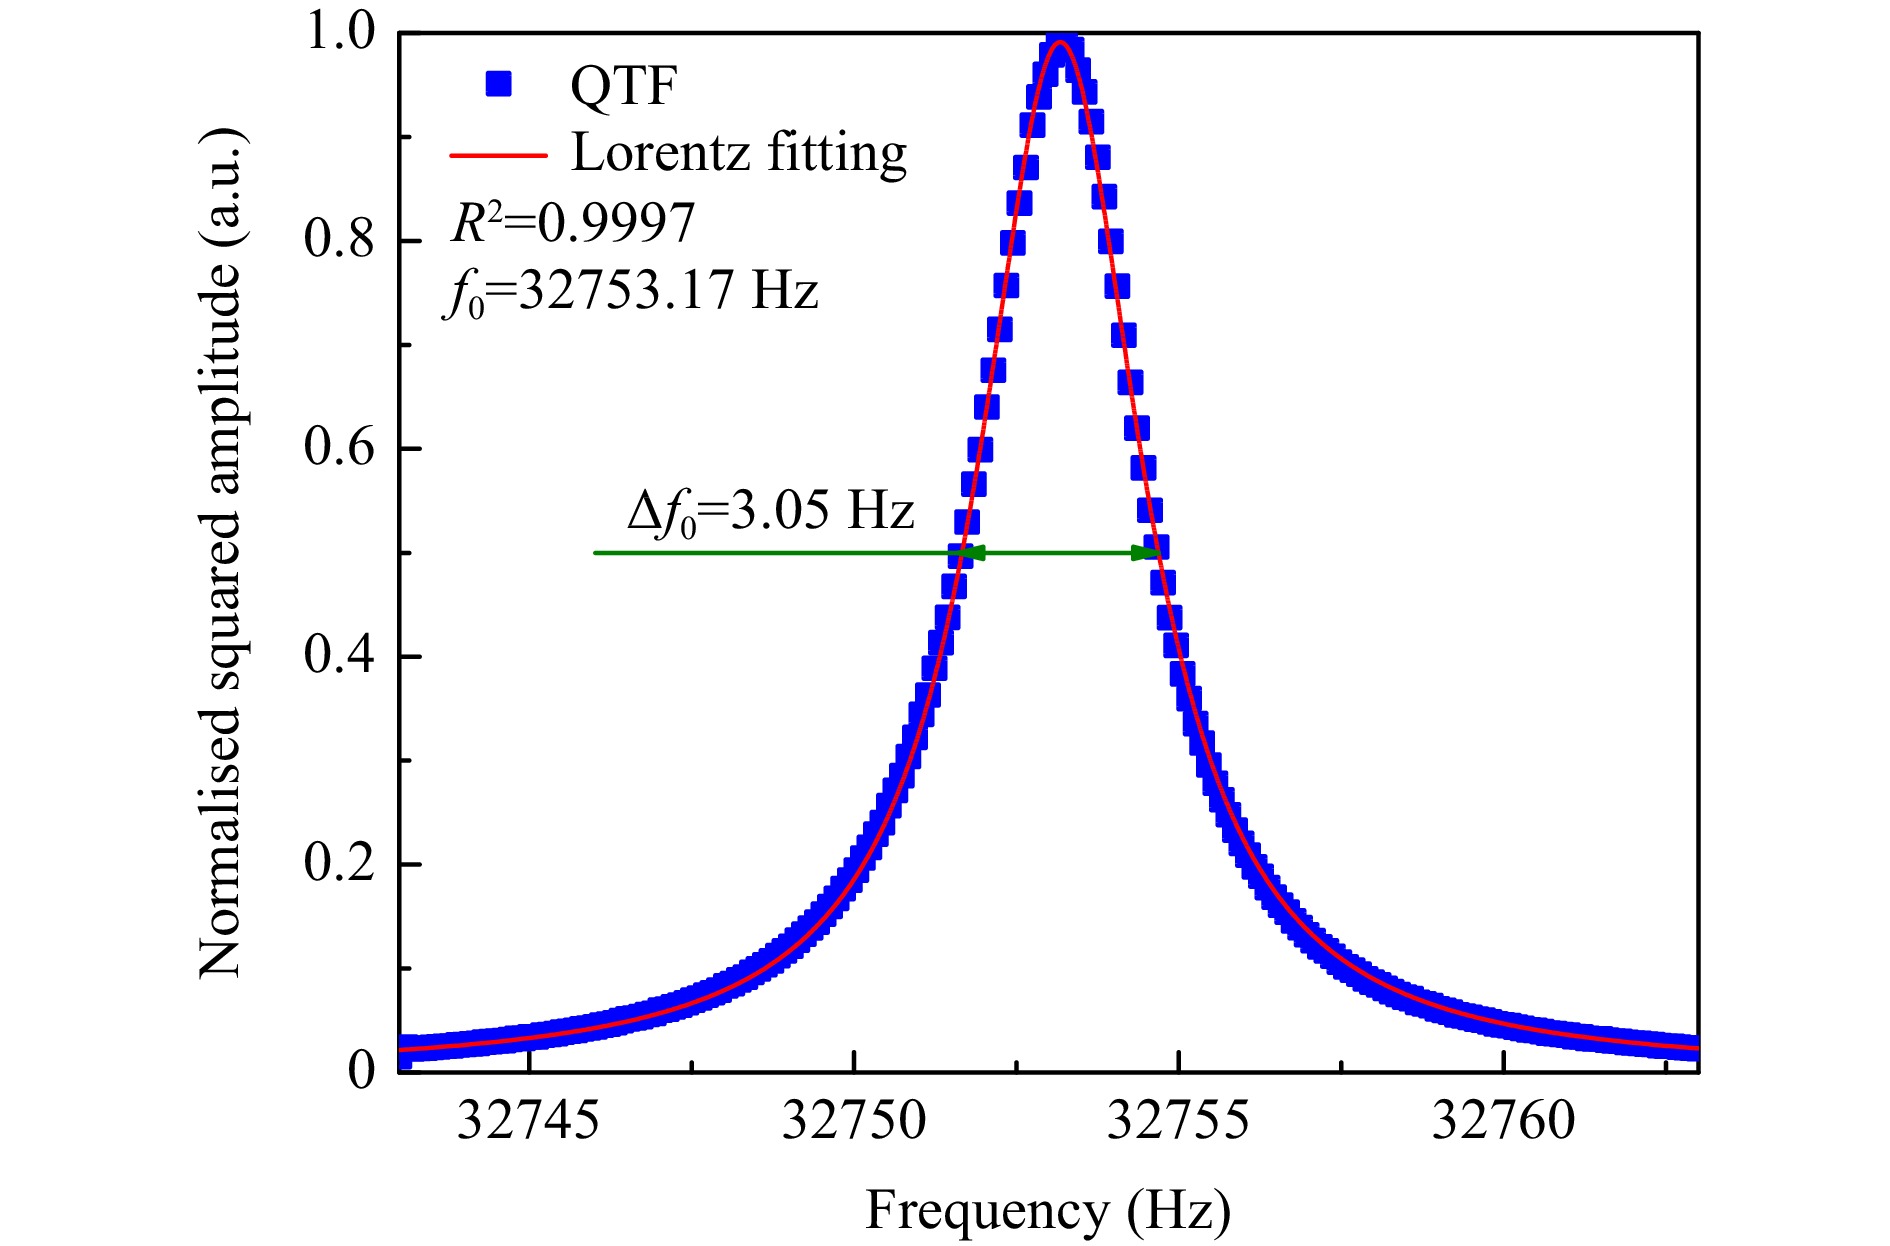
Fig. 3 Frequency response curve of QTF (a.u., arbitrary units).
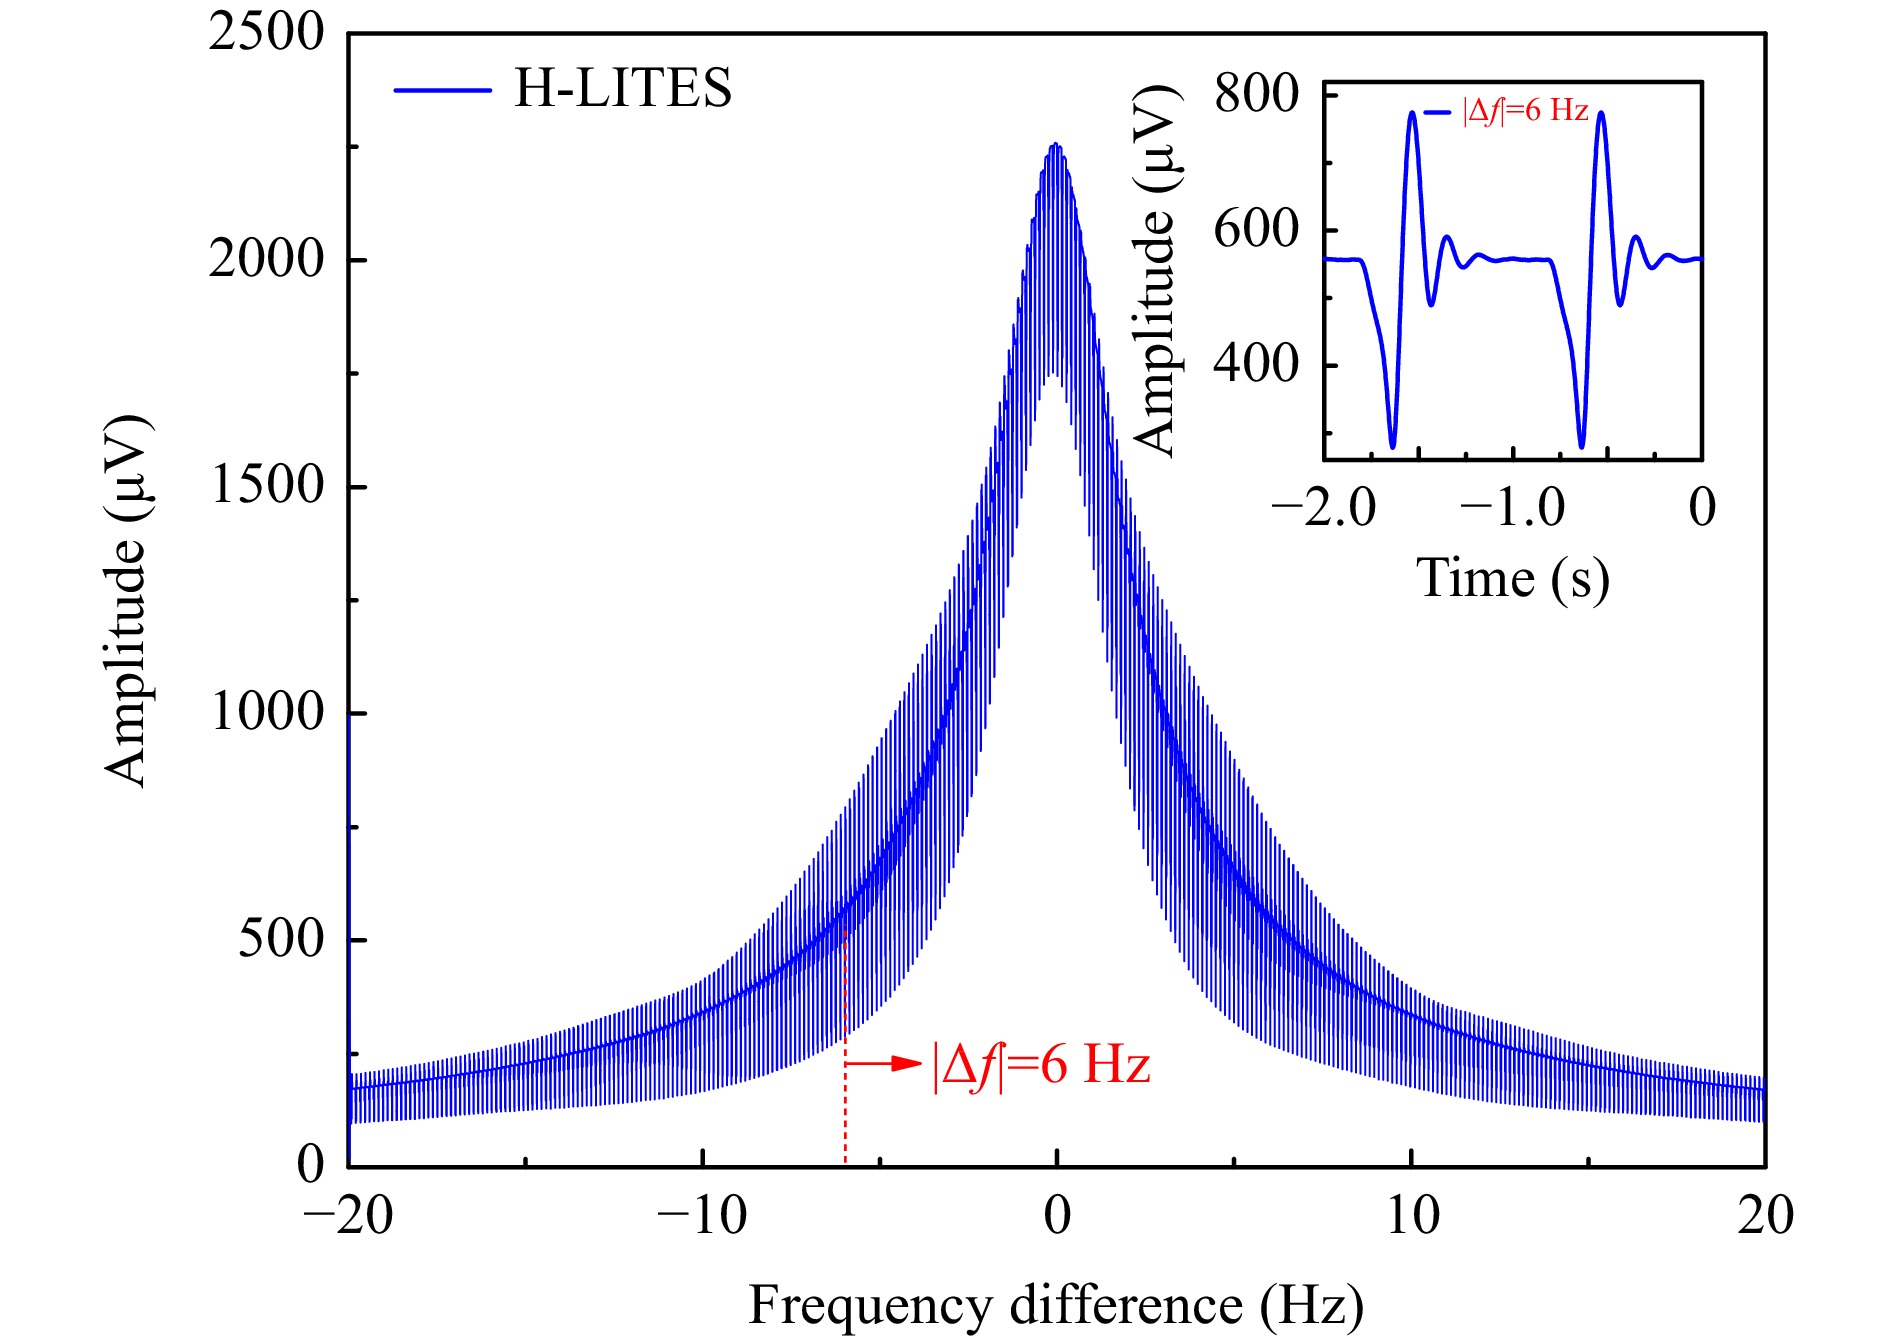
Fig. 4 Optimisation of modulation frequency within f0 ±20 Hz.
The amplitude of the 1f H-LITES system has a significant relationship with the laser wavelength modulation current and depth. Thus, the influence of the modulation current on the 1f H-LITES system was investigated; the results are presented in Fig. 5. The peak-to-peak amplitude of the 1f H-LITES signal initially increased with the modulation current and then began to decrease. The peak-to-peak amplitude with a modulation current ranging from 20–30 mA is shown in Fig. 5b. The maximum peak-to-peak amplitude was reached when the modulation current was 26 mA; the corresponding 1f H-LITES signal is shown in Fig. 5b.
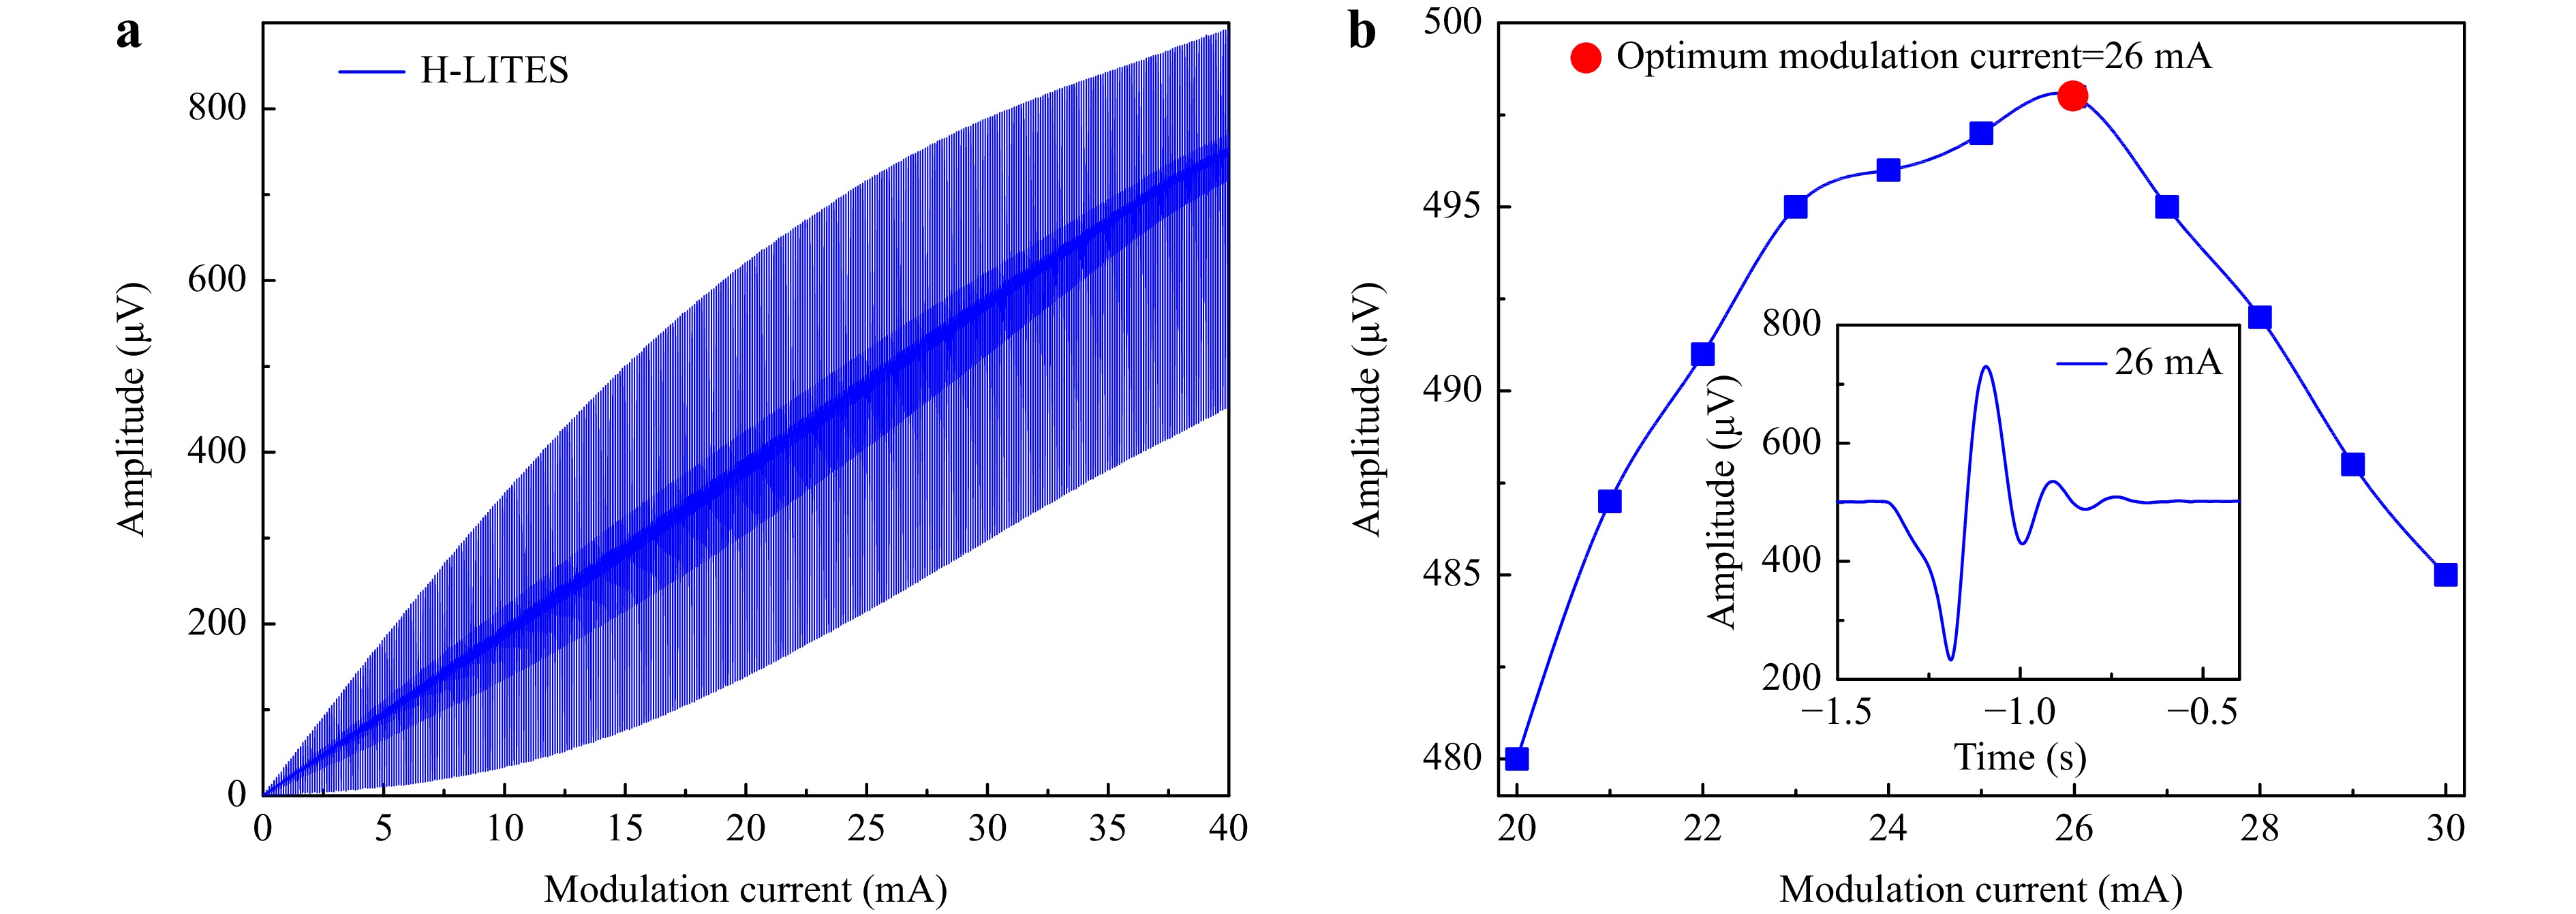
Fig. 5 Optimisation of modulation current: a Amplitude of 1f H-LITES signal versus modulation current from 0–40 mA; b Peak-to-peak amplitude versus modulation current from 20–30 mA.
The wavelength-scanning rate determines the strength of the transient response of the QTF, which affects the signal amplitude of H-LITES. Thus, the effects of the rise time and rise amplitude of the sawtooth variant on the 1f H-LITES signal amplitude were investigated; the results are shown in Fig. 6. The rise time and amplitude of the variant sawtooth synergistically determine the wavelength-scanning rate. As the wavelength scanning rate increased, the 1f H-LITES signal amplitude initially increased and then decreased. The optimum rise time and rise amplitude of the variant sawtooth were 0.3125 s and 0.35 mV, respectively.
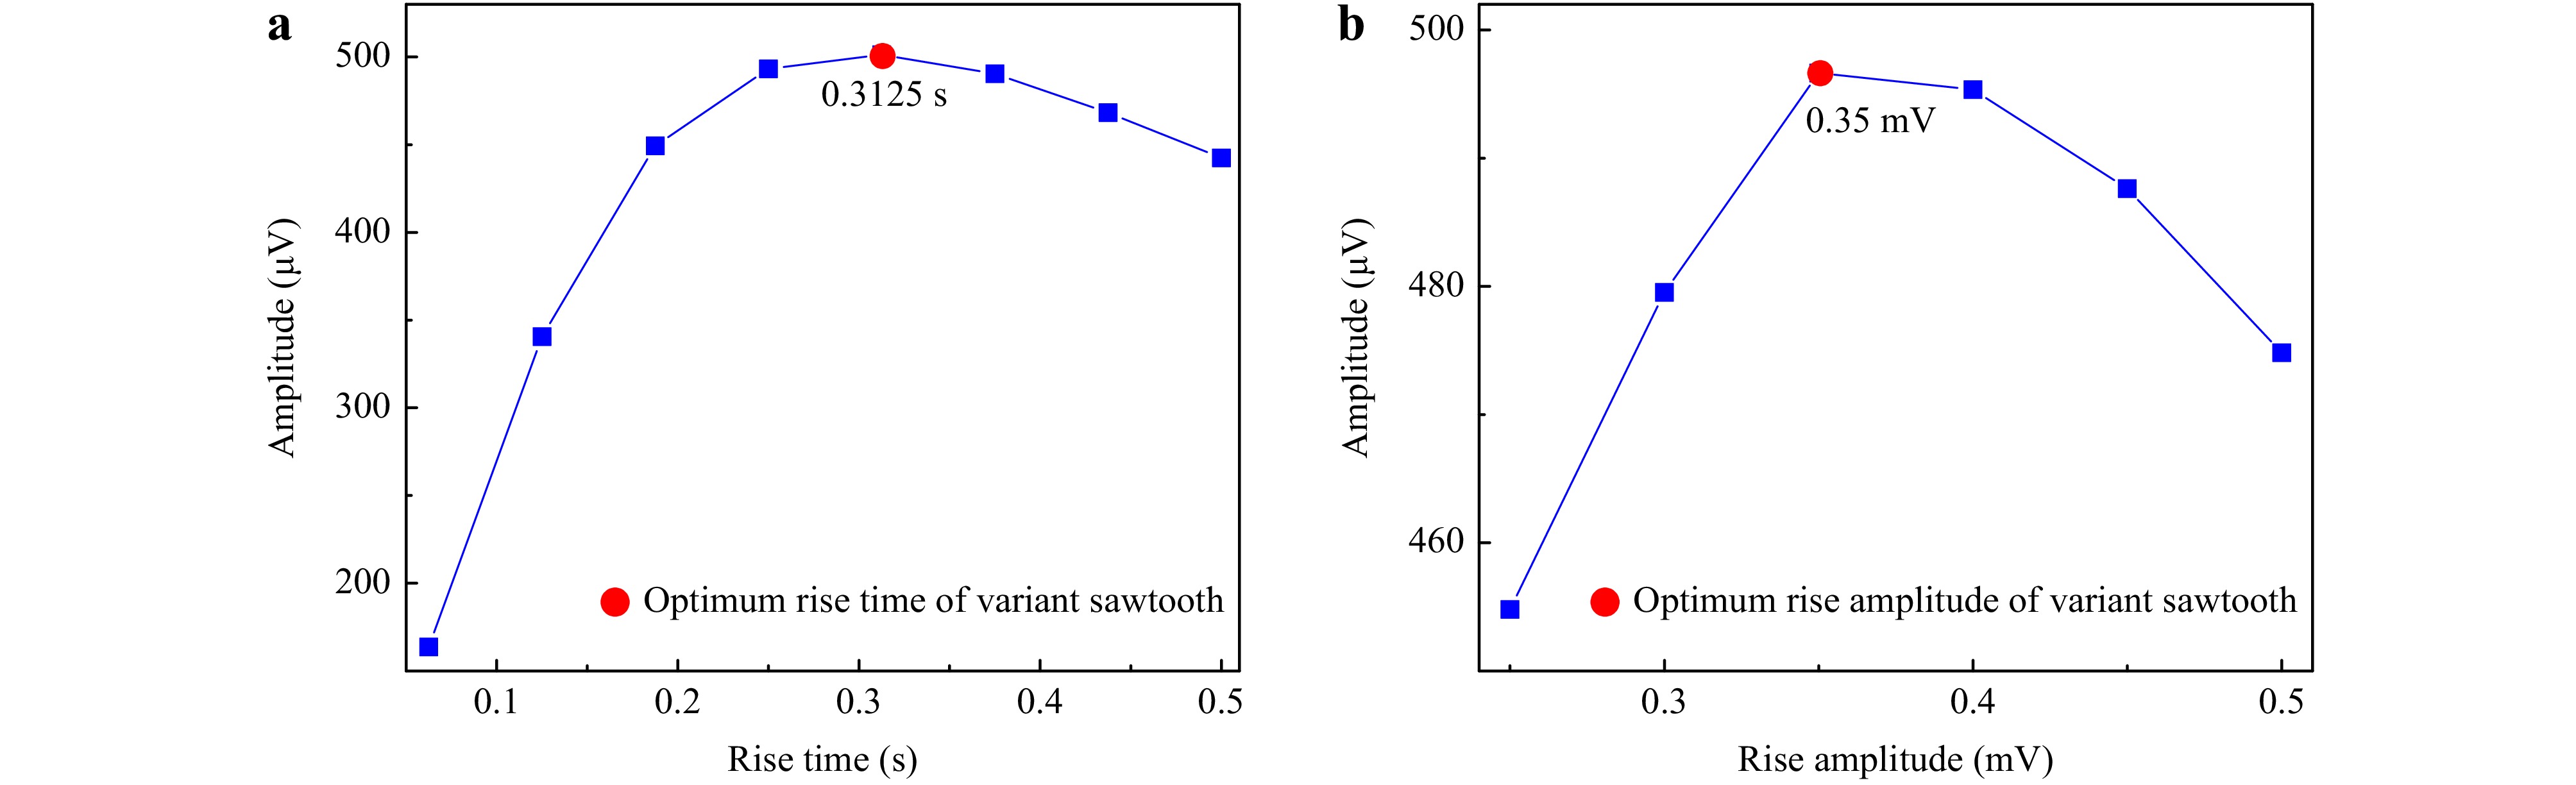
Fig. 6 Optimisation of rise time and rise amplitude for variant sawtooth: a Optimisation of rise time for variant sawtooth; b Optimisation of rise amplitude for variant sawtooth.
The heterodyne signal depends on the difference between the modulation frequency and intrinsic frequency. A sufficiently large bandwidth is required to detect heterodyne signals. However, as the detection bandwidth increases, the background noise increases and the signal-to-noise ratio (SNR) deteriorates. Thus, it is necessary to experimentally optimise the detection bandwidth of the lock-in amplifier. The optimisation results are shown in Fig. 7. The detection bandwidth of the lock-in amplifier was determined based on the filter order and integration time (TC). When the filter order was 3, the SNR of 1f H-LITES first improved and then deteriorated with an increase in TC. The optimum TC was 15 ms; the corresponding 3-dB detection bandwidth was 5.306 Hz. The 1f H-LITES signal obtained directly from the electrical signal with an optimal SNR of 689.67 is shown in Fig. 7.
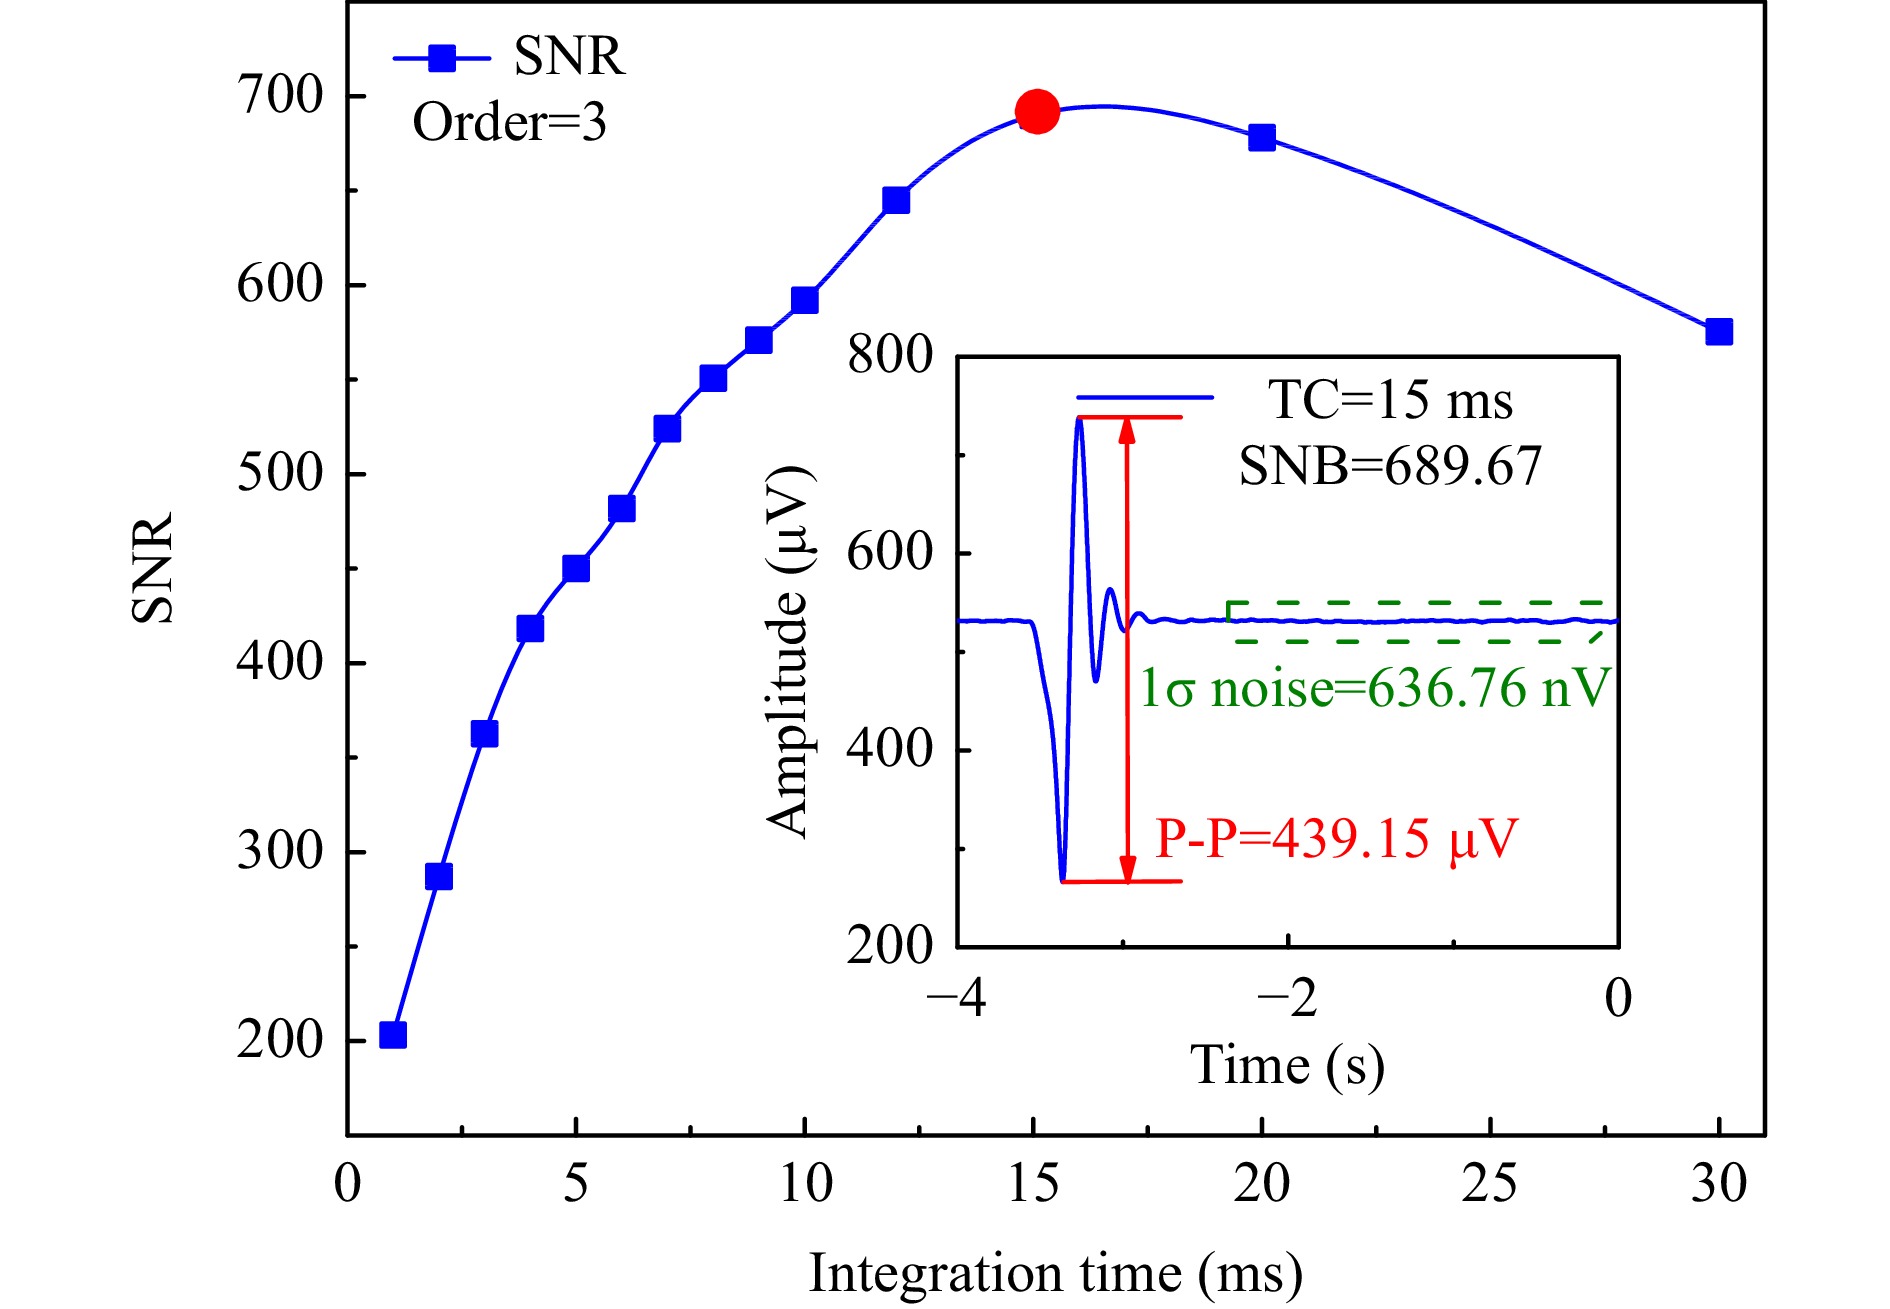
Fig. 7 Optimisation of detection bandwidth of lock-in amplifier (P-P: peak-to-peak).
The parameters affecting the H-LITES signal including the laser modulation frequency, modulation depth, laser wavelength scan rise time, amplitude, and detection bandwidth of the lock-in amplifier were optimised directly through electrical demodulation. For the piezoelectric effect, the amplitude of the H-LITES signal was proportional to the mechanical vibration of the QTF; the H-LITES signal based on the FPI was positively correlated with the mechanical vibration of the QTF. Thus, regardless of whether heterodyne signals were obtained through electrical or F–P demodulation, the optimum parameters were applicable. The parameters were all set to optimum values in the following H-LITES system based on the FPI.
The F–P double-beam interference spectrum was measured using a C-band high-stability amplified spontaneous emission (ASE) source, a photodetector (PD), and a spectrometer, fitted using a sine function, as shown in Fig. 8. According to the F–P interference spectrum, the length of the F–P cavity was calculated as approximately 70 μm. The first derivative of the fitted sine function predicted subsequent theoretical results for F–P intensity demodulation.
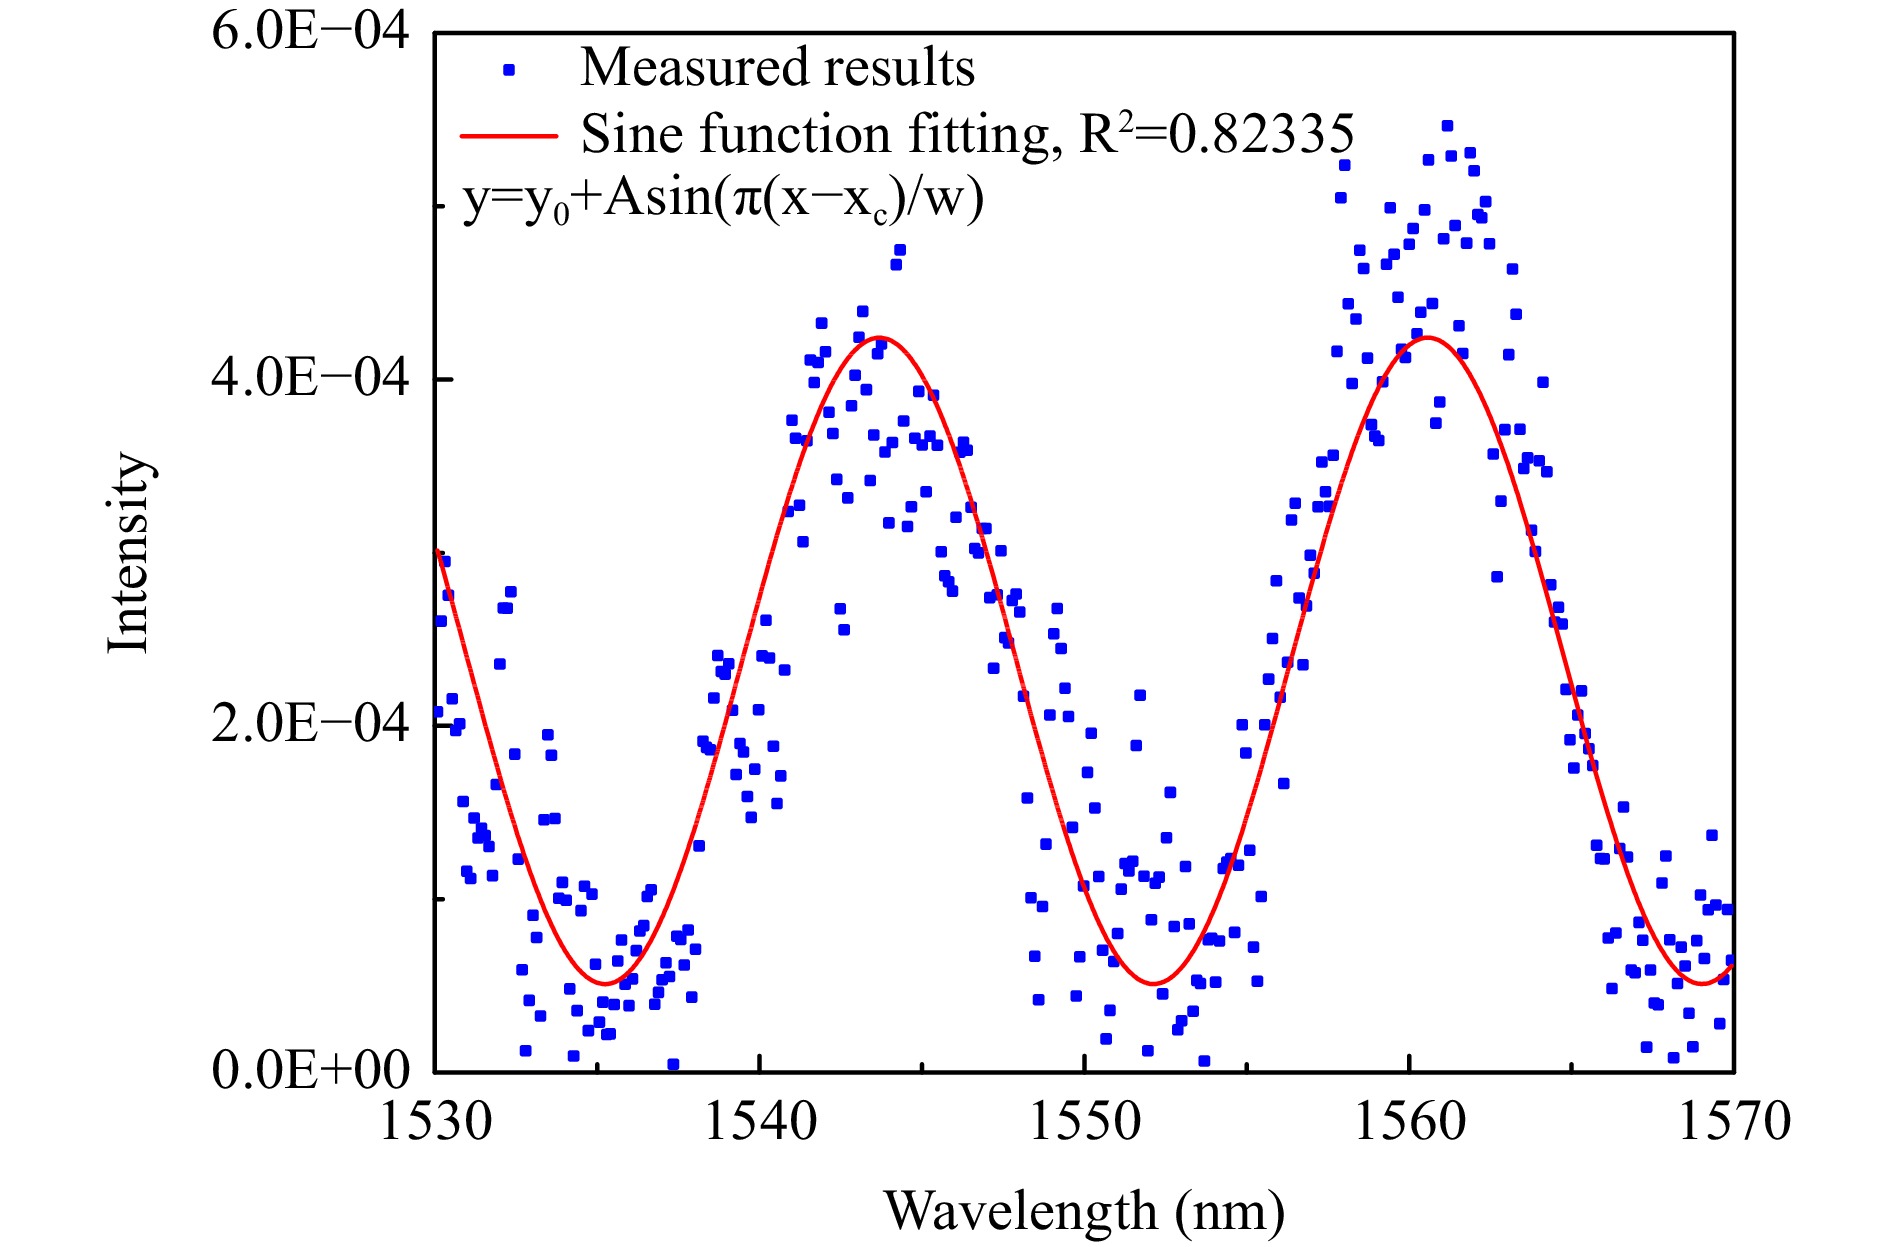
Fig. 8 Experimentally measured FPI interference spectrum and related sine function fitting.
The 1f H-LITES signals based on FPI with the intensity and phase demodulation methods are shown in Fig. 9a, b, respectively. The two heterodyne signals differed only in the demodulation method and were observed in identical conditions. When the C2H2 concentration was 20000 ppm and the power of the probe laser was 20 mW, the SNRs of the 1f H-LITES signals based on FPI with intensity and phase demodulation methods were 722.92 and 864.29, respectively. Compared to the 1f H-LITES signal obtained directly from the electrical signal, the 1f H-LITES signal based on FPI had a greater SNR. It has been demonstrated that the F–P phase demodulation method can produce better detection performance than the intensity demodulation method.
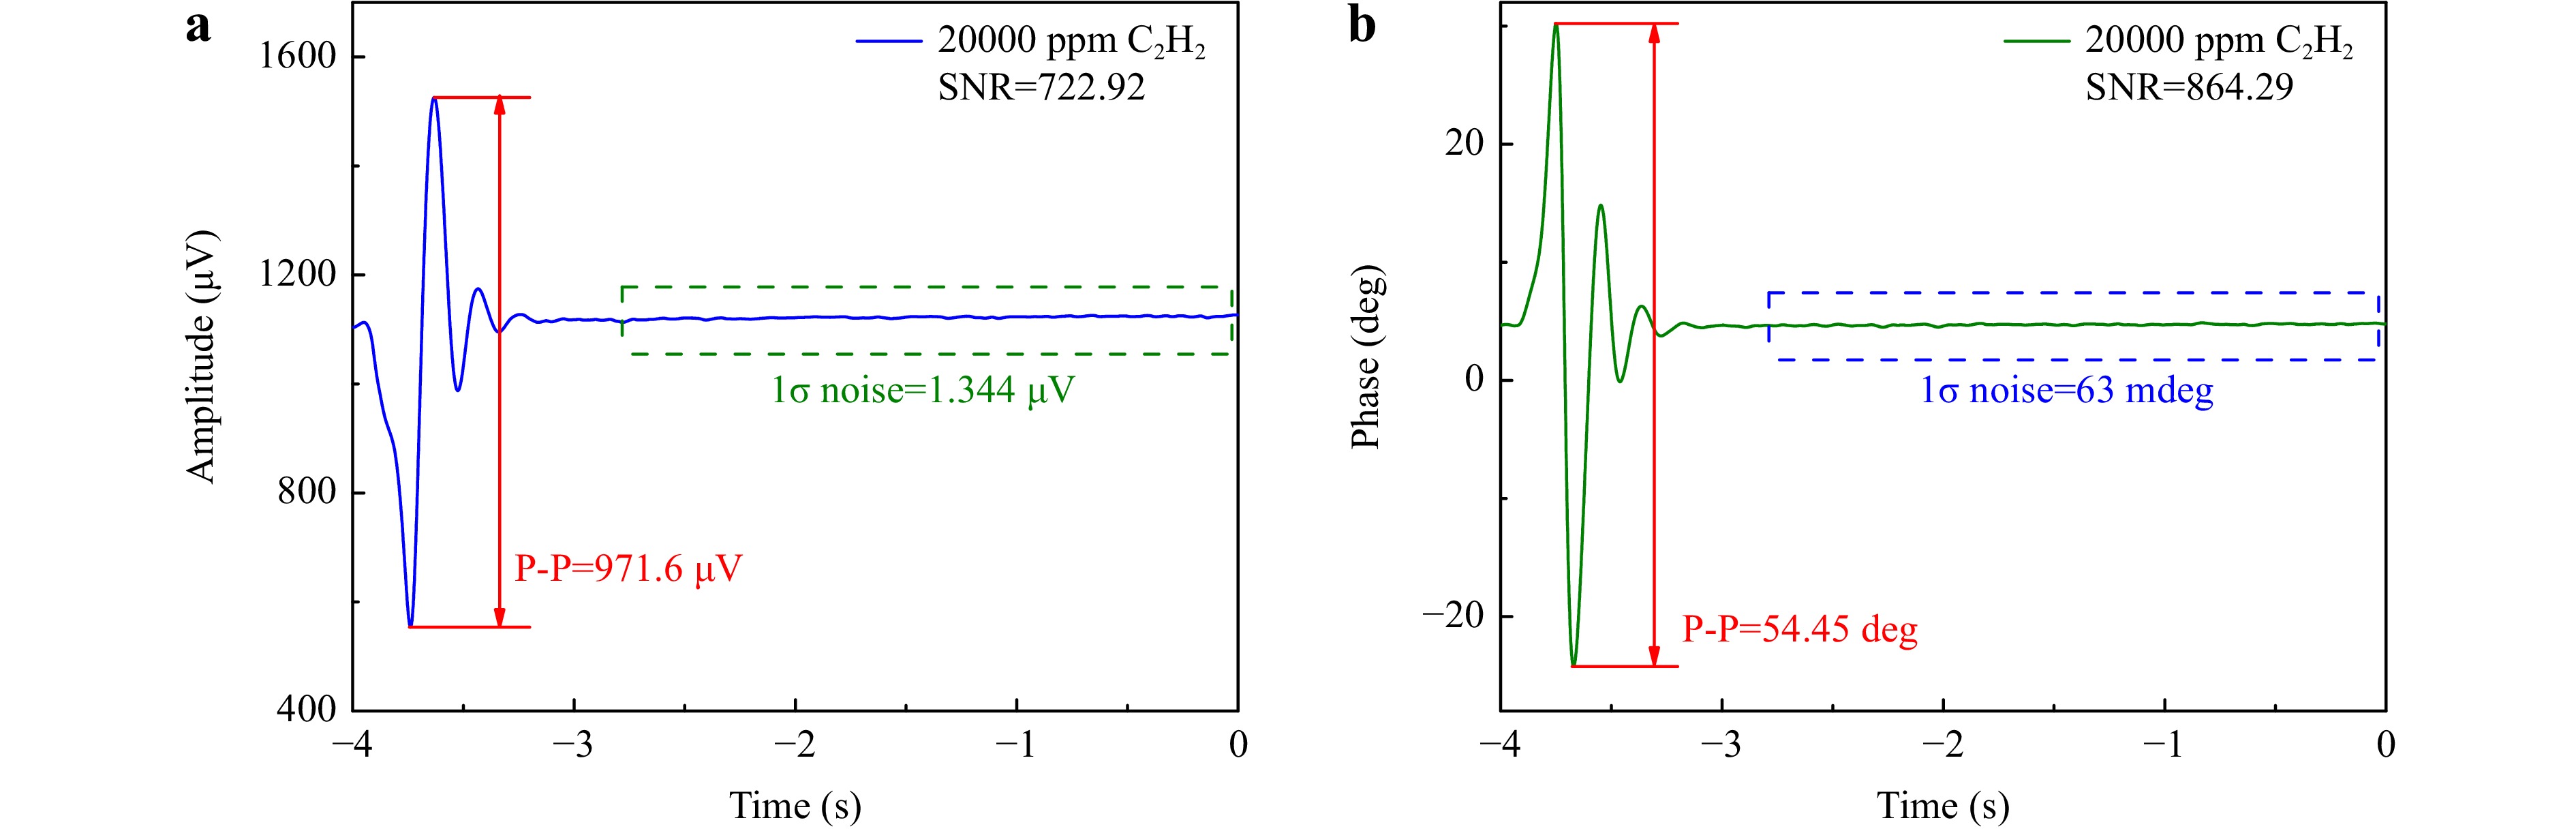
Fig. 9 1f H-LITES signals based on FPI: a with intensity demodulation method; b with phase demodulation method.
To verify the concentration response of the 1f H-LITES sensor based on FPI using the intensity and phase demodulation methods, 1f H-LITES signals were detected with different concentrations of C2H2. The peak-to-peak values of the 1f H-LITES signals are shown in Fig. 10. Linear fitting was performed on the peak-to-peak values at different concentrations; the R2 values for the intensity and phase demodulation methods were 0.98376 and 0.99679, respectively. The 1f H-LITES sensor based on FPI exhibited an excellent linear response to C2H2 concentration levels. Compared with the intensity demodulation method, the phase demodulation method produces a better linear response.
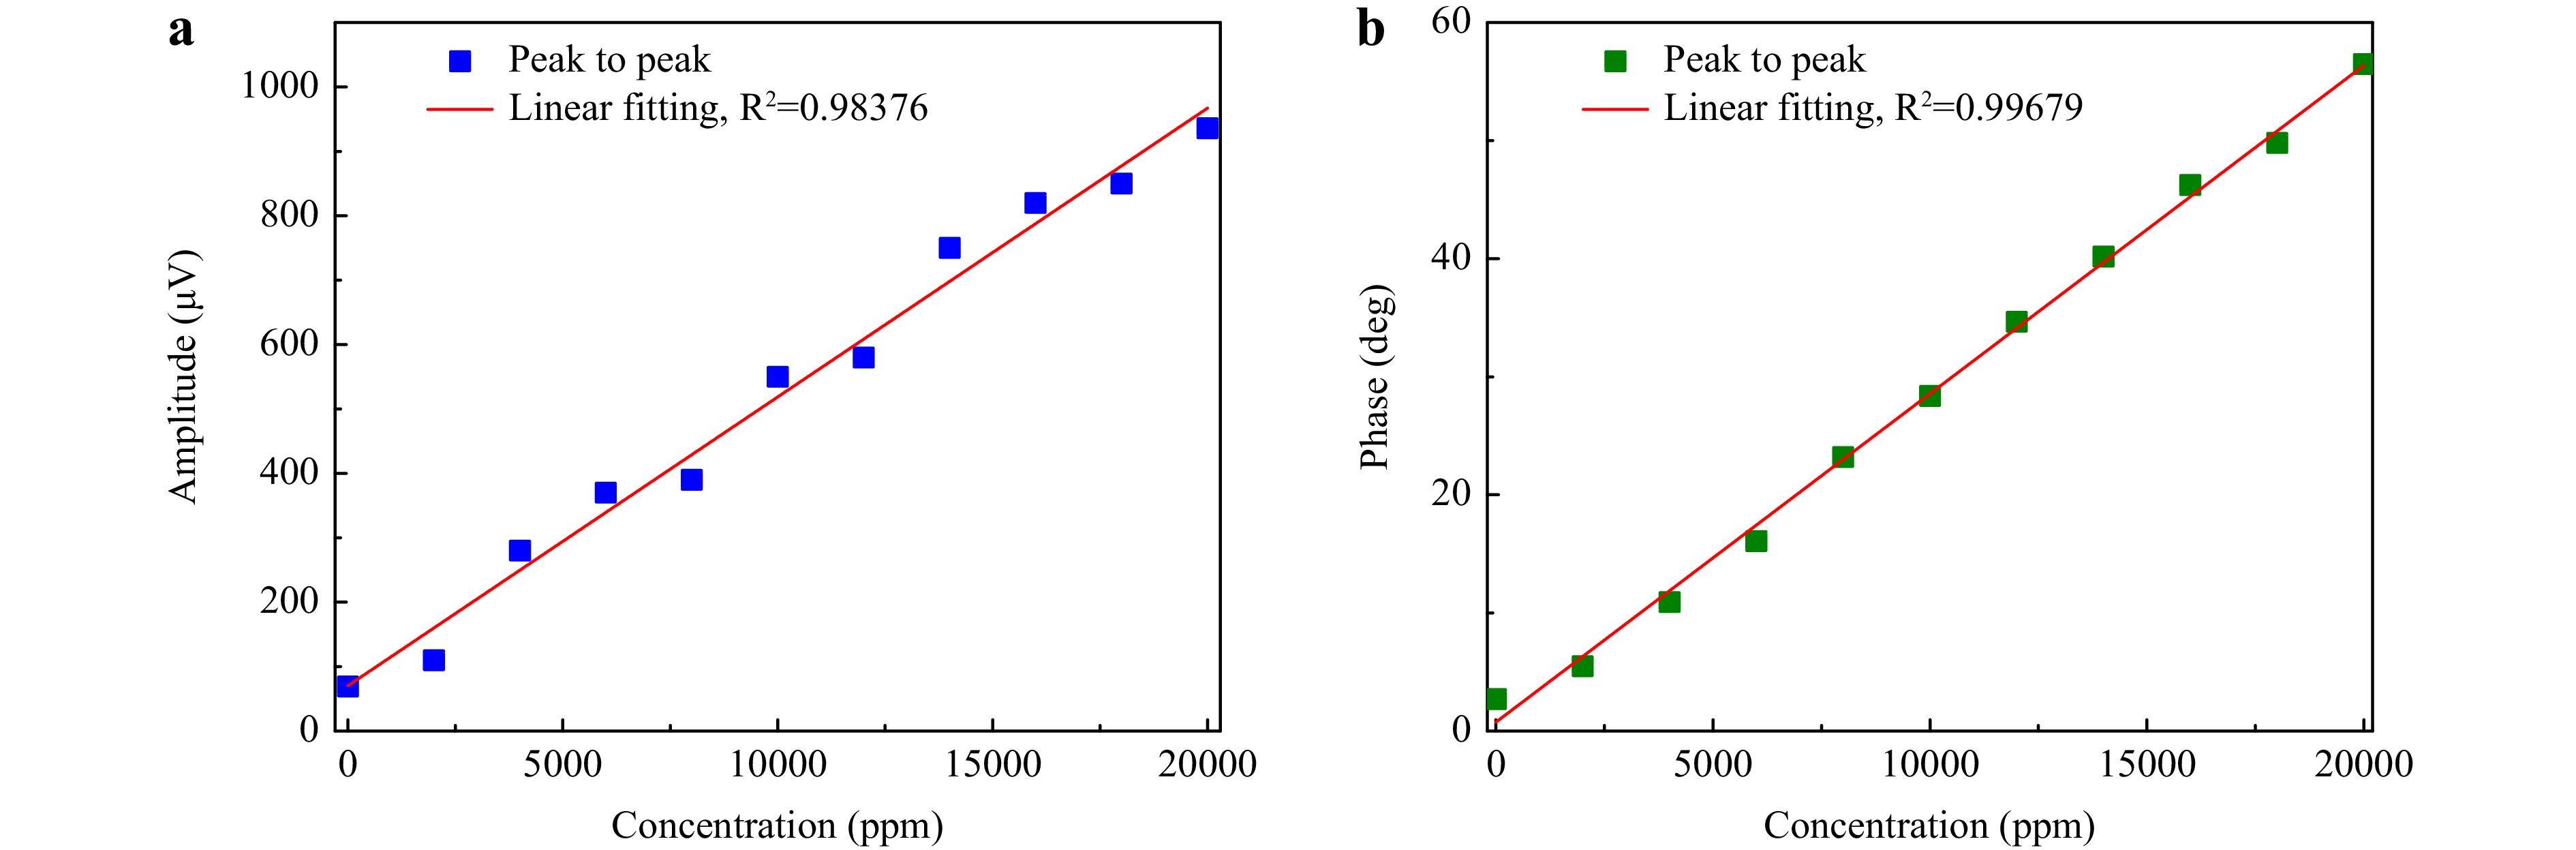
Fig. 10 Concentration response of 1f H-LITES sensor based on FPI: a with intensity demodulation method; b with phase demodulation method.
The power response of the 1f H-LITES sensor based on FPI with intensity and phase demodulation methods was investigated. The probe laser power was varied from 5 mW to 20 mW. The peak-to-peak values of the 1f H-LITES signals were extracted and plotted against the power of the probe laser, as shown in Fig. 11a, b. The peak-to-peak values had a linear relationship with the probe laser power when the intensity demodulation method was used. The R2 was 0.96289, indicating that the sensor was easily disturbed by laser fluctuation. Using the phase demodulation method, the peak-to-peak values were generally consistent, with an average of 55.54° and a standard deviation of 0.64°, significantly different from the results obtained using the intensity demodulation method. The phase demodulation method is immune to disturbances from the laser source, and can produce excellent detection performance even with a low-power probe laser.
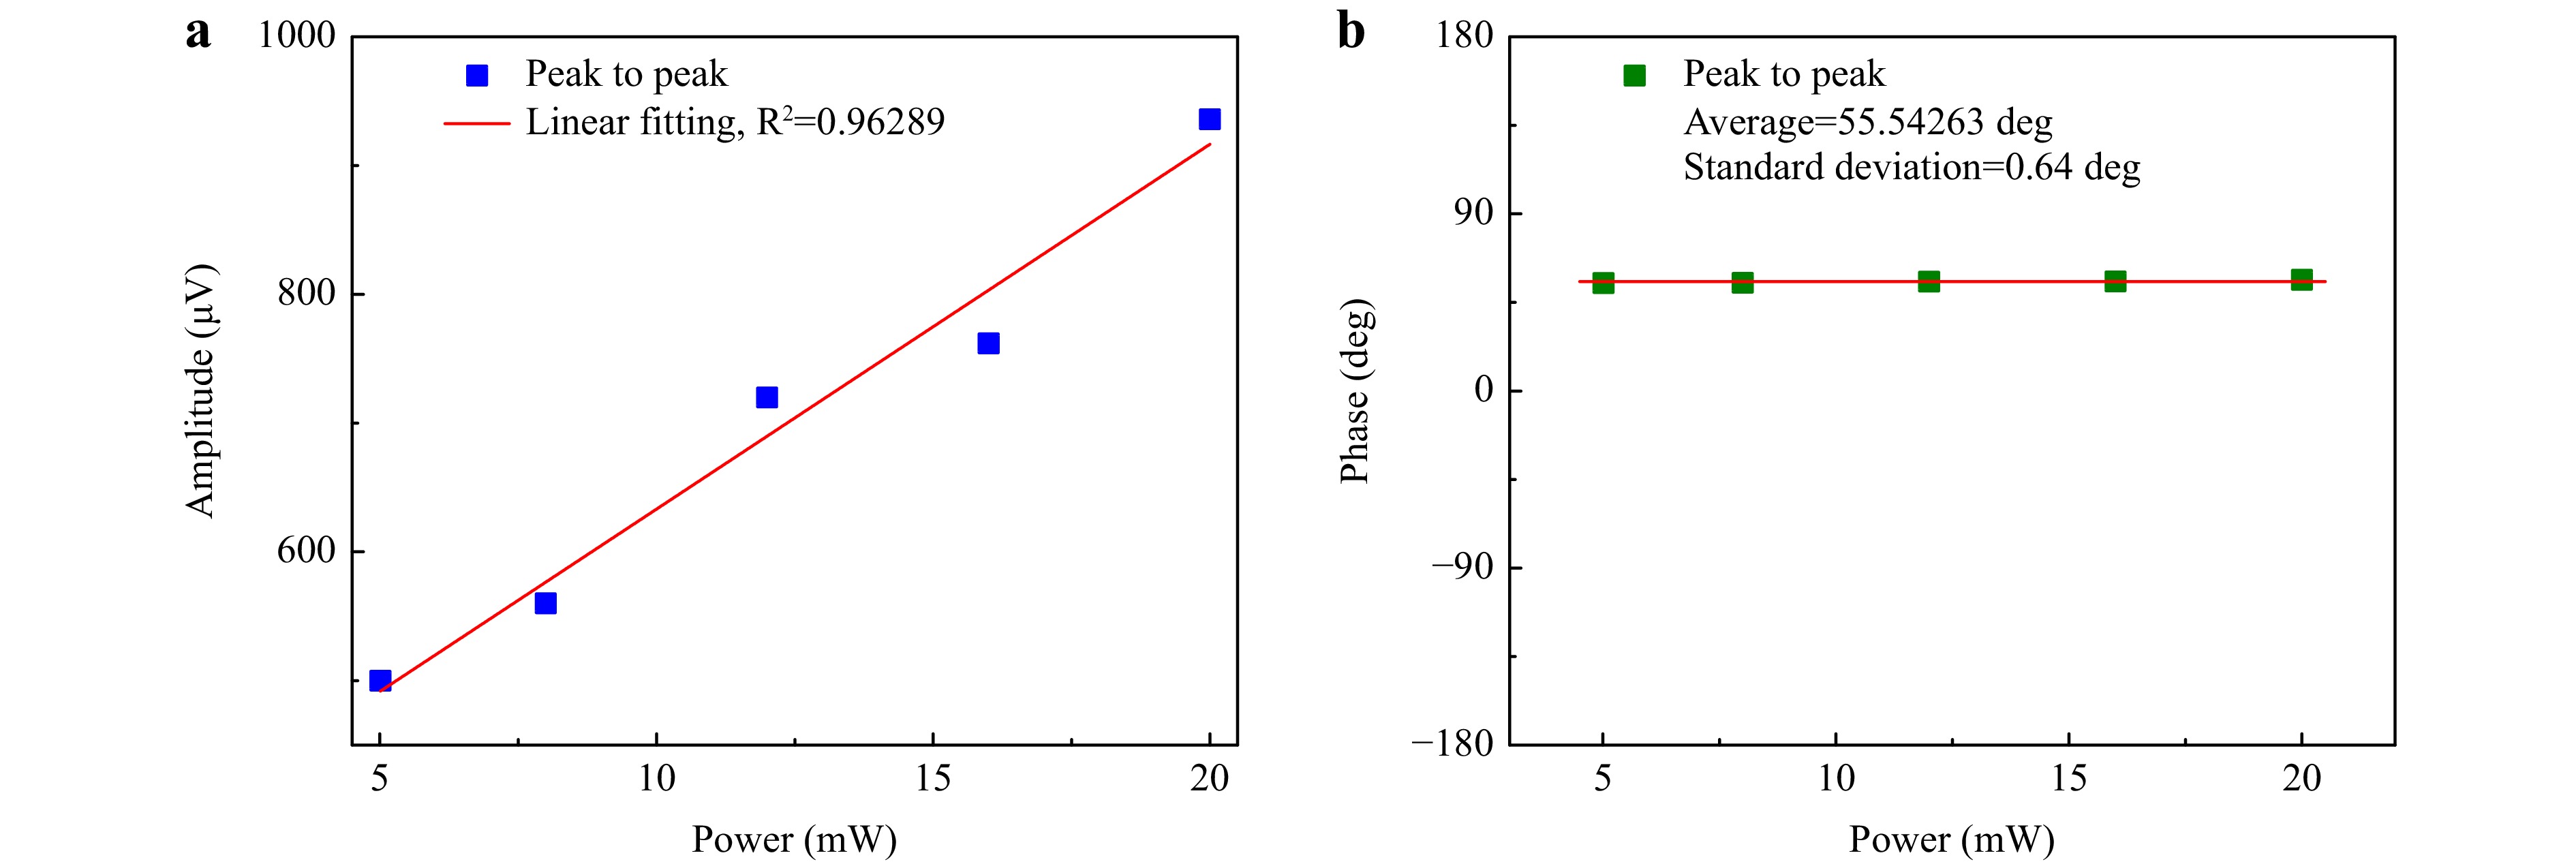
Fig. 11 Power response of 1f H-LITES sensor based on FPI: a with intensity demodulation method; b with phase demodulation method.
The 1f H-LITES signals with different probe laser wavelengths were measured using the intensity and phase demodulation methods to confirm the wavelength response of the FPI-based 1f H-LITES sensor. The peak-to-peak values are shown in Fig. 12. The probe laser wavelength was varied from 1536 nm to 1555 nm in intervals of 1 nm. According to the intensity demodulation theory, the variation in the reflected laser intensity in the FPI determines the peak-to-peak value. The first derivative of the sine fitting function for the F–P double-beam interference spectrum was considered as the theoretical value when the intensity demodulation method was used, as shown in Fig. 12a. The different peak-to-peak values were related to the probe laser wavelength. The sensor had the highest sensitivity when the wavelength was located at the Q-point. The experimental peak-to-peak values of the 1f H-LITES signals based on FPI versus the probe laser wavelength using the intensity demodulation method are shown in Fig. 12b. The experimental and theoretical results are consistent. The experimental peak-to-peak values of the 1f H-LITES signals based on FPI versus the probe laser wavelength using the phase demodulation method are shown in Fig. 12c. Compared with the intensity demodulation method, the peak-to-peak values remained constant at wavelengths from 1536 nm to 1555 nm. The phase demodulation method is approximately wavelength-independent, with the same sensitivity at any wavelength; it does not require the wavelength to be fixed at the Q-point, and is immune to laser wavelength disturbances. Q-point drifting due to ambient interference can be overcome using the phase demodulation method in the FPI.
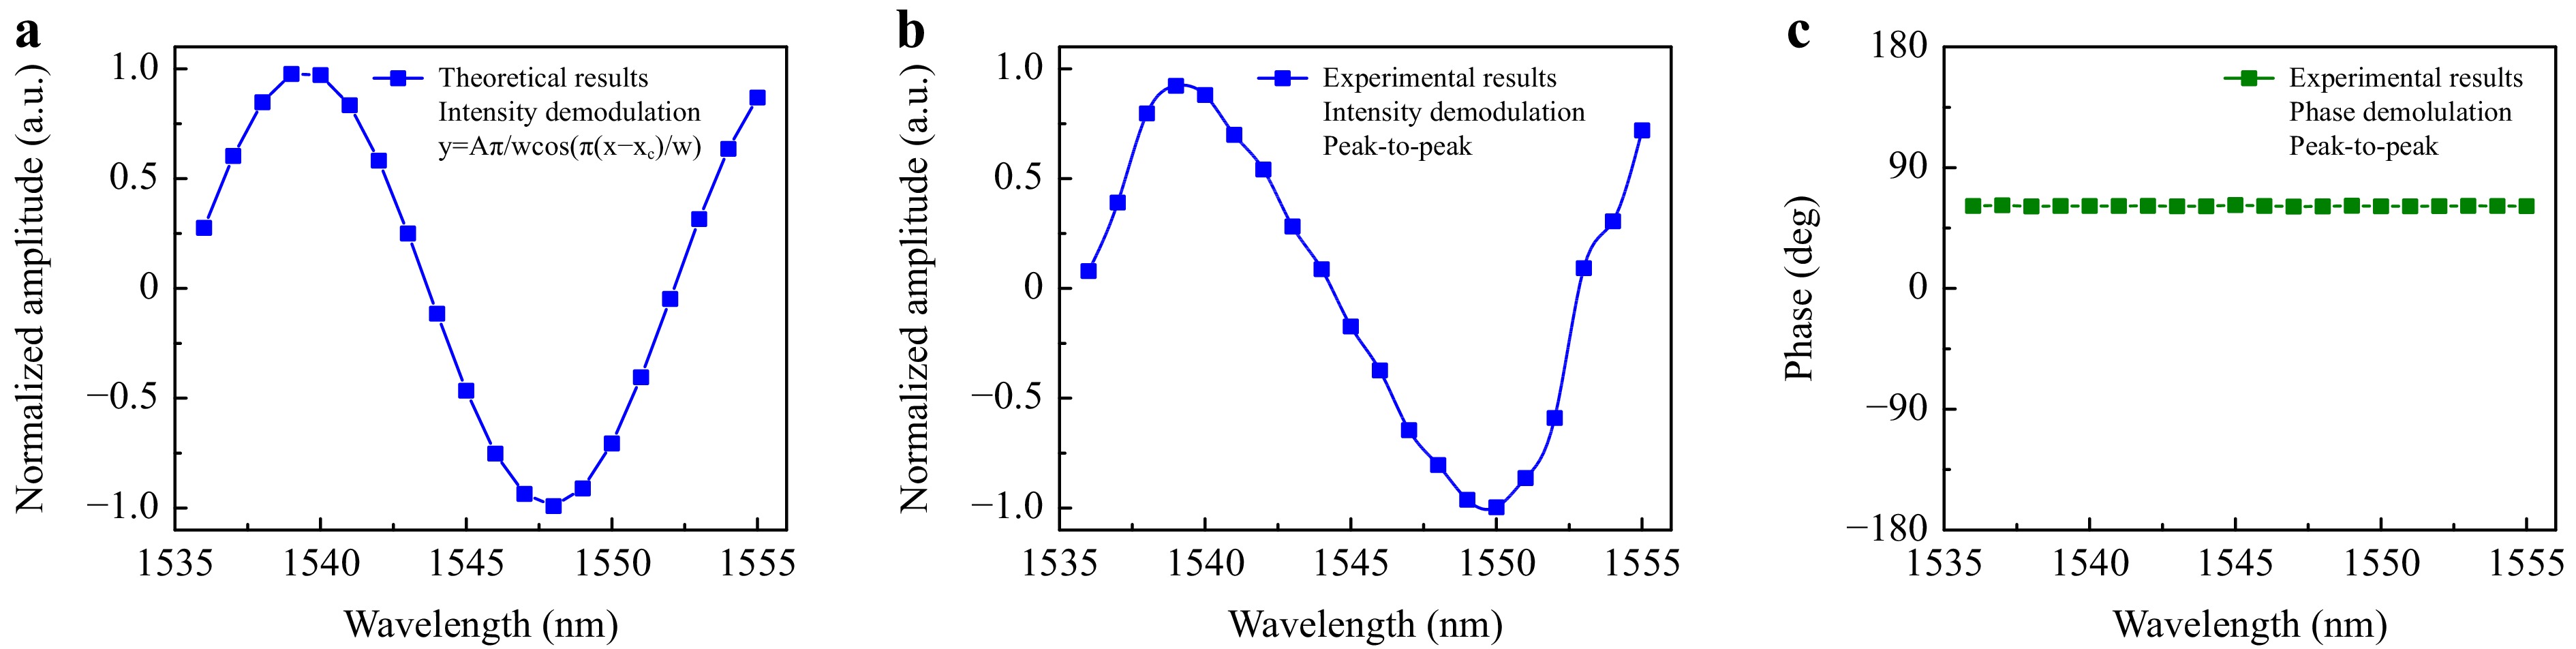
Fig. 12 Wavelength response for probe laser of 1f H-LITES sensor based on FPI: a theoretical results using intensity demodulation method; b measured results using intensity demodulation method; c measured results using phase demodulation method (a.u., arbitrary units).
The long-term stability of the 1f H-LITES C2H2 sensor based on the FPI using the intensity and phase demodulation methods was evaluated, as illustrated in Fig. 13. The measurements lasted for nearly 30 min. Affected by environmental parameters such as temperature and humidity, the F–P interference spectrum and the Q-point drifted. Using the intensity demodulation method, the peak-to-peak values of the 1f H-LITES signals gradually decreased over time; the stability was poor, resulting in a poor linear effect, as shown in Fig. 11a. In comparison, because the phase demodulation method is approximately wavelength-independent, the F–P interference spectrum drift did not affect the phase demodulation results. The peak-to-peak values of the 1f H-LITES signals obtained using the phase demodulation method were consistent, demonstrating that FPI-based 1f H-LITES with phase demodulation had excellent system stability.
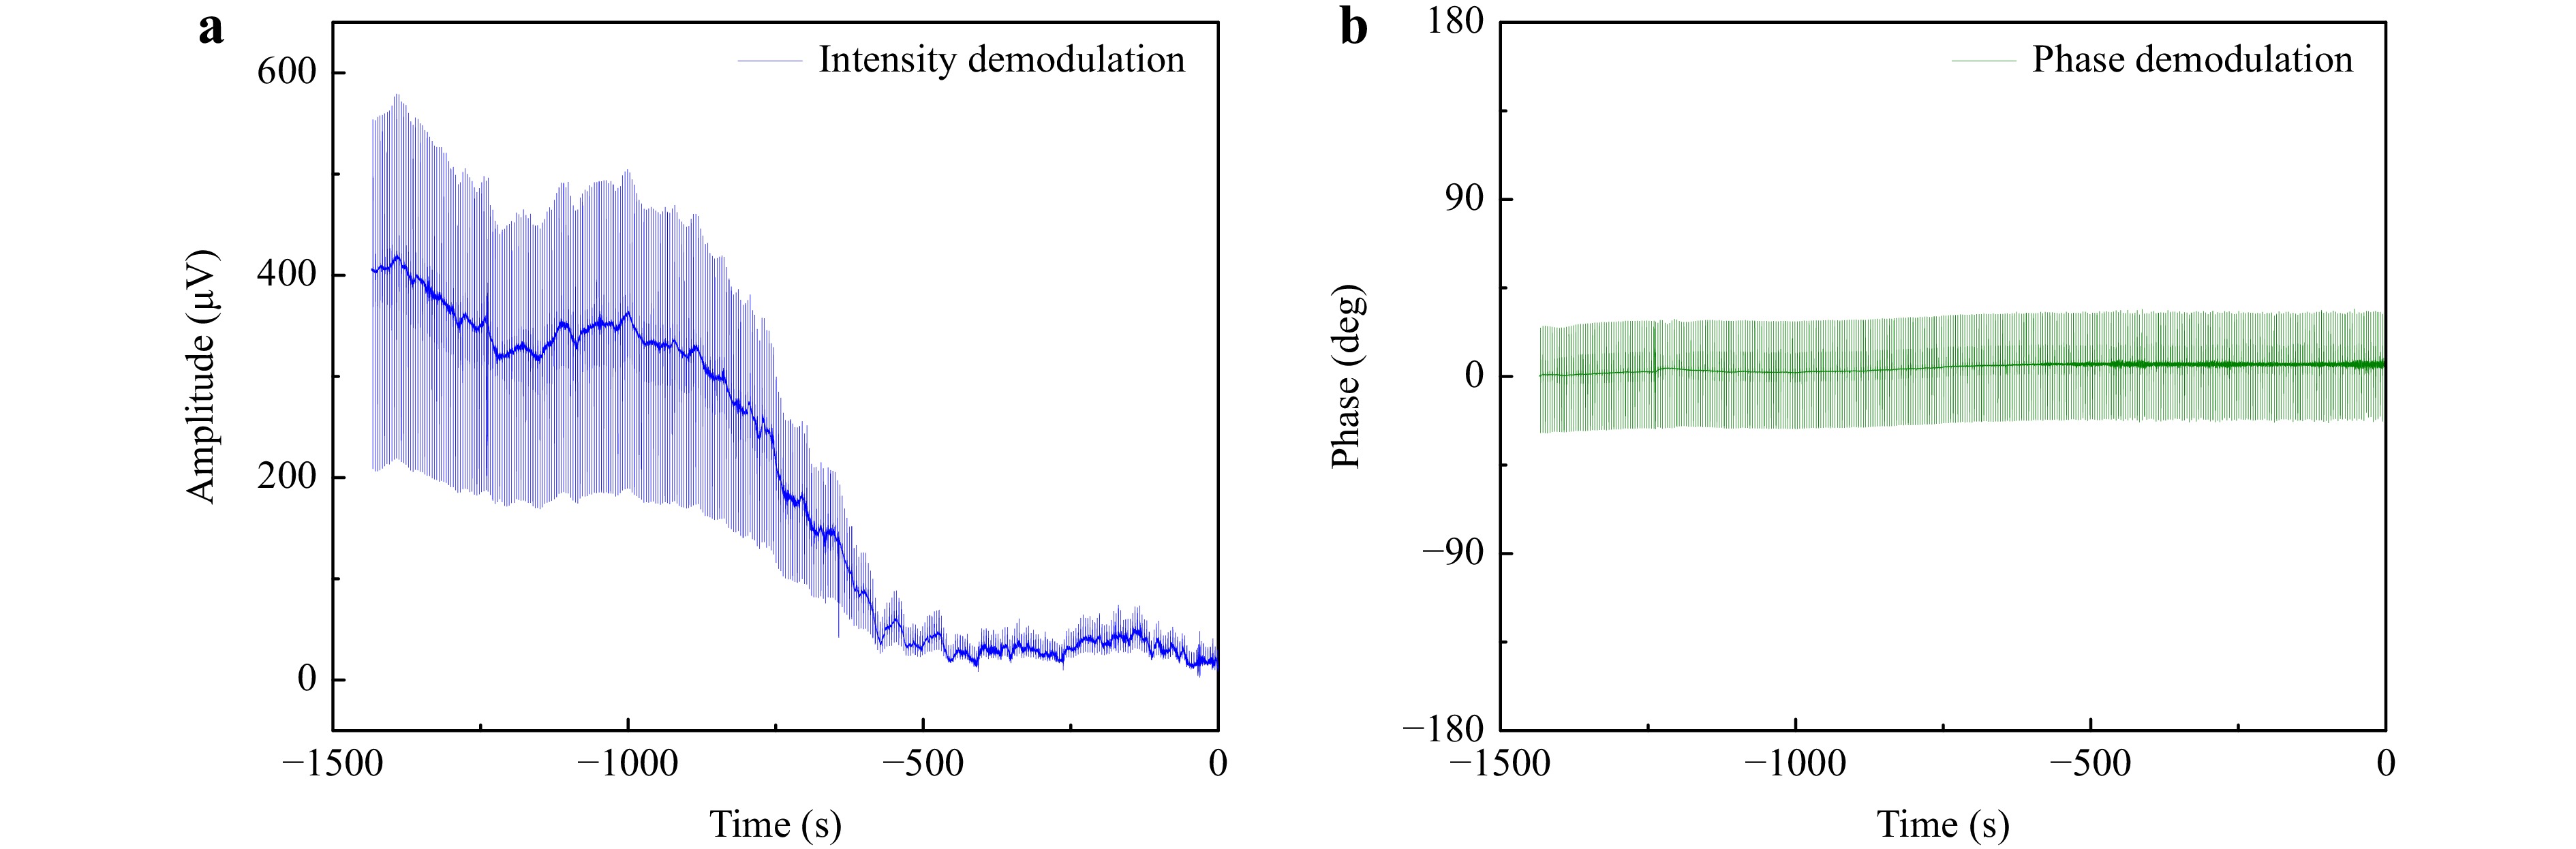
Fig. 13 Long-term stability of 1f H-LITES sensor based on FPI: a using intensity demodulation method; b using phase demodulation method.
-
An F–P phase-demodulation-based H-LITES sensor was demonstrated for the first time in this study. With obvious thermal noise in traditional LITES, the detection performance is restricted, particularly when a high-power laser is used. To avoid the influence of thermal noise, the vibration of the QTF can be detected using F–P demodulation instead of electrical demodulation. The F–P cavity was composed of the end-face of the SMF and a side of the QTF prong. When the QTF vibrated from the effect of photothermoelastic energy conversion, the F–P cavity length changed. The vibration of the QTF caused by gas absorption was determined by demodulating the shift in the F–P cavity length using intensity and phase demodulation methods to invert the gas concentration. With its achievable frequency calibration and rapid response, H-LITES was used; 20000 ppm C2H2 was used to verify the sensor performance. The parameters affecting the heterodyne signals, including the laser modulation frequency, modulation depth, laser wavelength scan rise time, amplitude, and detection bandwidth of the lock-in amplifier, were optimised in the experiments. The optimum values of these parameters were 6 Hz, 26 mA, 0.3125 s, 0.35 mV, and 5.306 Hz, respectively. The SNRs of the 1f H-LITES signals based on FPI using the intensity and phase demodulation methods were 722.92 and 864.29, respectively, in the same conditions, indicating better detection performance using the phase demodulation method. The concentration, power, and wavelength responses, and the long-term stability of the 1f H-LITES sensor based on the FPI, were determined using the intensity and phase demodulation methods. The concentration response linearity and long-term stability were better using the phase demodulation method than using the intensity demodulation method. Furthermore, in contrast to the intensity demodulation method, the peak-to-peak value obtained using the phase demodulation method was independent of the probe laser power and wavelength. The phase demodulation method is immune to interference from the laser source and wavelength, and can resolve the issue of Q-point drifting due to ambient interference.
-
We are grateful for financial support from the National Natural Science Foundation of China (Grant Nos. 62022032, 62275065, 61875047, and 61505041), the Key Laboratory of Opto-Electronic Information Acquisition and Manipulation (Anhui University), the Ministry of Education (Grant No. OEIAM202202), and the Fundamental Research Funds for Central Universities.
Fabry–Perot-based phase demodulation of heterodyne light-induced thermoelastic spectroscopy
- Light: Advanced Manufacturing 4, Article number: (2023)
- Received: 31 May 2023
- Revised: 20 July 2023
- Accepted: 20 July 2023 Published online: 21 August 2023
doi: https://doi.org/10.37188/lam.2023.023
Abstract: Fabry–Perot (F–P)-based phase demodulation of heterodyne light-induced thermoelastic spectroscopy (H-LITES) was demonstrated for the first time in this study. The vibration of a quartz tuning fork (QTF) was detected using the F–P interference principle instead of an electrical signal through the piezoelectric effect of the QTF in traditional LITES to avoid thermal noise. Given that an Fabry–Perot interferometer (FPI) is vulnerable to disturbances, a phase demodulation method that has been demonstrated theoretically and experimentally to be an effective solution for instability was used in H-LITES. The sensitivity of the F–P phase demodulation method based on the H-LITES sensor was not associated with the wavelength or power of the probe laser. Thus, stabilising the quadrature working point (Q-point) was no longer necessary. This new method of phase demodulation is structurally simple and was found to be resistant to interference from light sources and the surroundings using the LITES technique.
Rights and permissions
Open Access This article is licensed under a Creative Commons Attribution 4.0 International License, which permits use, sharing, adaptation, distribution and reproduction in any medium or format, as long as you give appropriate credit to the original author(s) and the source, provide a link to the Creative Commons license, and indicate if changes were made. The images or other third party material in this article are included in the article′s Creative Commons license, unless indicated otherwise in a credit line to the material. If material is not included in the article′s Creative Commons license and your intended use is not permitted by statutory regulation or exceeds the permitted use, you will need to obtain permission directly from the copyright holder. To view a copy of this license, visit http://creativecommons.org/licenses/by/4.0/.

 DownLoad: